Estimating the Soil Volume Conversion Factor of Weathered Ground with Consideration of Field Situations
Kyu-Nam Jin1, Gye-Chun Cho2, Jung-Min Lee3, Hee-Hwan Ryu4 and Sung-Wook Park5 (Received March 5, 2011 / Revised April 5, 2011 / Accepted April 20, 2011)
ABSTRACT
It is very important for successful construction to estimate the soil volume conversion factor of domestic weathered ground accurately and reasonably. However, it is very difficult to quantify the weathering degree of weathered ground at the field, so that the soil volume conversion factor used in Korea is often dependent upon the standard of foreign countries. Besides, the soil volume conversion factor of domestic weathered ground has been rarely studied and the use and accuracy of the soil volume conversion factor have been questioned persistingly.
This study suggests a simple but robust method for estimating the soil volume conversion factor and measuring the weathering degree reasonably, and attempts to establish the utilization of a soil volume conversion factor measurement system based on experimental and analytical results. We made relationship between electrical resistivity and weathering degree presented from weathering index obtained through laboratory tests using field samples, and an estimation method of in-situ weathering degree for granites and a calculation method of soil volume conversion factor using electrical resistivity. And also, we suggested the photogrametry measurement-equipment system for measuring the volume of cargo box and the application plan of stand equipment and RFID for calculating the earth volume and distinguishing buggies in order to design the measurement system for soil volume conversion factor applicable to the field. Ultimately, the Weathered Earth-work Management Program (WEMP) was developed, so field managers may easily obtain the information about earth volume and soil volume conversion factor at the weathered ground.
Key words:Weathered ground, Soil volume conversion factor, Weathering degree, WEMP
http://lhi.lh.or.kr
1) Researcher Fellow, Land & Housing Institute (Main author: [email protected])
2) Associate Professor, Department of Civil and Environmental Engineering, KAIST (Corresponding author: [email protected]) 3) Researcher Fellow, Land & Housing Institute
4) Postdoctoral fellow, Department of Civil and Environmental Engineering, KAIST 5) Manager, R&D center, NEXGEO corp.
1. Introduction
Two-thirds of the nation’s total land area is granite bedrock and many construction projects are performed on granite ground or residual soil. The characteristics of granite ground and residual soil are different according to the component ratio of minerals composing the parent rock and that causes a variation of engineering characteristics. The variation of engineering charac- teristics in granite ground and residual soil is larger than in other types of ground. In particular, granite ground involves strength reduction and deformation because granite ground is altered by water and weathering processes rapidly occur in exposed granites (Fookes et al., 1988; Irfan & Dearman, 1978).
Such characteristics of weathered granites often affect the stability of the underground structure.
The factors influencing the weathering process are climate,
kinds of host rock, drainage conditions, geographical features, vegetation, and so on. The climate condition, such as temperature and rainfall, has the most effect on the weathering process (Saunders, 1970). The increment of temperature and rainfall caused recently by global warming is promoting the weathering of weathered granite ground and residual soil. The weathering of rock has a six-step weathering classification system according to the degree of weathering: fresh (F), slightly weathered (SW), moderately weathered (MW), highly weathered (HW), com- pletely weathered (CW), and residual soil (RS) (Dearman et al., 1978). Many researchers have investigated the relationship between the weathering classification system and the properties of rock, such as density, specific gravity, porosity, void ratio, saturation, and so on (Baynes et al., 1978; Infan & Dearman, 1978; Lumb, 1983).
The change of engineering characteristics caused by weathering
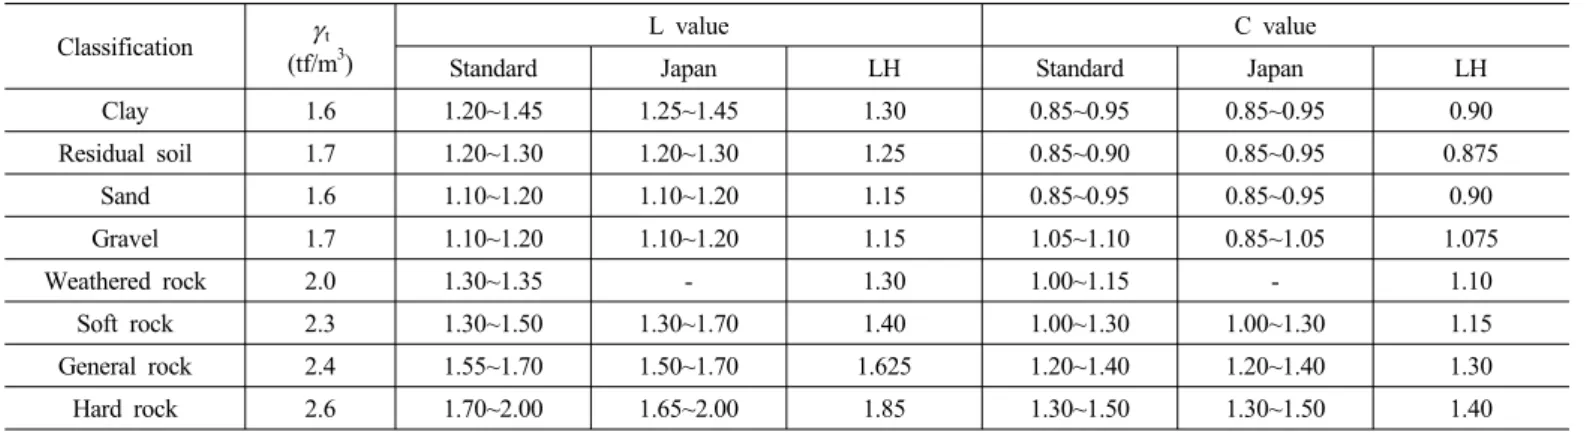
Table 1. Soil volume conversion factors
Classification γt
(tf/m3)
L value C value
Standard Japan LH Standard Japan LH
Clay 1.6 1.20~1.45 1.25~1.45 1.30 0.85~0.95 0.85~0.95 0.90
Residual soil 1.7 1.20~1.30 1.20~1.30 1.25 0.85~0.90 0.85~0.95 0.875
Sand 1.6 1.10~1.20 1.10~1.20 1.15 0.85~0.95 0.85~0.95 0.90
Gravel 1.7 1.10~1.20 1.10~1.20 1.15 1.05~1.10 0.85~1.05 1.075
Weathered rock 2.0 1.30~1.35 - 1.30 1.00~1.15 - 1.10
Soft rock 2.3 1.30~1.50 1.30~1.70 1.40 1.00~1.30 1.00~1.30 1.15
General rock 2.4 1.55~1.70 1.50~1.70 1.625 1.20~1.40 1.20~1.40 1.30
Hard rock 2.6 1.70~2.00 1.65~2.00 1.85 1.30~1.50 1.30~1.50 1.40
Fig. 1. Location of sampling in situ affects the soil volume conversion factor, which is a main
parameter for calculating the earth’s volume. The soil volume conversion factor is a very important element for estimating the construction costs, planing work sheets, and designing the complexes for huge complex development as follows:
(1)
(2)
However, our standard for estimating construction costs (Table 1) is taken from literatures abroad, and in particular, the soil volume conversion factor of weathered ground is used as that of soil because there exists no soil volume conversion factor for weathered ground at the present.
In addition, the weathered ground is considered as a uniform ground with weathered rock or with residual soil in the field. So, a serious economical loss occurs because the rock and soil generally coexist with weathered ground at a shallow depth.
For example, a difference of a minimum of five millions as margins can occur if a C value or a L value changes as much as 0.01 at 10,000m3 when the construction company calculates the cost of land creation (ref. the 2010 design guideline of civil construction no.891 presented from LH cooperation; except the labor cost, incidental expenses, and so on. Bed excavation:
9,000won/1m3, surplus soil transportation: 10,000 won/1m3, refilling: 3,500 won/m3). Economic problems can also occur because the performance of blasting can be determined by the weathering degree of rocks. Therefore, the soil volume conversion factor is applied differently on weathered ground as the weathering degree and the composition ratio of weathered rocks and residual soils.
The soil volume conversion factor of domestic weathered ground has been rarely studied except for some parts, so the estimation and use of soil volume conversion factors in the field are very difficult and the differences between performances and estimated designs of earth volume occur because of this problem.
Another problem is that construction inspection companies and the constructor have different opinions because the weathering degree of weathered ground is very difficult to quantify, and many studies and verifications are needed because a reasonable estimation of weathering degrees and soil volume conversion factors is a very important part for a successful construction.
Thus, to solve these problems, this study suggests a method that can estimate the soil volume conversion factor and develops a method that can calculate the weathering degree of granite using the electrical resistivity that is closely related to the flow of water.
A measurement system for the soil volume conversion factor is designed for field managers to easily obtain information about the earth volume and the soil volume conversion factor in weathered grounds.
2. Weathering degrees and electrical resistivity
2.1 Samples
Samples were collected for obtaining the relationship between weathering degrees and electrical resistivity values. Samples were collected at a 1-2 section (Fig. 1) of complex land under construction (Sejeong City), where the weathering process is in progress, and most of the ground is granites. The soil samples were collected by a sand-cone density apparatus (Fig. 2) and the
Fig. 2. Residual soil samples
Fig. 3. Weathered rock core samples
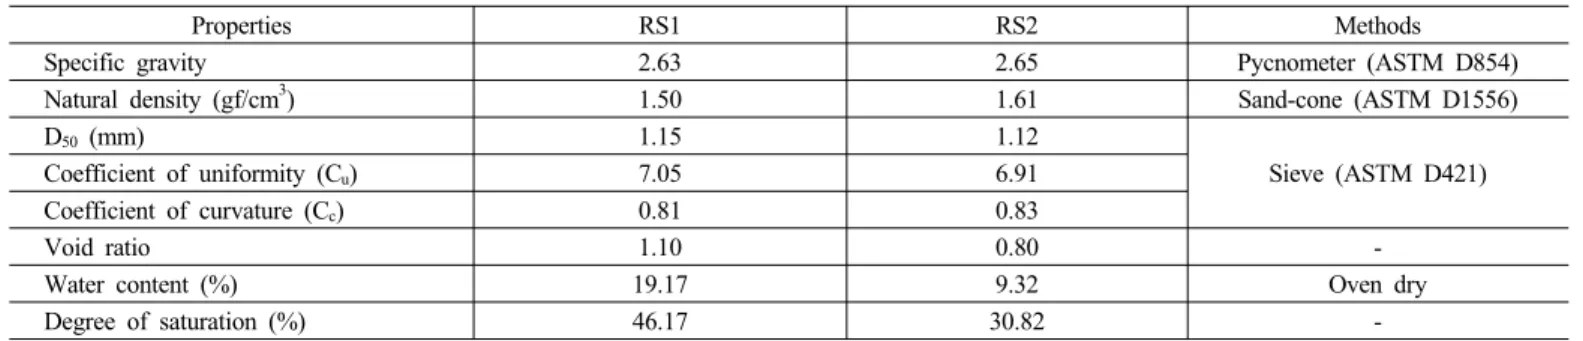
Table 2. Engineering properties of residual soils
Properties RS1 RS2 Methods
Specific gravity 2.63 2.65 Pycnometer (ASTM D854)
Natural density (gf/cm3) 1.50 1.61 Sand-cone (ASTM D1556)
D50 (mm) 1.15 1.12
Sieve (ASTM D421)
Coefficient of uniformity (Cu) 7.05 6.91
Coefficient of curvature (Cc) 0.81 0.83
Void ratio 1.10 0.80 -
Water content (%) 19.17 9.32 Oven dry
Degree of saturation (%) 46.17 30.82 -
Table 3. Properties of rock cores
Properties WR1 WR2 WR3 WR4 WR5 Methods
Apparent specific gravity 2.66 2.53 2.53 2.56 2.48
ASTM D6473
Apparent density (kgf/cm3) 2674.0 2665.9 2656.5 2637.2 2664.0
Absorption (%) 0.30 0.48 1.90 1.24 2.86
Table 4. Results of XRD tests (%)
Mineral Weathered granite Residual soils
WR1 WR2 WR3 WR4 WR5 RS1 RS2
Biotite 4.4 6.6 3.9 2.0 1.8 1.9 2.4
Albite 46.4 38.2 35.8 52.1 30.5 32.5 22.9
Microcline 19.1 21.3 27.3 17.1 13.4 20.7 19.2
Quartz 24.3 29.1 28.4 21.3 40.4 25.3 32.8
Muscovite - - - - 11.9 10.8 12.4
Chlorite 3.9 3.4 3.2 5.2 1.6 5.6 5.2
Magnetic 1.9 1.3 1.5 2.2 0.4 - -
Kaolinite - - - - - 3.3 5.1
rock samples were made as cores after collection (Fig. 3).
2.2 Properties of samples
The fundamental properties of the soil, such as water content, natural density, dry density, specific gravity, natural porosity, loose density, and particle size distribution were determined in the laboratory. The results are shown in Table 2 and Table 3 (RS1: 1-B of Fig. 2, RS2: 2-D of Fig. 2, WR1: 1-1A of Fig. 3, WR2: 1-1B of Fig. 3, WR3: 2-3D of Fig. 3, WR4: 1-2A of Fig. 3, WR5: 3A of Fig. 3).
2.3 Measurement of weathering degrees
The weathering degree of the samples must be obtained to establish the correlation between the weathering degree or the weathering classification of the samples and the electrical resistivity. The weathering degree of the samples was obtained from the chemical weathering index and the physical weathering index. XRD (X-ray Diffraction) tests were performed to analyze the chemical weathering indices (Table 4) and water absorption tests were performed to analyze the physical weathering indices.
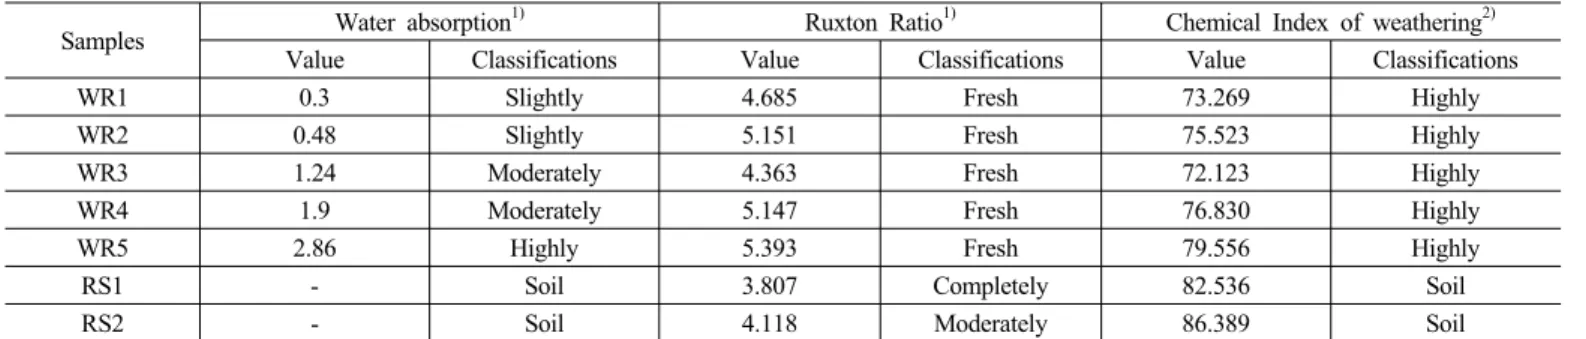
Table 5 shows the weathering classification and the weathering indices. In Table 5, the physical weathering index (water absorption
Table 5. Weathering indices and weathering classifications
Samples Water absorption1) Ruxton Ratio1) Chemical Index of weathering2)
Value Classifications Value Classifications Value Classifications
WR1 0.3 Slightly 4.685 Fresh 73.269 Highly
WR2 0.48 Slightly 5.151 Fresh 75.523 Highly
WR3 1.24 Moderately 4.363 Fresh 72.123 Highly
WR4 1.9 Moderately 5.147 Fresh 76.830 Highly
WR5 2.86 Highly 5.393 Fresh 79.556 Highly
RS1 - Soil 3.807 Completely 82.536 Soil
RS2 - Soil 4.118 Moderately 86.389 Soil
주) 1)Gupta and Rao (2001), 2)Hamois (1988)
Fig. 4. TEPS equipment Fig. 5. Analysis program
tests) is more reliable than the chemical weathering index because the method for classifying weathering degrees of Korean granites represents comparison of weathering classifications obtained by the chemical weathering index with weathering classifications obtained by the physical weathering index.
2.4 Weathering classification and electrical resistivity This study used the TEPS (Tunnel Electrical resistivity Pros- pecting System) for obtaining electrical resistivity values of samples (Fig. 4) (Ryu, 2010).
2.4.1 Characteristics of TEPS
A TEPS consists of the analytical equation, the relationship between the rock mass classification and the electrical resistivity, the inverse program, the control system, and the measurement system. The analytical equation is derived from electric field analysis ahead of the tunnel face with anomalies. Many field tests and laboratory tests have shown reliable prediction results in the range of 4~5 times the tunnel size ahead of the tunnel face. We used a TEPS to obtain the electrical resistivity values because it is possible to easily obtain electrical resistivity values from electrical resistance values measured at fields using analytical equations of the TEPS. Inverse programs were developed for using the TEPS on weathered ground by modifying it.
2.4.2 Measurement of electrical resistivity values Figure 6 shows the equipment used for measuring the electrical resistivity values of the weathered granites and residual soils using the TEPS. Electrical resistance values were measured as the degree of saturation.
Electrical resistivity values were obtained using measured electrical resistance values and the shape factor (Fig. 7). If the change of electrical resistivity values measured in the samples is expressed as trend lines, the equation is as follow:
13 4.56 4
10 3.401
8 2.241
7 2 .097
7 2.09
5 1.524
5 1.649
Sample 1-1A 1*10 * Sample 1-1B 5 *10 * Sample 2-3D 1*10 * Sample 1-2A 4*10 * Sample 3-A 1*10 * Sample 1-B (soil) 1.89 *10 * Sample 2-D (soil) 4.48*10 * S
S S
S S
S S
−
−
−
−
−
−
−
(3)
In Fig. 7, the measured electrical resistivity values were normali- zed as an electrical resistivity value of water used at saturation.
The relationship between saturation and normalized electrical resistivity according to weathering degrees is shown in Fig. 8.
(a) (b)
(c) (d)
Fig. 6. Measurement system of electrical resistivity values (a) Equipment for residual soils, (b) Measurement system, (c) Shape factor - residual soils, (d) Equipment for weathered rocks
Fig. 7. Measured electrical resistivity values
Fig. 8. Relationship between the weathering degree and the electrical resistivity according to the weathering classification
Fig. 9. Prediction results of weathering classification
The trend lines of each weathering classification can be expressed as follows.
Boundary line of SW
Boundary line of MW
3
2
40 (saturation) 10 (saturation)
bulk fluid bulk fluid
S S ρ
ρ ρ ρ
−
−
= ⋅
= ⋅ (4)
where ρbulk is the measured electrical resistivity value and ρfluid is the electrical resistivity value of the saturated liquid. Thus, weathering classifications can be predicted after applying the electrical conductivity of rocks and liquids predicted by an
inverse program on Eq. 4. A weathered rock is judged as a blasting rock if the predicted weathering classification of the rocks is above the MW class, and a weathered rock is judged as a ripping rock if the predicted weathering classification of the rocks is under the MW class, through a previous study (Geological Society, 1990).
2.5 Field applications
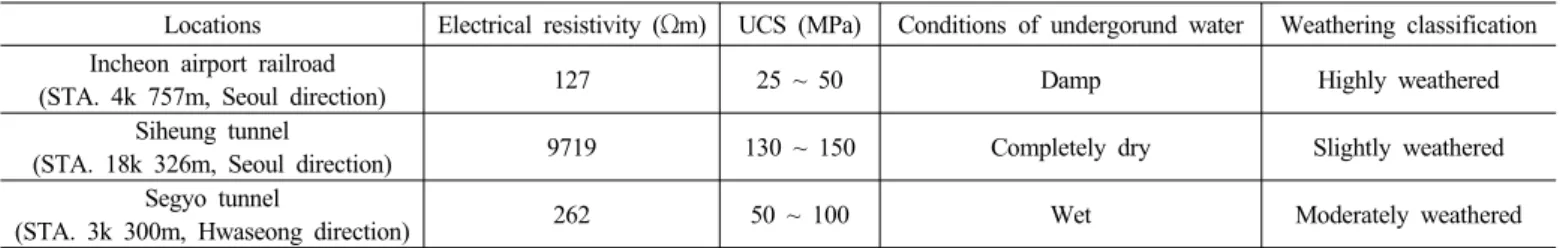
The results of field tests performed previously were used for verifying the results (Fig. 9) obtained by laboratory tests. The fields were tunnel sites that were constructed on rocks. The measured average electrical resistivity values, the mapping data, the uniaxial compressive strength (UCS) values, and the condition of the underground water are shown in Table 6. The weathering classifications in Table 6 are the values that can be obtained from the relationship between the UCS values and the weathering classification studied previously (Lee, 1989). The water condition of the rocks around a tunnel are classified as
Table 6. Field informations
Locations Electrical resistivity (Ωm) UCS (MPa) Conditions of undergorund water Weathering classification Incheon airport railroad
(STA. 4k 757m, Seoul direction) 127 25 ~ 50 Damp Highly weathered
Siheung tunnel
(STA. 18k 326m, Seoul direction) 9719 130 ~ 150 Completely dry Slightly weathered
Segyo tunnel
(STA. 3k 300m, Hwaseong direction) 262 50 ~ 100 Wet Moderately weathered
Table 7. Electrical resistivity values as saturations
Saturation (%) Electrical resistivity (Ωm)
SW (WR2) MW (WR3) HW (WR5) RS (RS1)
10 705494.5 1745.487 730.4840 12.94344
30 6382.389 174.3385 67.04233 2.643214
50 716.8221 59.72779 22.08258 1.262813
70 169.4099 29.49483 10.62595 0.776315
90 57.73949 17.41286 6.153008 0.539778
(a) (b) (c)
Fig. 10. Relationship between the electrical resistivity and the S/W ratio according to the weathering classification (a) Sightly weathered (SW), (b) Moderately weathered (MW), (c) Highly weathered (HW)
follows: completely dry, damp, wet, dripping and flowing. The degree of saturation of the rocks is further classified as completely dry: 0%~20%, damp: 21%~40%, wet: 41%~60%, dripping:
61%~80%, and flowing: 81%~100%. The saturation of the rocks around the tunnel on the Incheon airport railroad (X-XX zone) is 21%~40%, damp. The saturation of the rocks around the Siheung tunnel is 0%~20%, completely dry, and the saturation of the rocks around the Segyo tunnel is 41%~60%, wet. If measured electrical resistivity values and saturations of each field are applied on Fig.
8, the weathering classification of the rocks around STA. 4k 757m in the Seoul direction on the Incheon airport railroad (X-XX zone) is in a highly weathered state to moderately weathered state. The weathering classification of the rocks around STA. 18k 236m in the Seoul direction on the Siheung tunnel is in a moderately weathered state to slightly weathered state, and the weathering classification of the rocks around STA.
3k 300m in the Hwaseong direction on the Segyo tunnel is in a moderately weathered state to slightly weathered state. Fig. 10
shows these results. The results in Fig. 10 are a little different from the results in Table 6, nevertheless, the compared results show that the method for estimating the weathering classification of granites using the electrical resistivity suggested by this study is satisfactorily reliable. If sufficient data, such as the weathering classification of rock, are given for the fields and the method suggested in this study is complemented with previous methods that have been used to distinguish the weathering classification of rocks, it will be possible to estimate the weathering classification of granites rapidly and exactly in the fields.
3. Soil volume conversion factors and electrical resistivity
3.1 S/W ratio and electrical resistivity
The trend lines according to the weathering classification are as follows using the relationship between the weathering degree and the electrical resistivity according to the weathering classi- fication.
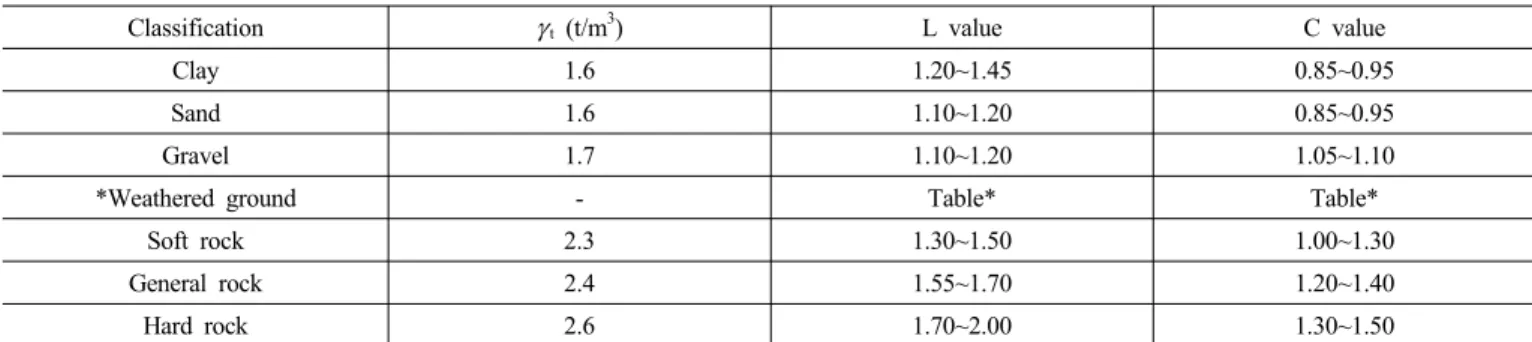
Table 8. Suggestion of soil volume conversion factors
Classification γt (t/m3) L value C value
Clay 1.6 1.20~1.45 0.85~0.95
Sand 1.6 1.10~1.20 0.85~0.95
Gravel 1.7 1.10~1.20 1.05~1.10
*Weathered ground - Table* Table*
Soft rock 2.3 1.30~1.50 1.00~1.30
General rock 2.4 1.55~1.70 1.20~1.40
Hard rock 2.6 1.70~2.00 1.30~1.50
*Weathered ground: it consists with residual soils and weathered rocks. We recommends TEPS (Tunnel Electrical resistivity Prospecting System) method for the estimation of S/W ratio.
Table * Soil volume conversion factors of weathered ground
Classification S/W ratio (%) C value L value
Residual soil 80 ~ 100 0.875 1.250
Poong A 60 ~ 80 0.931 1.263
Poong B 40 ~ 60 0.988 1.275
Poong C 20 ~ 40 1.044 1.288
Weathered rock 0 ~ 20 1.100 1.300
Slightly weathered (WR2)
∙ (5)
Moderately weathered (WR3)
∙ (6)
Highly weathered (WR5)
∙ (7)
Residual soil (RS1)
∙ (8)
Electrical resistivity values according to saturation can be obtained using Eqs. 5 to 8 (Table 7). If the ground with rocks and soils are formed in parallel (because electrical resistivity values largely affect the soils), a calculated electrical resistivity equation can be expressed as follow, according to the composition ratio of the soils
(9)
where ρm is the measured electrical resistivity values in the fields, ρs is the electrical resistivity of the residual soils, ρr is the electrical resistivity of the weathered rocks, S/W is the composition ratio of the soils in a totally weathered ground.
Electrical resistivity values with the composition ratio of the soils according to the weathering classification can be obtained if the soils and rocks of the weathered ground constantly exist regardless of depth (Fig. 10).
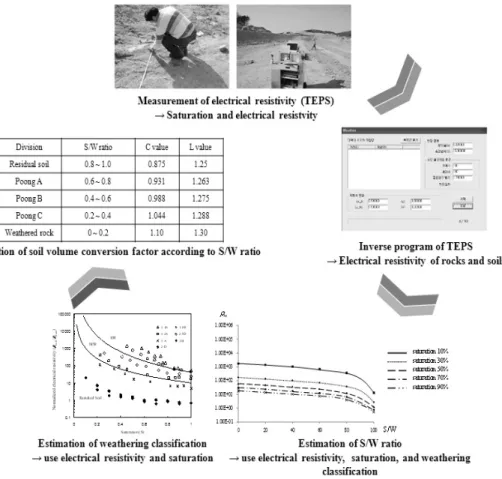
3.2 Acquisition of soil volume conversion factors using electrical resistivity
The earth-volume can be wrong as the S/W ratio of the weathered ground, despite of weathered ground in same regions.
Economic problems can arise because the plan of construction can be changed as the weathering classification and S/W ratio (eg., ripping, blasting). Therefore, this study suggests new soil volume factors table like Table 8. Ultimately the method that can obtain the soil volume conversion factor using electrical resistivity is as follows and Fig. 11 shows the general procedure of one example.
ⓐ Measure the degree of saturation after sampling rocks in the fields.
ⓑ Measure electrical resistivity values after samples are made into cores.
ⓒ Estimate the weathering classification of rocks using Fig. 8.
ⓓ Estimate the S/W ratio after the degree of saturation and electrical resistivity are applied to Fig. 10 according to the obtained weathering classifications.
ⓔ Estimate the soil volume conversion factor after the obtained S/W ratio are applied to Table 8.
3.3 Field applications
Field tests were performed for the application and verification of the suggested relationship between the electrical resistivity and the weathering classification. Field tests were performed at five sites (Fig. 12), and five sites are located in 1-2 section of complex land construction (Sejeong City) are the filling ground. The
Fig. 11. Method of estimating soil volume conversion factors using electrical resistivity
(a) (b)
(c) (d)
Fig. 12. Field tests (a) TEPS, (b) lateral lines, (c) Installation of sensors, (d) Measurements
procedure of the field tests and the acquisition of the results were performed as follows:
ⓐ Install the TEPS on the weathered ground.
ⓑ Install lateral lines. The length of a lateral line is about
10m~20m to objects.
ⓒ Install sensors. The gap between the sensors is about 1m~2m, but different from the length of the lateral lines.
ⓓ Measure the average degree of saturation, electrical resistance values of the surrounding rocks, and electrical resistance values on lateral lines using TEPS.
ⓔ Obtain the weathering classification of the measured objects from Fig. 8 using the degree of saturation, after converting the measured electrical resistance values of the surrounding rocks and the measured objects into electrical resistivity values (Ryu, 2010).
ⓕ Estimate the S/W ratio and soil volume conversion factors using the obtained weathering classification, the measured electrical resistivity values, and the degree of saturation (use Table 8 and Fig.10).
The measured average electrical resistivity values and the saturation at each field are listed in Table 9. Using Table 8, Fig. 8, and Fig. 10, we can obtain the soil volume conversion factors as in Table 10. Table 11 shows the cost of earthwork using the obtained results from this study (except the labor cost, the compaction cost, the blasting cost, and so on). The C values and L values obtained from a preliminary site investigation of the 1-2 section in the construction site of Sejeong City show huge
Table 9. Measured electrical resistivity values and saturation
Contents Site 1 Site 2 Site 3 Site 4-1 Site 4-2 Site 5-1 Site 5-2 Site 5-3 Site 5-4
Ave. ρ (Ωm) 102 124 487 123 144 154 224 168 187
Max. ρ (Ωm) 122 181 938 179 250 190 328 200 221
Min. ρ (Ωm) 70 91 279 63 112 119 159 134 129
Saturation (%) 20~30 20 20~30 5~10 5~10 5~15 5~15 5~15 5~15
Table 10. Measurement results
Locations Weathering classification S/W ratio (%) Division C value L value
Site 1 Highly weathered 70~80 Poong A 0.931 1.263
Site 2 Highly weathered 70~75 Poong B 0.931 1.263
Site 3 Moderately weathered 70 Poong C 0.931 1.263
Site 4 Residual soil - Residual soil 0.875 1.25
Site 5 Highly weathered 80 Poong A 0.931 1.263
Table 11. Economic analysis
Objects area (m3) Division L value C value Costs (billion) Note
1-2 section of complex land construction
(Sejeong City)
2,000,000
Weathered rock 1.30 1.10 about 48.3 -7.7
Residual soil 1.25 0.875 about 59.1 +3.1
Research result (Poong A) 1.263 0.931 about 56.0 -
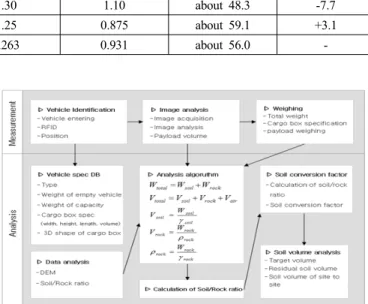
Fig. 13. Design of measurement system for soil volume conversion factor
differences compared to the C values and L values on the standard of construction estimate, so the construction applied residual soils and weathered rocks uniformly without using C values and L values obtained by experiments. Table 11 shows the suggested method in this study has differences of many billions if the ground of the borrow pit is used as residual soils and weathered rocks.
4. Measurement system for soil volume conversion factor
The method that can estimate the soil volume conversion factor using electrical resistivity is applicable to the borrow pit, so it will be useful at the design. However, this method has limitations in estimating the soil volume conversion factor of soils and rocks that are transported to each field. To solve this problem, a measurement system for the soil volume conversion factor is needed.
4.1 Design of measurement system for the soil volume conversion factor
The working process was analyzed to develop a measurement system for the soil volume conversion factor. Figure 13 shows the working process used to analyze the soil volume conversion factor from dump trucks with soils and rocks and the measu- rement equipment from each borrow pit. A field measurement system was designed to realize automatically the entry and exit of cars for manless management and to minimize the working hours for the smooth flow of cars and realizing automatically the materials of a cargo box using active RFID. The location of an
optical measurement system and weighing equipment were suggested to be installed around a clean equipment of filling area in fields.
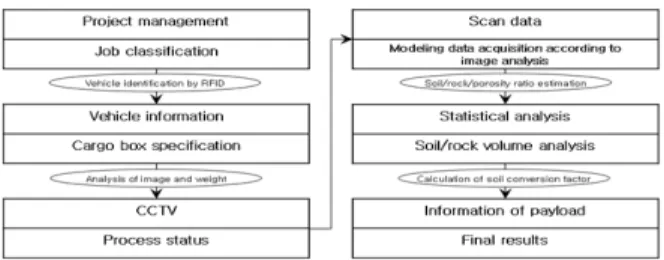
4.2 WEMP (Weathered Earth-work Management Program) The composition ratio, volume, and weight of soils and rocks can be calculated to measure the total volume and weight of soils and rocks transported from fields, using the measurement system for the soil volume conversion factor. A WEMP (Weathered Earth-work Management Program) was designed to make quality control easy in the fields to control the soil volume with equilibrium using obtained L values. The system has the information of dump trucks used at the fields and the specific gravity values of rocks, so the information on the filling area,
Fig. 14. Process flow of WEMP
Fig. 15. Main screen of WEMP
Project Borrow pit Information of cars
Fig. 16. Registration screening of projects, borrow pits, and information of cars
Analysis graph of L value as each borrow pit
Remaining earthwork volume as each method Existing method Developed method
Fig. 17. Application analysis of WEMP borrow pit, and cargo box can be automatically obtained if the
RFID realizes dump trucks transported from the borrow pits. In addition, the porosity and S/W ratio can be calculated by equations if the volume of loaded materials is calculated through image analysis methods and the weight of loaded materials is measured through weight equipment. Therefore, it is possible to predict the soil volume of filling and cutting by estimating the soil volume conversion factor using calculated S/W ratio (Fig. 14).
The main screen is composed of the information tap of cars and loaded materials, the statistics chart tap, the image scanning modeling tap, the CCTV screen tap that shows the entry and exit of cars in real time, and the project management tap. The role of project management tap is to manage effectively the analysis work of the earthwork volume, and the role of the CCTV screen tap is to understand easily the working process, such as the entry and exit of cars. The role of the scanning modeling tap is to confirm the process state of the image analysis, and the role of the statistics chart tap is to understand the S/W ratio as the set time and date conditions. Figure 15 shows the main screen.
4.3 Applicability of the developed system
A comparative study, which is relationship between the existing soil volume conversion factor and the modified soil volume conversion factor, was performed to analyze the developed system. The goal for the filling volume was set as 5,000m3, and soil volume conversion factors of the borrow pit A-2 and A-3 were set as L values of ‘Poong A’ and ‘Poong B’
which is suggested in this study. The possible volume to obtain soils of borrow pit A-2 was set as 7,000m3, and the possible volume to obtain soils of borrow pit A-3 was set as 8,000m3. The
soil volume conversion factors of borrow pit A-5, which is the comparison object, was set as the L value on the standard of the construction estimate, and the possible volume to obtain soils of borrow pit A-5 was set as 9,000m3 (Fig. 16).
The 11 tags, which had the information such as borrow pits, loadage, and the volume of the loaded materials, were prepared to use for simulations, and they were stored in the WEMP.
Simulations were performed as moving cars for a total 13 times.
According to the analysis result, the movement of 13 cars at borrow pit A-2 and A-3 were monitored. The simulations showed that the developed method minutely reflects the earthwork situation because this method showed the actual measurement of the L values at each car but the existing method showed the constant value as shown in the upper part of Fig. 17. The remaining earthworks relevant to 61 cars in case of the developed method occurred for the goal of filling volume as shown in the lower part of Fig.17. The remaining earthworks being relevant to 75 cars in case of the existing method occurred for the goal of filling volume as shown in the lower part of Fig. 17. Our results
confirm that proposed system will be helpful to the earthwork management because it can minutely predict the earthwork volume, which fields want, as applying a developed system on weathered ground.
5. Conclusions
Many researchers have studied estimation methods for soil volume conversion factors using IT (information technology).
However, most of them calculate the soil volume conversion factor through the total volume of mixed ground with rocks and soils, so the estimation method of the soil volume conversion factor that can be applied to weathered ground has not yet been established. This study developed a measurement system for the soil volume conversion factor by estimating the soil volume conversion factor and weathering classification using electrical resistivity, which is closely related to the weathering index, the weathering degree, and so on, because electrical resistivity values are closely related to the flow of water. The method, which can obtain the soil volume conversion factor using electrical resistivity values measured at fields, is as follows.
ⓐ Measure the degree of saturation after sampling rocks in the fields.
ⓑ Measure electrical resistivity values after the samples are made as cores.
ⓒ Estimate the weathering classification of rocks using Fig. 8.
ⓓ Estimate the S/W ratio after the degree of saturation and electrical resistivity are applied to Fig. 10 according to obtained weathering classifications.
ⓔ Estimate the soil volume conversion factor after the obtained S/W ratio is applied on Table 8.
The measurement system for soil volume conversion factor was designed for field managers to easily obtain information about the earth volume and the soil volume conversion factor in weathered grounds. In addition, the structure system and stand equipment were planned considering the entry and exit of dump trucks and all equipment.
A comparative analysis between the method with the existing soil volume conversion factor and the method with the modified soil volume conversion factor, shows that the proposed system will be helpful to the scientific earthwork management because it can minutely predict the earthwork volume, which fields want, as applying the exact and segmentalized soil volume conversion factor on weathered ground.
References
1. Baynes, F. J., Dearman, W. R. and Irfan, T. Y. (1978), “Practical assessment of grade in a weathered granite”, Bulletin of the International Association of Engineering Geology, 18: 101~109.
2. Dearman, W. R., Baynes, F. J. and Irfan, T. Y. (1978), “Engineering grading of weathered granite”, Engineering Geology, 12: 345~374.
3. Fookes, P. G., Gourley, C. S. and Ohikere, C. (1988), “Rock weathering in engineering time”, Quarterly Journal of Engineering Geology, 21(1): 33~57.
4. Geological Society (1990), “Tropical residual soil, Engineering Group Working party Report”, Eng. Geol. 23(1): 1~101.
5. Gupta, A.S. and Rao, K.S. (2001), “Weathering indices and their applicability for crystalline rocks”, Bulletin of Engineering Geology and the Environment, 60: 201~221.
6. Harnois, L. (1988), “The CIW index: A new chemical index of weathering”, Sedimentary Geology, 55: 319~322.
7. Irfan, T. Y. and Dearman, W. R. (1978), “Engineering classifi- cation and index properties of a weathered granite”, Bulletin of Engineering Geology and the Environment, 17(1): 79~90.
8. Lee, S. G. and Freitas de M. H. (1989), “A revision of the description and classification of weathered granite and its application to granites in Korea”, Quarterly Journal of Engineering Geology, 22(1): 31~48.
9. Lumb, P. (1983), “Engineering properties of fresh and decomposed igneous rocks from Hong Kong”, Engineering Geology, 19(2):
81-94.
10. Ryu, H. H. (2010), Development of a tunnel electrical resistivity prospecting system and its application, Doctor thesis, KAIST, Daejeon, Korea.
11. Saunders, M. K. and Fookes, P. G. (1970), “A review of the relationship of rock weathering and climate and its significance to foundation engineering”, Engineering Geology, 4(4): 289~325.