한 국 방 재 학 회 논 문 집 제9권 3호 2009년 6월
pp. 9 ~ 17
도로교통방재
Comparison of Saturated and Unsaturated Water Flows through Pavement Systems
Lim, Yujin* · Hue Nguyen Tien**
···
Abstract
Most of the current drainage criteria have been developed on the basis of experimental field results and theoretical analyses of infiltration under saturated conditions. The objective of this study is to extend the understanding of pavement drainage systems by considering unsaturated condition in the sublayers. Analyses of unsaturated flows through pavements was performed by running finite element program(SEEP/W) with a range of pavement materials and drainage parameters. Meanwhile, the widely used DRIP program developed by FHWA is based on assumption of saturated condition of pavements. Differences between saturated and unsaturated condition in the sublayers of the pavements are verified. It is verified that for unsaturated conditions time to drain would take longer time compared to saturated condition.
Key words
: Pavement Drainage, Finite Element Analysis, Permeability, Unsaturated Flow, Soil Water Characteristic Curve, Infil- tration요 지
현재까지의 일반적인 도로하부 배수설계방법은 구성층이 완전포화 되었다는 가정하에 현장실험결과 및 이론적인 해석해를 바 탕으로 개발되었다. 본 연구에서는 포장하부구성층의 불포화상태가 포장체의 배수에 미치는 영향을 분석하였다. 상용의 유한요 소해석 프로그램인 SEEP/W를 이용하여 불포화상태에서의 포장하부구성층과 그 투수특성을 달리하여 포장하부층에서의 배수효 과를 분석하였다. 반면 현재 포장하부배수해석을 위하여 가장 널리 사용되는 미 연방도로국 개발 DRIP 프로그램은 포장하부구 성층이 완전포화 되어있다고 가정한다. 불포화와 포화가정에 따른 배수효과의 차이를 비교, 분석하였으며 불포화가정의 경우 배 수시간이 포화에 비하여 크게 오래 걸려 배수효과가 떨어짐이 확인되었다.
핵심용어 : 포장배수, 유한요소해석, 투수, 불포화흐름, 흙-물 특성곡선, 침투
···
1. Introduction
Pavement is an important component of the transportation infrastructures. The volume and weight of traffic is not the only factors that can cause damage to the pavement. Field data has shown that pavement damage can also be caused by infiltrated water. Water in the pavement system can lead to moisture damage, modulus reduction, and loss of strength.
Most of the current drainage criteria have been developed on the basis of experimental field results and theoretical analyses of infiltration under saturated conditions. Current practice is to use the so called time-to-drain method. The time required to drain a saturated base layer for a given roadway geometry must be calculated. The AASHTO clas- sification of permeable base quality is based on the time required to drain the base from 100 percent saturated condi-
tion to 50 percent saturated one. The AASHTO classifica- tion divides drainage rating system as “excellent” (time to drain less than 2 hours), “good” (time to drain less than 1 day), “fair” (time to drain less than 7 days), and so on. The FHWA computer program DRIP (Drainage Requirements In Pavements) has been developed to perform the time-to-drain analysis of the pavement(FHWA, 1996).
However, most pavements stay unsaturated most of the time and it is rare to have fully saturated conditions in pave- ments. When rain follows a dry period, the base and the subbase are usually unsaturated. The amount of water that infiltrates the base and subgrade is not only a function of permeability and the gravitational forces, it is also the func- tion of matric suction of the material. It is well known that permeability of a porous medium varies with its degree of saturation. Hence, it cannot be justified to consider only
**정회원·배재대학교건설환경공학과부교수(E-mail: yujin@pcu.ac.kr)
**배재대학교건설환경공학과석사과정
fully saturated condition of the pavement for study of pave- ment infiltration. Variation of time is another factor that should be considered in addition to unsaturated condition.
Transient flow problems are much more complex than the steady state for which classical solutions are available.
Modeling of flow through pavement with an analytical solution can be very complex because of the variability of material properties, geometries, and boundary conditions that can be selected. These complexities make it necessary to use some form of numerical method to analyze the water flow in pavement. Among the numerical methods, finite ele- ment method is a suitable and powerful approach for solv- ing this complex problem.
The objective of this study is to extend the understanding of pavement drainage systems to include unsaturated water flow. A more complete understanding of water movement in pavement systems that includes unsaturated flow will permit existing pavement systems to be evaluated and understood better, and to lead to improvements in drainage system designs and subsequent performance.
2. Research Methodology
2.1 The Analysis Methods2.1.1 Programs DRIP and SEEP/W
Drainage performance of base materials is often measured in terms of the time required to drain a certain amount of water out of the pavement. The two drainage levels that are most often used in design are the time to drain either 50 percent or 90 percent of the water out of the pavement. In this study time-to-drain calculations are performed using two methods: 1) DRIP program which is based on saturated flow theory, 2) SEEP/W which is a commercial finite ele- ment analysis program that can consider unsaturated flow theory. The well-known program DRIP(Drainage Require- ments In Pavements) developed by FHWA is based on sim- ple analytical prediction model which assumes that pavement systems are only exposed to saturated conditions.
SEEP/W can simulate both saturated and unsaturated flow in the media. The overall principles in the SEEP/W program follow Darcy’s law. The governing equation used in the SEEP/W program for all the calculations of flow is based on Richards’ equation which is easy to represent the unsat- urated flow in a more suitable form .
Using DRIP and SEEP/W programs, time-to-drain pre- dicted for simulation of flow through pavement systems were analyzed and compared. One is based on saturated condi- tion(DRIP), and the other one is based on unsaturated con- dition(SEEP/W). At first, a free drainage example is analyzed, and a real pavement drainage example is analyzed separately to investigate differences of time-to-drain due to consider- ation of unsaturation or matric suction in the sub-layers.
2.1.2 Representative Materials
All element layers included in structure of asphalt pave- ment are considered for flow analysis in the pavement.
However, the asphalt layer was considered as an impervious material. Therefore its properties were not taken into account for the material characterization in finite element modeling of flow analysis in the pavement.
Representative material properties of base, subbase and subgrade were selected from a collected database which is obtained from some test results and published research papers and reports in Korea. While there are a wide range of engineering properties of materials, only those properties that controls flow of water though pavement systems were considered in this analysis. Thus, the material properties included in the analysis are the coefficient of permeability, ksat, at saturation, the effective porosity, n, and hydraulic characteristics in saturated and unsaturated condition such as soil water characteristic curves(SWCC).
Van Genuchten(1980) proposed a model to simulate rela- tion between matric suction(ψ) and normalized volumetric water contents as shown in Eq. (1) which is a function model of SWCC. Only three parameters are required to sim- ulate this model.
(1)
where, θw = the volumetric water content
where, θs = the saturated volumetric water content where, θr = the residual volumetric water content where, ψ = the negative pore-water pressure, and where, a, n, m = curve fitting parameters
Van Genuchten (1980) proposed also the following closed form equation to describe hydraulic conductivity of a soil as a function of matric suction:
(2)
where, ks = saturated hydraulic conductivity where, n = 1/(1-m)
where, ψ = required suction range
The collected material properties used in the analyses for each sublayers of the pavement are shown in Table 1. In order to model representative SWCC of sublayers in unsat- urated condition, Van Genuchten(1980) model is adapted since the model need only 3 parameters to complete the model and is simple comparing to other complex models.
θ
wθ
rθ
s–θ
r1+
⎝ ⎠ ⎛ ⎞ ψ α
---- n m --- +=
k
wk
s[
1–( αψ
(n–1)) (
1+( αψ
n)
–m) ]
21+
αψ ( )
n( )
m2 ----
⎝ ⎠
⎜ ⎟
⎜ ⎟
⎛ ⎞
---
=
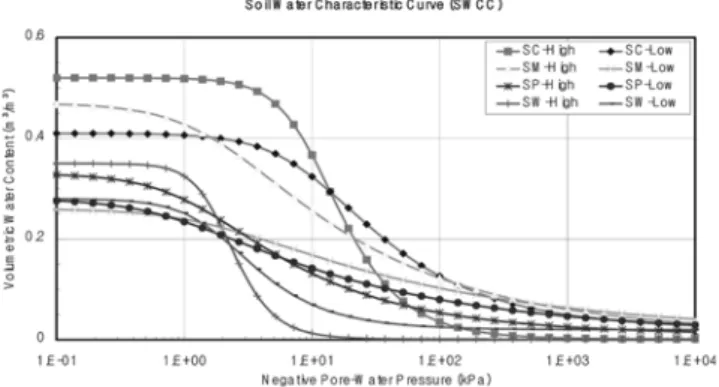
SWCCs of sublayers in unsaturated condition are col- lected from the database and analyzed to get typical models that can be used to represent upper and lower bounds of SWCCs in the sublayers as shown in Fig 1. Most subgrade soils used in the road construction are grouped into SC and SM in USCS. Most subbase soils are grouped into SP. Most base materilas are grouped into SW.
All curve fitting parameters (α, n, m) and the saturation and residual volumeteric water contents(θs, θr) required to complete Van Genuchten model in the materials used in the pavement sublayers are decided from the database as shown in Table 1. and Fig 1.
In order to simulate permeability of a sublayer in unsatur- ated condition, the Eq. (2) is adapted as a function of matric suction. Permeability variations of sublayers in unsaturated condition with matric suction are collected from the data- base and analyzed to get typical models that can be used to represent upper and lower bounds of permeability curves in the sublayers. as shown in Fig 2.
3. Verification of SEEP/W for Pavement Application
SEEP/W program is verified first for checking the capa- bility and reliability of simulating the flow of water through simplified pavement system. SEEP/W predictions are com- pared to the results obtained from an infiltration test incited in a published paper performed by Vauclin (1979).
Vauclin (1979) performed an infiltration test in the labora- tory with a layer of soil 3 m long, 2 m high and 0.05 m thick, in order to study the changes of water content and water pressure occurring in the flow in soil. The soil was packed as homogeneously as possible between two rigid walls supported by a frame resting on an impervious hori- zontal boundary. One of the vertical ends of the slab was connected to a constant head reservoir, and a water table was imposed at the depth of Ho=1.35 m. There was no flow through the vertical left hand side of the slab. A constant flux corresponding to q0=4.1111×10⁻⁵m/s was applied on the soil surface over a width of Lo=0.50 m as shown in Fig. 3.
Table 1. Material properties
No. Layer Material
(USCS) Model SWCC Parameters
k
sat (m/s)θ
rθ
sα
(kPa) n m1 Subgrade
SC High VG 4.94E-06 0.001 0.520 10.5000 2.200 0.545
Low VG 9.53E-10 0.020 0.410 10.0000 1.560 0.359
SM High VG 4.94E-07 0.010 0.470 1.8000 1.3500 0.107
Low VG 9.53E-10 0.010 0.260 1.6000 1.240 0.193
2 Subbase SP High VG 4.94E-06 0.010 0.330 1.2000 1.450 0.310
Low VG 4.94E-09 0.010 0.280 0.8000 1.280 0.219
3 Base SW High VG 4.84E-04 0.001 0.350 2.0000 3.100 0.677
Low VG 4.94E-06 0.020 0.280 1.9500 2.000 0.500
Fig 1. Soil-Water chracteristic curves(SWCC) used for analy- ses
Fig 2. Obtained coefficient of permeability curves with suction
Fig 3. Simple model for analysis of infiltration
3.1 Soil Hydraulic Parameters
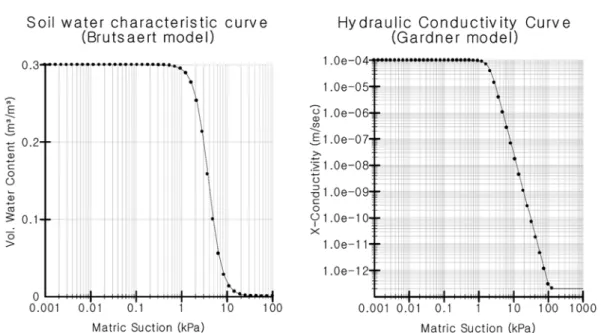
For getting hydraulic parameters of soil, Vauclin(1979) had determined suction and hydraulic conductiviy curves of the soil from the laboratory tests that can be fitted to Brut- saert(1966)'s SWCC model and Gardner(1956)'s hydraulic conductivity model. The parameters obtained from the regression analysis are shown in Table 2. Brutsaert(1966)'s SWCC model can be expressed as Eq. (3). Gardner(1956)'s hydraulic conductivity model can be expressed as Eq. (4).
(3) where α, β = empirical parameters and h = negative pore pressure (suction)
(4) where A, β = empirical curve fitting coefficients obtained by the method of least squares.
Using soil hydraulic parameters of Brutsaert (1966) and Gardner(1956)'s models obtained by Vauclin(1979), SWCC and hydraulic conductivity curve generated internally from SEEP/W are shown in Fig 4.
3.2 Finite Element Mesh
SEEP/W Finite Element Mesh used in analysis of the sim- ple infiltration experiment performed by Vauclin(1979) is
shown in Fig 5. The mesh is composed of 0.1×0.1 m quad- rilateral elements available in the library of SEEP/W pro- gram.
3.3 Comparison of Computed Results by SEEP/W to Measured Values
As shown in Fig 6., the SEEP/W simulation for the simple infiltration experiment by Vauclin(1979) showed a slightly higher water table under the section where the constant flux was applied. However, the predicted values are in good matching with the measure values mostly. In addition, the differences between the measured and predicted water table are reduced with time until the water table reached its steady state.
In addition it is proved that patterns of fluxes and contours of water content calculated by SEEP/W at given different times after start of infiltration as wn in Fig 7 are well- matched with predicted ones by Vauclin(1979) using his own numerical technique.
θ θ
sα α
+h
β ---=
k k
sA A h
+ β ---=
Table 2. Soil hydraulic parameters
Brutsaert Gardner
α β θ
s Aβ
Ks (m/s)40,000 2.9 0.30 2.99E+06 5.0 9.72E-05
Fig 4. SWCC and hydraulic conductivity curve generated from SEEP/W
Fig 5. Finite element mesh
4. Evaluation Methods of Time to Drain
4.1 Free Drainage Example4.1.1 SEEP/W Analysis of Unsaturated Flow Condition A one-dimensional finite element-based flow example was selected as shown in Fig. 8. The example problem is simu- lated by using SEEP/W under unsaturated condition. The finite element model consisted of a 1 meter tall column that had a 0.4 m by 0.4 m cross section, with 0.05×0.05 m quad- rilateral elements. The composed material of the column was fully saturated initially so that no water table was set.
Lateral sides were considered impervious (q=0 m/s per square meter). Subsequently, the bottom of the column was
subjected to atmospheric conditions, and the column was allowed to drain freely.
The evolution of the volumetric water content at the top of the soil column at selected times is shown in Fig 9.
The percent of drainage of the soil column at selected times is shown in Fig 10.
Due to the geometry of the finite element model, the max- imum suction that can be achieved is 9.8 kPa. The total height of the mesh is 1 m, therefore, if the water table reaches the bottom of the mesh, the pressure head created above the water table is equal to 1 m. This suction head cor- responds to a suction pressure of 9.8 kPa. The materials will only show significant drainage if the air entry potential is considerably less than the maximum suction sustained by the height of the soil column. Hence, the results from the finite element analyses for all 8 materials showed a negligi- ble to small change in volumetric water content, meaning that the times to drain to 50 and 90 percent were also affected greatly. For example, according to the SC-High soil water characteristic curve, at pressure of 10 kPa the soil water content (θw=0.367) is higher than θr=0.001, a pressure higher than 10 kPa is needed to have a reduction of volumet- ric water content. Because the system’s maximum developed suction is 9.8 kPa, this material never achieves 50 percent drainage, even with 90 percent drainage. This phenomenon was also observed with subgrade and subbase materials, meaning that the SC, SM, SP materials never drain fully.
Comparing SW-High soil against the others, it is possible to see that the Ksat is highest value among the soils. There- fore, the SW-High soil should be drained faster than others.
The calculated results from the numerical simulations using SEEP/W with full-unsaturated conditions show that with the similar permeability of Ksat (SC-High, SP-High, SW-Low) = 4.94E-06 m/s, the compared soils with the similar hydraulic properties all result in very different maximum percent of drainage or the times to drain. This observed phenomena is considered due to undrained condition.
Fig 6. Comparison of water table positions at different times
Fig 7. Patterns of fluxes and contours of water content calculated at given different times after start of infiltration
Fig 8. Finite element mesh and a typical seepage pattern
4.1.2 Time to Drain from Saturated Flow Theory The DRIP(Drainage Requirements In Pavement) computer program developed by FHWA can analyze and design flow problem in pavements. DRIP can calculate the time to drain in the drainage layer of a pavement system with full satura- tion condition. DRIP is developed using simple analytical prediction models such as Barber and Sawyer (1952) and Casagrande and Shannon (1952). In the Barber and Sawyer (1952) method the required time (t) to drain U % of water from the drainage layer is as follows:
(5)
where ne = the effective porosity of the drainage layer, LR
= the resultant length of the drainage layer, k = permeability of the drainage layer, H = the thickness of the drainage layer, T = time factor offered by Barber and Sawyer (1952).
In Casagrande and Shannon (1952) method, with using
the same time to drain equation as Eq. (5) time factor T is offered separately as follows:
(U>50%) (6)
(U≤50%) (7)
where, c =
DRIP program assumes that full saturation is attained through analysis because the drainage layer is saturated 100%. This means that the hydraulic conductivity is con- stant all the way through the analysis.
For each soil water characteristic curve(SWCC), the effec- tive porosity (ne) is determined from the difference between
θsat and θR. The calculations of time-to-drain obtained from
t Tn
eL
2R---
kH
=
T c
2---S
RS
R 2S
R–2US
R+1 2 2–U
( ) ( SR+1)
---
S
R2S
R+1S
R ---ln
–⋅
ln
+⋅
⎩ ⎭
⎨ ⎬
⎧ ⎫
=
T c
2--- 2US
RS
R2S
R+2U S
R ---ln
–⋅
⎩ ⎭
⎨ ⎬
⎧ ⎫
=
2.4 0.8
S
R1 3⁄ --- – Fig 9. Evolution of the volumetric water content at the topFig 10. Percent of drained water
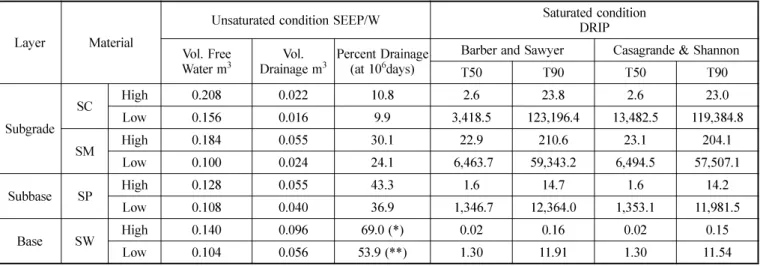
DRIP were performed by both the Barber and Sawyer method (1952) and the Casagrande and Shannon method (1952). All calculation results are compared in Table 3.
The comparison in Table 3. shows that most materials would drain under saturated conditions in all cases, while for unsaturated conditions it would not be achieved except SW materials. Although saturated flow theories adapted in DRIP consider the material characterization and geometry of the system, it does not take into account the variation of the hydraulic conductivity with volumetric water content or suc- tion that represents the true behavior of the material under field conditions. Therefore, considering only permeability at saturation (ksat) and using that throughout the flow analysis in order to characterize the drainage of materials is to make the time to drain be obviously significantly shorter (6-7 times) than those of the more realistic unsaturated condi- tions. In the drainage layer of unsaturated condition, the hydraulic conductivity is a function of the suction experi- enced in the material.
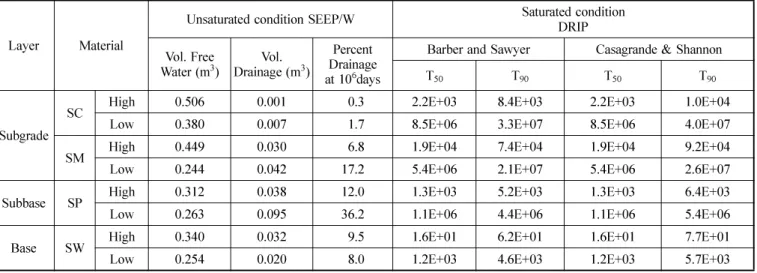
4.2 Real Pavement Drainage Example
4.2.1 Time to Drain in Case of Unsaturated Condition Geometry attributed to a drainage base layer used to gen- erate a FE mesh is 0.5 m tall and 6.5 m long, with a slope of 2% as shown in Fig 11. The FE mesh is composed of quadrilateral elements. The layer was set up so that the material was fully saturated initially, the right side was sub- jected to atmospheric conditions, and the layer was allowed to drain freely. The layer was considered impervious on left and bottom sides. Fig 12 is a typical seepage pattern per- formed by SEEP/W using the mesh and geometry and boundary condition given in Fig. 11.
Due to the geometry of the layer under unsaturated condi- tions, the maximum suction pressure that can be obtained is approximately 1.5 kPa. When the water table reaches the layer bottom, the maximum pressure head developed is 0.15 m. This is equivalent to 1.5 kPa of suction. Therefore, only a small reduction in the volumetric water content will occur according to the characterization of the all layer mate- Table 3. Comparison of drainage time under saturated vs. unsaturated flow conditions
Layer Material
Unsaturated condition SEEP/W Saturated condition DRIP Vol. Free
Water m3 Vol.
Drainage m3 Percent Drainage
(at 106days) Barber and Sawyer Casagrande & Shannon
T50 T90 T50 T90
Subgrade
SC High 0.208 0.022 10.8 2.6 23.8 2.6 23.0
Low 0.156 0.016 9.9 3,418.5 123,196.4 13,482.5 119,384.8
SM High 0.184 0.055 30.1 22.9 210.6 23.1 204.1
Low 0.100 0.024 24.1 6,463.7 59,343.2 6,494.5 57,507.1
Subbase SP High 0.128 0.055 43.3 1.6 14.7 1.6 14.2
Low 0.108 0.040 36.9 1,346.7 12,364.0 1,353.1 11,981.5
Base SW High 0.140 0.096 69.0 (*) 0.02 0.16 0.02 0.15
Low 0.104 0.056 53.9 (**) 1.30 11.91 1.30 11.54
Note: *T50 = 0.12 days (2.88 hrs), **T50 = 8.90 days
Fig 11. Geometry and boundary conditions real pavement drainage example
Fig 12. Seepage pattern after t=1 day for SC-High material
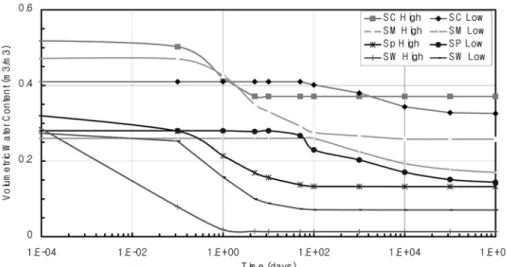
rials. Fig. 13 shows the percent of volume of water drained out obtained from SEEP/W program using the conditions given in Fig. 11. As described in flow analysis of simple flow problem and anticipated, there are large differences in soils for percent of volume of water drained out. Even SP- High soil which produced the largest percent of volume of water drained out among the soils compared in the analysis could be drained approximately only 28 percent at 100 days after drainage started.
4.2.2 Time to Drain in Case of Saturated Condition Using the geometry condition given in Fig. 11 of real flow example of the drainage layer, time to drain in case of full saturated condition was calculated using DRIP program.
The height (H) of the model is 0.15 m. The width of the drainage path (W) is 6.5 m. The resultant length of the drainage path (LR) is 6.5 m.
The calculations of time-to-drain obtained from DRIP were performed by both the Barber and Sawyer method (1952) and the Casagrande and Shannon method (1952). All calculation results are compared in Table 4.
The comparison in Table 4. shows that most materials would drain under saturated conditions in all cases, while for unsaturated conditions it would not be achieved in most
soils. Subbase material with SP-Low hydraulic conductivity could be drained out only 36.2 percent of the volume of water at 1,000,000 days after drainage started which is the best drainage material among the compared soils.
Although saturated flow theories adapted in DRIP con- sider the material characterization and geometry of the sys- tem, it does not take into account the variation of the hydraulic conductivity with volumetric water content or suc- tion that represents the true behavior of the material under field conditions. Therefore, considering only permeability at saturation (ksat) and using that throughout the flow analysis in order to characterize the drainage of materials is to make the time to drain be obviously significantly shorter (6-7 times) than those of the more realistic unsaturated condi- tions. In the drainage layer of unsaturated condition, the hydraulic conductivity is a function of the suction experi- enced in the material.
5. Conclusions
Although saturated flow theories adapted in DRIP con- sider the material characterization and geometry of the sys- tem, it does not take into account the variation of the hydraulic conductivity with volumetric water content or suc- tion that represents the true behavior of the material under field conditions. Therefore, considering only permeability at saturation (ksat) and using that throughout the flow analysis in order to characterize the drainage of materials is to make the time to drain be obviously significantly shorter (6-7 times) than those of the more realistic unsaturated condi- tions. In the drainage layer of unsaturated condition, the hydraulic conductivity is a function of the suction experi- enced in the material.
Comparisons between the results obtained by DRIP with saturated conditions and SEEP/W with unsaturated condi- tions show that most materials would drain under saturated Fig 13. Percent of volume of water drained out
Table 4. Comparison of drainage times under saturated vs unsaturated flow conditions
Layer Material
Unsaturated condition SEEP/W Saturated condition DRIP Vol. Free
Water (m3) Vol.
Drainage (m3) Percent Drainage at 106days
Barber and Sawyer Casagrande & Shannon
T50 T90 T50 T90
Subgrade SC High 0.506 0.001 00.3 2.2E+03 8.4E+03 2.2E+03 1.0E+04
Low 0.380 0.007 01.7 8.5E+06 3.3E+07 8.5E+06 4.0E+07
SM High 0.449 0.030 06.8 1.9E+04 7.4E+04 1.9E+04 9.2E+04
Low 0.244 0.042 17.2 5.4E+06 2.1E+07 5.4E+06 2.6E+07
Subbase SP High 0.312 0.038 12.0 1.3E+03 5.2E+03 1.3E+03 6.4E+03
Low 0.263 0.095 36.2 1.1E+06 4.4E+06 1.1E+06 5.4E+06
Base SW High 0.340 0.032 09.5 1.6E+01 6.2E+01 1.6E+01 7.7E+01
Low 0.254 0.020 08.0 1.2E+03 4.6E+03 1.2E+03 5.7E+03
conditions, while for unsaturated conditions it would take longer time or not be achieved.
Acknowledgements
This research was supported by a grant(code 07- Technol- ogy Innovation -A01) from Construction Technology Inno- vation Program (CTIP) funded by Ministry of Land, Transport and Maritime Affairs.
References
American Association of State Highway and Transportation Offi- cials (1998)
AASHTO Guide for Design of Pavement Struc- tures.
Washington, D.C..Ariza, P. and Birgisson, B. (2002)
Evaluation of Water Flow through Pavement Systems Report MN-RC-2002-30.
Minnesota Depart- ment of Transportation.Barber, E.S. and Sawyer, C.L. (1952) Highway Subdrainage,
Pro-
ceedings Highway Research Board
, pp. 643-666.Casagrande, A. and Shannon W.L. (1952) Base Course Drainage for Airport Pavements,
Proc. ASCE
, Vol. 77, pp. 792-814.Federal Highway Administration (1996)
DRIP (Drainage Require- ments in Pavements) Version 1.00.
Federal Highway Adminis- tration, Washington, D.C..GEO-SLOPE (2001)
SEEP/W Version 4.24.
GEO-SLOPE Interna- tional Ltd., Calgary.Tindall, J.A. and Kunkel, J.R. (1999)
Unsaturated Zone Hydrology for Scientists and Engineers.
Prentice Hall, New Jersey.Van Genuchten, M. T. (1980) A closed-form equation for predicting the hydraulic conductivity of unsaturated soils.
Proc. Soil Sci.
Soc. Amer.
, Vol. 44, pp. 892-898.Vauclin, M., Khanji, D, Vachaud, G. (1979) Experiment and Numer- ical Study of a Tansient, Two-Dimensional Unsaturated-Satu- rated Water Table Recharge Problem.