INTRODUCTION
Happiness is a positive inner feeling originating from individuals’
cognitive and emotional interpretation of their lives [1]. Previous studies have indicated that health, financial condition, family, and community factors were associated with happiness among the elderly [2,3]. Good family relationships, economic stability, and good health strongly impact happiness among Korean elders. Further studies of the factors affecting their happiness are required [4].
Changes in family relationships, the social structure, economic structure, and culture of South Korean society have led to the increased social isolation of the elderly. Changing trends of issues of the elderly have led to social polity intervention [5]. There have been tremendous efforts to address the health care needs of the super-aging
society of Korea. Along with the physical care and welfare program, the satisfaction and happiness of the elderly population are very important to ensure that they have meaningful lives.
Happiness among the elderly might be influenced by many personal and social factors. Education, income, residence, subjective health, quality of life, required medical services, and social support were some factors influencing happiness among elders, as indicated by previous studies [2,4,6,7]. Studies have recommended that interventions that increase social capital and participation may augment general happiness, health, and recovery from illness, and this would be an interesting area for future research. The study reports that good financial conditions were highly associated with successful aging in China and Korea [8]. It also recommends that the advancement of public health systems could better control the progression of
Factors Associated with Happiness among Senior Citizens of Rural Korea:
Evidence from the 2017 National Survey of Older Koreans
Bimala Sharma1, Geurum Song2, Eun Woo Nam2,3
1Community Medicine Department, Gandaki Medical College, Pokhara, Kaski, Nepal; 2Yonsei Global Health Center, Yonsei University; 3Department of Health Administration, College of Health Sciences, Yonsei University, Wonju, Korea
Background: Happiness is one of the most important indicators of health, wellbeing, and quality of life among older adults. The objective of the study was to investigate factors associated with happiness among senior citizens residing in rural areas using the 2017 National Survey of Older Koreans.
Methods: A cross-sectional analytical study was conducted among 3,149 senior citizens living in rural areas using secondary data from the 2017 National Survey of Older Koreans. Happiness was measured by a single question and responses were recorded dichotomously. Descriptive and inferential statistics were computed at a 5% level of significance.
Results: In all, 64.5% of the participants considered themselves as happy most of the time in the last 1 week. In the study, socio-demographic factors did not predict happiness except age. Satisfaction with a health status, financial situation, relationship with children, cultural satisfaction, and satisfaction with friends and society were positively associated with happiness among senior citizens residing in rural areas of Korea. Odds of reporting happiness were higher among those who traveled in the last 1 year, visited elderly welfare centers, and were involved in voluntary work than among those who did not.
Conclusion: Happiness among senior citizen was significantly associated with life satisfaction with regard to health, finance, relationship with family, friends and society, and social activity participation.
Keywords: Happiness; Factors; Social activity participation; Senior citizen; Korea
Correspondence to: Eun Woo Nam
Department of Health Administration, College of Health Sciences, Yonsei University, Unit 412, Chancho-gwan, 1 Yeonsedae-gil, Wonju 26493, Korea
Tel: +82-33-760-2413, Fax: +82-33-762-9562, E-mail: [email protected]
Received: December 31, 2019, Revised: January 30, 2020, Accepted after revision: April 17, 2020
© Korean Academy of Health Policy and Management
◯㏄ This is an open-access article distributed under the terms of the Creative Commons Attribution Non-Commercial License (http://creativecommons.org/licenses/by-nc/4.0) which permits unrestricted non-commercial use,
distribution, and reproduction in any medium, provided the original work is properly cited.
non-communicable diseases among old people and thus promote successful aging [8]. A study of the Korean elderly confirmed that important factors of successful aging were healthy lifestyles, social circumstances, and social support and networking despite the presence of physical diseases and physiological conditions [9]. In addition, a study of the Korean elderly showed that community-dwelling elderly people have higher odds of depression [10]. It was also found that there was a difference in happiness perception by the regions: the proportion of poor happiness perception was almost 3 times higher in the rural areas than among residents of the urban areas [11]. Therefore, this study aimed to investigate factors associated with happiness among senior citizens residing in rural areas using the 2017 National Survey of Older Koreans.
METHODS
1. Study design, study area, and study population
A cross-sectional analytical study was conducted using secondary data from the 2017 National Survey of Older Koreans. The 2017 National Survey of Older Koreans was conducted to compile important data and information necessary to devise policy measures to improve seniors’ quality of life and better cope with population aging in the future [12]. The 2017 National Survey of Older Koreans included all seniors aged 65 years or older living in standard residential facilities or premises in 17 metropolitan cities and provinces across Korea. The survey was conducted from June 12 to August 28, 2017 [12]. The sampling framework included lists of apartment areas and non-apartment areas in a total of 934 survey areas. In the survey, samples from two types of residences: “동부(dong-bu)” and “읍면부 (eup, meon, bu)” were drawn. However, we included the sample from 읍면부(eup, meon, bu) only to limit the study for the rural areas. Thus, the total sample size from 읍면부(eup, meon, bu), the rural area was 3,232. Among them, 83 participants were excluded from the analysis due to missing data. A final sample of 3,149 was analyzed in this study [12].
2. Information collection
In-person interview methods were applied among seniors aged 65 or older (including 226 representatives) from June 12 to August 28, 2017. The survey was conducted by 60 trained surveyors (divided into 15 teams of four surveyors each, each team with one supervisor) [12].
Surveyors checked the answered questionnaires for any omissions and errors and relayed their feedback to the research team. The answered questionnaires, once checked, were digitalized over 20 days by an external agency. The digitalized data were then verified and checked over 2 months for input errors, incorrect IDs, incorrect categories, logic errors, and arithmetic errors [12].
3. Measurement of the variables 1) Dependent variable
(1) Feeling happy
Feeling happy or happiness was measured by a single question and responses were recorded dichotomously [12]. “Did you feel happy most of the time over the past week?” “Yes” was coded 1 and “no” as 0 as it was measured in the tool of the survey. In the previous study also, happiness was coded and analyzed as a binary variable in which positive responses were assigned value 1 and the other responses were assigned value 0 [13].
2) Independent variables (1) Socio-demographic variables
Details on participants’ sex, age, marital status, and employment status were collected as socio-demographic variables. Most of the independent variables were grouped as they were done in the survey questionnaire [12].
(2) Number of chronic diseases present
The questions concerned chronic diseases that participants had been suffering from for more than 3 months. Participants were asked to answer the respective items related to chronic diseases. “Have you been suffering from a chronic disease for more than 3 months since a doctor’s diagnosis?” was asked for 32 respective items related to chronic diseases, including one option for all questions. To calculate the prevalence of the multiple diseases, all items were summed up and
categorized as “no disease” (none of them), “one disease” (only one),
“two diseases”, and “more than two”.
(3) Self-rated health
“What do you think of your health status?” The response categories were: (1) very healthy, (2) healthy, (3) average, (4) in ill health, and (5) in very ill health. These were categorized into three groups for analysis:
healthy, average, and unhealthy.
(4) Life satisfaction
“To what extent are you satisfied with the following parts of your life?” This question was asked regarding health status, economic status, relationship with the spouse, relationship with the child, social leisure and cultural activities, and relationship with friends and society. The options provided in the survey questionnaire to answer were (1) very satisfied, (2) satisfied, (3) average, (4) not satisfied, and (5) not satisfied at all [12]. In the study, very satisfied and satisfied were grouped into “satisfied”, and not satisfied and not satisfied at all into
“not satisfied”.
(5) Variables related to social activity participation
Participation in voluntary activities, traveling outside their accustomed places, utilization of senior citizen centers, and utilization of elderly welfare centers were the variables related to social activity participation. These variables were selected from the 2017 National Survey of Older Koreans [12]. The following questions were asked:
“have you traveled over the past 1 year?”; “have you visited the senior citizen center over the past 1 year?”; “have you visited the community center for the elderly over the past 1 year?”; and “have you experienced volunteering activities?” Hours of television viewing were also asked.
4. Data analysis
IBM SPSS ver. 25.0 (IBM Corp., Armonk, NY, USA) was used.
Descriptive statistics were used to summarize the characteristics of the study participants, with the level of significance set at 5% for all analyses. Chi-square tests were conducted to check the association between dependent and each of independent variables. Multiple logistic regression analysis was applied to determine the effect size of explanatory variables on happiness level, and adjusted odds ratios and
respective 95% confidence intervals were computed. Three models of logistic regression were made: model 1 comprising socio- demographic characteristics; model 2 comprising model 1 and life satisfaction variables; and model 3 including socio-demographic characteristics, life satisfaction, and variables of social activity participation adjusted by the number of chronic disease present. The three models were prepared to see the influence of socio-demographic factors only, socio-demographic and life satisfaction related variables, and of all: socio-demographic variables, life satisfaction variables, and social activity participation variables on happiness separately. The Nagelkerke’s R2 value of each model shows the degree of attribution of the factors of each model on happiness.
5. Ethical consideration
Data were collected by the Korea Institute for Health and Social Affairs as part of the 2017 National Survey of Older Koreans.
Therefore, independent ethical clearance was not required.
RESULTS
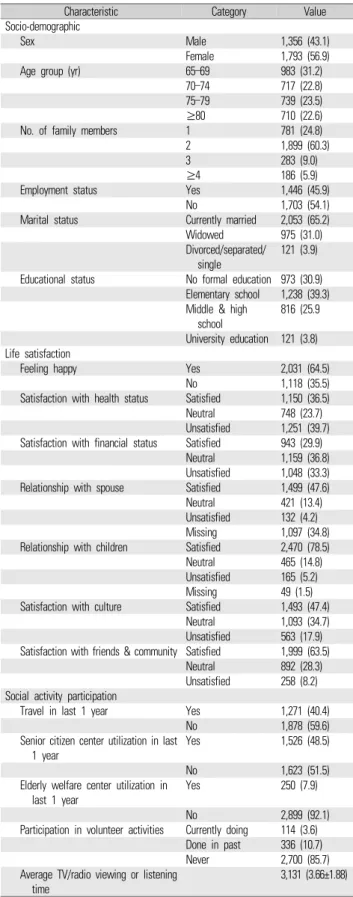
Table 1 shows socio-demographic characteristics, life satisfaction, and participation in the social activity of the study population. Of the total, 43.1% of the study sample was male. Regarding age, 31.2% were in the age group of 65 to 69 years and 22.6% were 80 years or above. Of the total population, 45.9% of the participants were employed.
Regarding marital status, 65.2% were currently married, 31.0%
widowed, and 3.9% were separated, divorced, or never married. Of the total, 30.9% of the participants did not have formal education.
Of the total, 64.5% of the participants reported that they felt happy most of the time over the last 1 week. Of the total, 39.7% were not satisfied with their health condition and 33.3% were not satisfied with their financial condition. Similarly, 4.2% were not satisfied with their relationship with their spouse; 5.2% were unsatisfied with their relationship with their children; 17.9% unsatisfied with culture; and 8.2% unsatisfied with their friends and community. Of the total, 40.4%
had traveled outside their accustomed places in the last year, 48.5%
had visited senior citizen centers, and 7.9% had visited elderly welfare centers. Among the elderly, 3.6% were currently involved in volunteer
activities. Average TV/radio viewing or listening time was 3.66 hours among the respondents (Table 1).
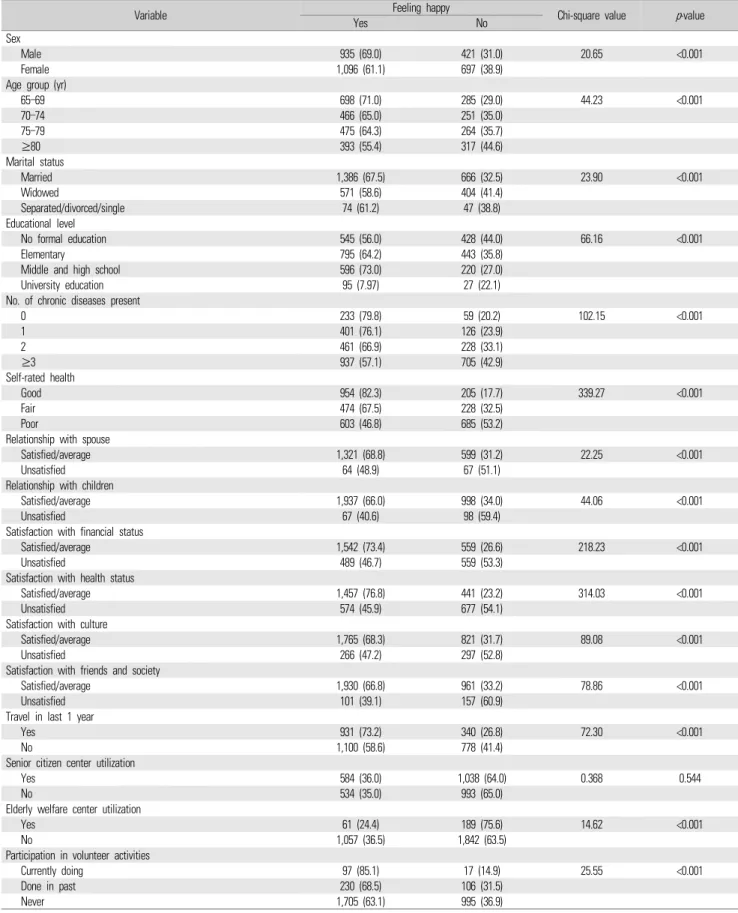
Table 2 shows the association between feeling happy and explanatory variables. Among socio-demographic variables, gender, age group, marital status, and educational level were significantly associated with feeling happy. Regarding the health condition, the number of chronic diseases present and self-rated health were significantly associated with feeling happy.
Relationships with spouse and children were both significantly correlated with feeling happy among senior citizens, as were financial satisfaction, satisfaction with culture, and satisfaction with friends and community. Volunteer activity experience and elderly welfare center use were also significantly associated with feeling happy. However, there was no association between senior citizen center utilization and feeling happy.
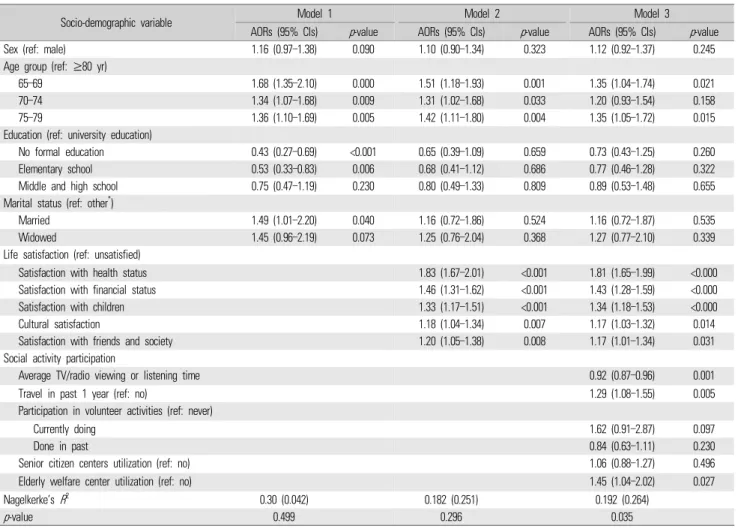
In the logistic regression analysis, model 1 comprised socio-demographic variables, and in this model sex, age, education, and marital status were significant. Model 2 comprised socio-demographic variables and life satisfaction variables. In this model, all variables of life satisfaction and, of the socio-demographic variables, age group were statistically significantly associated with feeling happy. Model 3 comprised socio-demographic variables, life satisfaction variables, and social activity participation variables, as a result of which age of socio-demographic variables, all life satisfaction variables, and all variables related to social activity participation except senior citizen center utilization were significantly associated with feeling happy. In the analysis, 3% of the happiness is predicted by model 1, 18% by model 2, and 19% by model 3 (Table 3).
DISCUSSION
The study revealed that the age group, life satisfaction, and social activity participation were associated with happiness in senior citizens in rural areas of Korea. More than three-fifths of participants expressed themselves as happy most of the time in the last 1 week. A study among Thai elderly reported that 49.7% perceived their happiness as poor [11].
Feelings of happiness did not differ by sex in the study, but they
Characteristic Category Value
Socio-demographic
Sex Male 1,356 (43.1)
Female 1,793 (56.9)
Age group (yr) 65–69 983 (31.2)
70–74 717 (22.8)
75–79 739 (23.5)
≥80 710 (22.6)
No. of family members 1 781 (24.8)
2 1,899 (60.3)
3 283 (9.0)
≥4 186 (5.9)
Employment status Yes 1,446 (45.9)
No 1,703 (54.1)
Marital status Currently married 2,053 (65.2)
Widowed 975 (31.0)
Divorced/separated/
single
121 (3.9) Educational status No formal education 973 (30.9)
Elementary school 1,238 (39.3) Middle & high
school
816 (25.9 University education 121 (3.8) Life satisfaction
Feeling happy Yes 2,031 (64.5)
No 1,118 (35.5)
Satisfaction with health status Satisfied 1,150 (36.5)
Neutral 748 (23.7)
Unsatisfied 1,251 (39.7) Satisfaction with financial status Satisfied 943 (29.9)
Neutral 1,159 (36.8)
Unsatisfied 1,048 (33.3)
Relationship with spouse Satisfied 1,499 (47.6)
Neutral 421 (13.4)
Unsatisfied 132 (4.2)
Missing 1,097 (34.8)
Relationship with children Satisfied 2,470 (78.5)
Neutral 465 (14.8)
Unsatisfied 165 (5.2)
Missing 49 (1.5)
Satisfaction with culture Satisfied 1,493 (47.4)
Neutral 1,093 (34.7)
Unsatisfied 563 (17.9) Satisfaction with friends & community Satisfied 1,999 (63.5)
Neutral 892 (28.3)
Unsatisfied 258 (8.2) Social activity participation
Travel in last 1 year Yes 1,271 (40.4)
No 1,878 (59.6)
Senior citizen center utilization in last 1 year
Yes 1,526 (48.5)
No 1,623 (51.5)
Elderly welfare center utilization in last 1 year
Yes 250 (7.9)
No 2,899 (92.1)
Participation in volunteer activities Currently doing 114 (3.6) Done in past 336 (10.7)
Never 2,700 (85.7)
Average TV/radio viewing or listening time
3,131 (3.66±1.88) Values are presented as number (%) or number (mean±standard deviation).
Table 1. Socio-demographic characteristics, life satisfaction and social activity participation of the study population (n=3,149)
Variable Feeling happy
Chi-square value p-value
Yes No
Sex
Male 935 (69.0) 421 (31.0) 20.65 <0.001
Female 1,096 (61.1) 697 (38.9)
Age group (yr)
65–69 698 (71.0) 285 (29.0) 44.23 <0.001
70–74 466 (65.0) 251 (35.0)
75–79 475 (64.3) 264 (35.7)
≥80 393 (55.4) 317 (44.6)
Marital status
Married 1,386 (67.5) 666 (32.5) 23.90 <0.001
Widowed 571 (58.6) 404 (41.4)
Separated/divorced/single 74 (61.2) 47 (38.8)
Educational level
No formal education 545 (56.0) 428 (44.0) 66.16 <0.001
Elementary 795 (64.2) 443 (35.8)
Middle and high school 596 (73.0) 220 (27.0)
University education 95 (7.97) 27 (22.1)
No. of chronic diseases present
0 233 (79.8) 59 (20.2) 102.15 <0.001
1 401 (76.1) 126 (23.9)
2 461 (66.9) 228 (33.1)
≥3 937 (57.1) 705 (42.9)
Self-rated health
Good 954 (82.3) 205 (17.7) 339.27 <0.001
Fair 474 (67.5) 228 (32.5)
Poor 603 (46.8) 685 (53.2)
Relationship with spouse
Satisfied/average 1,321 (68.8) 599 (31.2) 22.25 <0.001
Unsatisfied 64 (48.9) 67 (51.1)
Relationship with children
Satisfied/average 1,937 (66.0) 998 (34.0) 44.06 <0.001
Unsatisfied 67 (40.6) 98 (59.4)
Satisfaction with financial status
Satisfied/average 1,542 (73.4) 559 (26.6) 218.23 <0.001
Unsatisfied 489 (46.7) 559 (53.3)
Satisfaction with health status
Satisfied/average 1,457 (76.8) 441 (23.2) 314.03 <0.001
Unsatisfied 574 (45.9) 677 (54.1)
Satisfaction with culture
Satisfied/average 1,765 (68.3) 821 (31.7) 89.08 <0.001
Unsatisfied 266 (47.2) 297 (52.8)
Satisfaction with friends and society
Satisfied/average 1,930 (66.8) 961 (33.2) 78.86 <0.001
Unsatisfied 101 (39.1) 157 (60.9)
Travel in last 1 year
Yes 931 (73.2) 340 (26.8) 72.30 <0.001
No 1,100 (58.6) 778 (41.4)
Senior citizen center utilization
Yes 584 (36.0) 1,038 (64.0) 0.368 0.544
No 534 (35.0) 993 (65.0)
Elderly welfare center utilization
Yes 61 (24.4) 189 (75.6) 14.62 <0.001
No 1,057 (36.5) 1,842 (63.5)
Participation in volunteer activities
Currently doing 97 (85.1) 17 (14.9) 25.55 <0.001
Done in past 230 (68.5) 106 (31.5)
Never 1,705 (63.1) 995 (36.9)
Values are presented as number (%).
Table 2. Association between feeling happy and explanatory variables
significantly differed in the different age groups. Similar to this study, age was significantly associated with being happiness [14]. However, there was a difference in poor happiness perception between males and females in a previous study [11]. Education and marital status were not associated with feeling happy among the elderly population in the adjusted models. In contrast to this study, formal education was found to influence happiness [11], which might be due to the different socio-cultural aspects of the study area.
Six aspects of life satisfaction were measured in the study. However, satisfaction with the spouse was not included in the adjusted logistic regression models owing to missing data. All the other five aspects of life satisfaction strongly influenced the feeling of happiness in the study population. There was a positive association of satisfaction with a health condition, financial condition, relationship with children, satisfaction with culture, and satisfaction with friends and society with
happiness in this study. This finding is compatible with a previous study conducted with community-dwelling elderly in Korea that the most important factors determining the happiness of the community-dwelling elderly in Korea were good family relationships, economic stability, and good health [4]. A previous study conducted in Brazil among retirees also found that the most important predictors of happiness were health, social support, and economic situation [2].
Interventions that increase social capital and participation may generate happiness, health, and recovery from illness among elderly people [3]. A study among American older people showed that those with greater social capital tended to exhibit better well-being and greater happiness [15]. A study confirmed that important factors of successful aging are a healthy life study, social circumstances, social support, and networking, despite the presence of physical diseases and poor physiological condition [9]. Those living alone reported higher
Socio-demographic variable Model 1 Model 2 Model 3
AORs (95% CIs) p-value AORs (95% CIs) p-value AORs (95% CIs) p-value
Sex (ref: male) 1.16 (0.97–1.38) 0.090 1.10 (0.90–1.34) 0.323 1.12 (0.92–1.37) 0.245
Age group (ref: ≥80 yr)
65–69 1.68 (1.35–2.10) 0.000 1.51 (1.18–1.93) 0.001 1.35 (1.04–1.74) 0.021
70–74 1.34 (1.07–1.68) 0.009 1.31 (1.02–1.68) 0.033 1.20 (0.93–1.54) 0.158
75–79 1.36 (1.10–1.69) 0.005 1.42 (1.11–1.80) 0.004 1.35 (1.05–1.72) 0.015
Education (ref: university education)
No formal education 0.43 (0.27–0.69) <0.001 0.65 (0.39–1.09) 0.659 0.73 (0.43–1.25) 0.260
Elementary school 0.53 (0.33–0.83) 0.006 0.68 (0.41–1.12) 0.686 0.77 (0.46–1.28) 0.322
Middle and high school 0.75 (0.47–1.19) 0.230 0.80 (0.49–1.33) 0.809 0.89 (0.53–1.48) 0.655
Marital status (ref: other*)
Married 1.49 (1.01–2.20) 0.040 1.16 (0.72–1.86) 0.524 1.16 (0.72–1.87) 0.535
Widowed 1.45 (0.96–2.19) 0.073 1.25 (0.76–2.04) 0.368 1.27 (0.77–2.10) 0.339
Life satisfaction (ref: unsatisfied)
Satisfaction with health status 1.83 (1.67–2.01) <0.001 1.81 (1.65–1.99) <0.000
Satisfaction with financial status 1.46 (1.31–1.62) <0.001 1.43 (1.28–1.59) <0.000
Satisfaction with children 1.33 (1.17–1.51) <0.001 1.34 (1.18–1.53) <0.000
Cultural satisfaction 1.18 (1.04–1.34) 0.007 1.17 (1.03–1.32) 0.014
Satisfaction with friends and society 1.20 (1.05–1.38) 0.008 1.17 (1.01–1.34) 0.031
Social activity participation
Average TV/radio viewing or listening time 0.92 (0.87–0.96) 0.001
Travel in past 1 year (ref: no) 1.29 (1.08–1.55) 0.005
Participation in volunteer activities (ref: never)
Currently doing 1.62 (0.91–2.87) 0.097
Done in past 0.84 (0.63–1.11) 0.230
Senior citizen centers utilization (ref: no) 1.06 (0.88–1.27) 0.496
Elderly welfare center utilization (ref: no) 1.45 (1.04–2.02) 0.027
Nagelkerke’s R2 0.30 (0.042) 0.182 (0.251) 0.192 (0.264)
p-value 0.499 0.296 0.035
AOR, adjusted odds ratio; CI, confidence interval; ref, reference.
Table 3. Factors associated with feeling happy among senior citizens residing in rural areas of Korea
levels of depressive symptoms than those living with others, and physical inactivity and social inactivity were associated with more depressive symptoms [16].
This study revealed a negative association between the hours of television viewing and feeling happiness. With increases in viewing time, respondents were less likely to report feeling happy. Regarding travel, those who were traveled were more likely to express themselves as happy most of the time in the last 1 week. Older adults who volunteer and who engage in more hours of volunteering report higher levels of well-being [17]. It also reveals associations between their social participation and functional ability. Those who were currently involved in volunteer activities were also more likely to feel happy than those who never had done so. A previous study also concluded that elderly people who are alone and dependent on fulfilling their activities of daily living should be observed [18].
1. Limitations of the study
The study has some limitations to be considered. First, a single dichotomous leading question was asked to measure happiness, which might have led to an overestimation of the happiness level among the participants. The use of a composite scale and Likert-types scale might be more appropriate to measure the happiness level [19,20]. Second, as the study was cross-sectional in nature, it cannot prove the causality of the factors associated with happiness. Third, as the study was conducted as part of the general survey among elderly people, we could not focus on all dimensions of happiness.
2. Conclusion
More than three-fifths of participants expressed themselves as happy most of the time during the last 1 week. Sex, marital status, and educational level did not affect happiness, while satisfaction with health, financial situation, culture, friends and society, and relationship with children were factors significantly associated with happiness among senior citizens residing in rural areas of Korea. Odds of reporting feeling happy were higher among those who had traveled in the last 1 year, used elderly welfare centers, and were involved in voluntary work than among those who did not. More hours of television viewing were associated with lower odds of reporting feeling happy. Conclusively, feeling happy was associated with life satisfaction
in terms of health, finance, culture, friends and society, and social activity participation among senior citizens residing in rural areas of Korea.
CONFLICT OF INTEREST
No potential conflict of interest relevant to this article was reported.
ORCID
Bimala Sharma: https://doi.org/0000-0002-1521-4197;
Geurum Song: https://doi.org/0000-0001-9565-7918;
Eun Woo Nam: https://doi.org/0000-0001-6584-0658
REFERENCES
1. Diener E, Oishi S, Lucas RE. Personality, culture, and subjective well-being: emotional and cognitive evaluations of life. Annu Rev Psychol 2003;54:403-425. DOI: https://doi.org/10.1146/annurev.
psych.54.101601.145056.
2. Amorim SM, Franca LH, Valentini F. Predictors of happiness among retired from urban and rural areas in Brazil. Psicol Reflex Crit 2017;30(1):2. DOI: https://doi.org/10.1186/s41155-016-0055-3.
3. Cooper C, Bebbington P, King M, Jenkins R, Farrell M, Brugha T, et al. Happiness across age groups: results from the 2007 National Psychiatric Morbidity Survey. Int J Geriatr Psychiatry 2011;26(6):
608-614. DOI: https://doi.org/10.1002/gps.2570.
4. Jeon SW, Han C, Lee J, Lim J, Jeong HG, Park MH, et al. Perspectives on the happiness of community-dwelling elderly in Korea. Psychiatry Investig 2016;13(1):50-57. DOI: https://doi.org/10.4306/pi.2016.13.
1.50.
5. Yi ES, Hwang HJ. A study on the social behavior and social isolation of the elderly Korea. J Exerc Rehabil 2015;11(3):125-132. DOI:
https://doi.org/10.12965/jer.150215.
6. Kim KS. Factors influencing the happiness according to the gender of the elderly living alone: using data from 2015 Community Health Survey. J East West Nurs Res 2017;23(2):97-106. DOI: https://do-
i.org/10.14370/jewnr.2017.23.2.97.
7. Moeini B, Barati M, Farhadian M, Ara MH. The association between social support and happiness among elderly in Iran. Korean J Fam Med 2018;39(4):260-265. DOI: https://doi.org/10.4082/kjfm.17.
0121.
8. Feng Q, Son J, Zeng Y. Prevalence and correlates of successful ageing:
a comparative study between China and South Korea. Eur J Ageing 2014;12(2):83-94. DOI: https://doi.org/10.1007/s10433-014-0329-5.
9. Choe E. Understanding healthy ageing in the Korean rural and urban elderly: an application of Rowe and Kahn’s model of successful ageing [dissertation]. Mount Gravatt (QLD): Griffith University; 2014.
10. Chung S. Residential status and depression among Korean elderly people: a comparison between residents of nursing home and those based in the community. Health Soc Care Community 2008;
16(4):370-377. DOI: https://doi.org/10.1111/j.1365-2524.2007.00747.x.
11. Sumngern C, Azeredo Z, Subgranon R, Sungvorawongphana N, Matos E. Happiness among the elderly in communities: a study in senior clubs of Chonburi province, Thailand. Jpn J Nurs Sci 2010;
7(1):47-54. DOI: https://doi.org/10.1111/j.1742-7924.2010.00139.x.
12. Chung K. 2017 National Survey of Older Koreans: findings and implications. Sejong: Korea Institute for Health and Social Affairs;
2018.
13. Lee MA, Kawachi I. The keys to happiness: associations between personal values regarding core life domains and happiness in South Korea. PLoS One 2019;14(1):e0209821. DOI: https://doi.org/10.
1371/journal.pone.0209821.
14. Luchesi BM, de Oliveira NA, de Morais D, de Paula Pessoa RM,
Pavarini SCI, Chagas MH. Factors associated with happiness in the elderly persons living in the community. Arch Gerontol Geriatr 2018;74:83-87. DOI: https://doi.org/10.1016/j.archger.2017.10.006.
15. Litwin H, Shiovitz-Ezra S. Social network type and subjective well-being in a national sample of older Americans. Gerontologist 2011;51(3):379-388. DOI: https://doi.org/10.1093/geront/gnq094.
16. Kim H, Kwon S, Hong S, Lee S. Health behaviors influencing de- pressive symptoms in older Koreans living alone: secondary data analysis of the 2014 Korean longitudinal study of aging. BMC Geriatr 2018;18(1):186. DOI: https://doi.org/10.1186/s12877- 018-0882-4.
17. Morrow-Howell N, Hinterlong J, Rozario PA, Tang F. Effects of vol- unteering on the well-being of older adults. J Gerontol B Psychol Sci Soc Sci 2003;58(3):S137-S145. DOI: https://doi.org/10.1093/ger- onb/58.3.s137.
18. Hacihasanoglu R, Yildirim A, Karakurt P. Loneliness in elderly in- dividuals, level of dependence in activities of daily living (ADL) and influential factors. Arch Gerontol Geriatr 2012;54(1):61-66. DOI:
https://doi.org/10.1016/j.archger.2011.03.011.
19. Abdel-Khalek AM. Measuring happiness with a single-item scale.
Soc Behav Personal 2006;34(2):139-150. DOI: https://doi.org/
10.2224/sbp.2006.34.2.139.
20. Hills P, Argyle M. The Oxford Happiness Questionnaire: a compact scale for the measurement of psychological well-being. Per Individ Dif 2002;33(7):1073-1082. DOI: https://doi.org/10.1016/s0191- 8869(01)00213-6.