− 625 −
2005 국민건강영양조사 원자료를 이용한 우리나라 6~11세 어린이의 다소비 식품 1인 1회 섭취분량(portion size) 설정 및 성인과의 비교
최미경·이혜상1)·김숙배2)·김세나3)·김소영3)·김미현4)†
공주대학교 식품영양학과, 1)안동대학교 식품영양학과, 2)전북대학교 식품영양학과,
3)농촌진흥청 국립농업과학원 농식품자원부, 4)강원대학교 식품영양학과
Establishment of One Portion Size of Foods Frequently Consumed by Korean Children Aged 6-11 Using 2005 Korea National Health and Nutrition Examination Survey and Its Comparison with Adults'
Mi-Kyeong Choi, Hye-Sang Lee1), Sook-Bae Kim2), Se-Na Kim3), So-Young Kim3), Mi-Hyun Kim4)†
Department of Food and Nutrition, Kongju National University, Chungnam, Korea
1)Department of Food and Nutrition, Andong National University, Kyungbuk, Korea
2)Department of Food Science and Human Nutrition, Research Institute of Human Ecology, Chonbuk National University, Jeonbuk, Korea
3)Department of Agrofood Resources, NAAS, RDA, Gyeonggi, Korea
4)Department of Food and Nutrition, Kangwon National University, Gangwon, Korea
Abstract
The purpose of this study was to define a one portion size of food frequently consumed by Korean children aged 6-11 for convenient use in food selection, diet planning, nutritional evaluation, and nutrition education. We analyzed using the original data on 889 persons (9.96%) aged 6-11 years among 8,930 persons to whom NHANES 2005 and selected food items consumed by the intake frequency of 10 or higher among the 500 most frequently consumed food items. A total of 172 varieties of food items of regular use were selected. Also the portion size of food items was set on the basis of the median (50 percentile) of the portion size for a single intake by a single person was analyzed. The portion size of cereals was 5 g for prosomillet to 120 g for hamburger. As for vegetables, it posted 1 g for red pepper to 50 g for nabakkimchi. The portion size of meats and products was 15 g for luncheon meat to 120 g for beef feet soup. In comparison of children's portion size with adults', the children's portion sizes of every food groups, with the exception of meats and eggs, were lower than those of adults. The portion size of the regular food items of children in this study will be conveniently and effectively used by children, children's diet planners and researchers in selecting food items for a nutritionally balanced diet and in assessing the children's diet intake. ( Korean J Community Nutr 15(5) : 625~635, 2010) KEY WORD : portion size·frequently consumed foods·Korean children aged 6-11
—————————————————————————
서 론
—————————————————————————
학동기 어린이는 신체적, 정신적으로 성장과 발육이 왕성
하여, 이 시기의 균형 잡힌 영양섭취와 올바른 식습관은 정 상적인 사회적, 정신적, 지적능력의 발달을 좌우하게 될 뿐 아니라, 어릴 때 형성된 식습관은 성인이 되어서도 바꾸기 어 렵기 때문에 평생 건강에 영향을 미치게 된다. 이러한 중요 한 시기에 있는 학동기 어린이에서 급속한 경제성장으로 인 한 식생활의 서구화, 식품산업의 발달, 부모의 바쁜 사회생 활로 인한 식생활에의 관심 부족, 과중한 학업으로 인한 불 규칙한 식습관과 부적절한 간식 섭취에 의해 성장장애, 과체 중, 비만, 충치와 같은 다양한 영양문제가 나타나고 있음이 지적되고 있다(Kang 등 1997; Lee 등 2005; Kim 등 2006b). 따라서 평생건강관리차원에서 학동기 어린이를 대
접수일: 2010년 89월 82일 접수수정일: 2010년 10월 14일 수정 채택일: 2010년 10월 16일 채택
*This study was financially supported by the National Academy of Agricultutal Science of Rural Development
†Corresponding author: Mi-Hyun Kim, Department of Food and Nutrition, Kangwon National University, Gyo-dong, Samcheok-si, Gangwon-do 245-711, Korea
Tel: (033) 570-6883, Fax: (033) 570-6883 E-mail: [email protected]
상으로 한 올바른 식생활 교육의 필요성이 매우 높다. 다행 히 2007년 어린이가 많은 시간을 보내게 되고 최소 1끼의 식사를 제공 받게 되는 학교에 영양교사 배치의 법적 근거가 마련되어, 영양교사에 의한 영양교육이 시행 될 수 있게 되 었다(Lee 등 2008). 그러나 어린이를 위한 식생활 교육 자 료의 개발은 아직 미흡한 상태로, 실제로 경기지역과 충남지 역의 학교영양사를 대상으로 학교 영양교육 현황과 영양교 육 교재 요구도를 조사한 Kim 등(2006a)의 연구에서 조사 대상자의 98.8%가 영양교육, 특히 영양상담시 보조적 영양 교육 자료가 필요하다고 응답하였다. 영양교육 자료 개발 시 포함시켜야 할 내용에 대한 조사결과에서는 ‘조리법’, ‘식품 과 열량’, ‘골고루 먹자’, ‘우리 몸과 영양소, ‘적절한 음식량’
등으로 나타났다. 한편, Kim & Choi (2008)는 학동기 어 린이를 대상으로 영양교육의 실시 효과를 평가한 여러 연구 결과들(Kim & Lee 2000; Shin 등 2004; Choi 등 2007)에서 영양교육에 의하여 영양지식 및 식생활 태도는 유의적으로 향상되나, 영양소의 섭취의 균형적 변화에 있어 서 효과가 미미함을 지적하고, 실질적으로 바람직한 영양소 섭취를 유도할 수 있는 영양교육도구의 필요성을 제시하였 다. 이와 같이 영양교육 교재 내용에 대한 요구도 조사 및 Kim & Choi (2008)의 지적 등을 고려하여 보면, 어린이를 위한 영양교육, 식품선택, 식사계획, 영양평가 등에 손쉽게 활용할 수 있는 식품영양정보 제공 자료 개발의 필요성이 높 다고 생각된다.
식품에 함유된 영양소 함량 정보를 제공하는 우리나라 식 품성분표(National Rural Resources Development Institute 2007)는 전문가를 위한 것뿐이었으며, 식품의 영 양소 함량이 식품의 가식부량 100 g 단위로 표시되어 있어 실제 섭취분량의 영양소 함량을 알기 위해서는 100 g 단위 의 함량을 실제 섭취량으로 다시 환산해야 하는 번거로움이 있다. 미국, 일본 등에서는 실제 섭취량을 근거로 1인 1회 섭 취분량(portion size)이 설정되어 있으며, 이를 기준으로 한 다양한 영양가표들이 소책자 형식으로 개발·시판되고 있어 일반인들이 쉽게 이용할 수 있다. 또한 기존의 우리나라의 1 인 1회 섭취분량에 대한 연구들은 개인단위가 아닌 세대 단 위의 식이조사 자료를 이용하였거나, 전국 규모가 아닌 일부 지역의 식이조사 자료이거나(National Rural Resources Development Institute 2000) 또는 문헌고찰이나 실험조 리에 의존하고 있기 때문에(Korea Food Research Institute 1997) 실제의 개인별 식품 섭취량과 차이가 있어 일반인들이 실생활에 적용하는데 어려움이 있다. 이에 2002 년에는 일반인들이 손쉽게 활용할 수 있는 성인의 다소비 식품 1인 1회 섭취분량을 수록한 ‘소비자가 알기 쉬운 식
품영양가표(National Rural Resources Development Institute 2002)’가 개발되어 보고된 바 있다. 현재 영양섭 취 평가에 이용되고 있는 CAN-Pro 3.0(The Korean Nutrition Society 2006)에서도 1회 섭취분량이 제시되어 있으나, 이 또한 성인 기준으로 되어 있어 어린이의 섭취상 태 평가 시 섭취량을 조정해야하지만, 그 기준이 전혀 마련 되어 있지 않은 실정이다.
따라서 본 연구에서는 학동기 어린이의 식생활 계획과 평 가 및 영양교육에 간편하게 사용할 수 있는 식품영양가표를 개발하는 목적으로 어린이 다소비식품을 선정하고 이의 1회 분량을 설정하고자 하였다. 이에 우리나라에서 실시된 ‘개 인’ 단위의 식이조사이며 전국 규모 조사인 2005년도 국민 건강영양조사의 원자료(Ministry of Health & Welfare 2007)를 이용하여 실제의 개인별 식품 섭취량을 근거로 6~11세 학동기 어린이의 상용 식품을 선정하고 이의 1인 1회 섭취분량을 분석하였다. 또한 2009년에 발표된 성인 의 상용 식품 1인 1회 섭취분량(Rural Development Administration 2009; Choi 등 2010)과의 비교를 실시하 여 학동기 어린이와 성인의 상용 식품별 섭취량의 차이를 확 인하고자 하였다.
—————————————————————————
연구대상 및 방법
—————————————————————————
1. 자료
1인 1회 섭취분량(portion size)은 전국규모 ‘개인’ 단위 의 식이조사인 2005년 국민건강영양조사(Ministry of Health & Welfare 2007)에서 식품섭취조사를 실시한 대 상자 8,930명 중 6~11세 연령의 대상자 889명(9.96 %) 의 원자료를 이용하여 분석하였다.
2. 상용 식품과 음식의 선정
어린이의 상용 식품 및 음식은 대상자들이 섭취한 식품 또 는 음식의 다빈도 순위 상위 500위 이내에 포함된 식품과 음 식 중에서 10빈도 이상 섭취하여 일상적으로 소비되는 것으 로 선정하였으며, 500순위에 포함되지 않았더라도 단체급 식이나 외식에서 급식되는 식품이나 음식 중 빈도가 높은 것 은 추가하여 최종적으로 172종을 선정하였다.
3. 6~11세 어린이 상용 식품과 음식의 1인 1회 섭취분량 분석
1인 1회 섭취분량의 산출은 미국의 portion size 분석자
료(Pao 등 1982) 및 영양표시를 위한 참고치를 산정하는
방법(DHHS/FDA 1993)에 준하여 실시하였고, 1인 1회
섭취분량별 영양가는 식품성분표(National Rural Develop- ment Institute 2007)를 근거로 산출하였다. 식품의 1인 1 회 섭취분량은 분석된 1인 1회 섭취분량의 중앙값(50th percentile)을 기준으로 설정하였는데, 이는 연구 자료로 사 용된 2005년 국민건강 영양조사의 원자료가 정규분포로 이 루어져 있지 않고, 다양하고 극단적인 값을 배제할 수 있으 며, 또한 5, 10 단위 등으로 측정한 값들의 평균은 오히려 타 당성에 문제가 있어 일반적으로 ‘중심위치의 척도’로 평균치 보다 중앙치가 사용되기 때문이다. 따라서 본 연구에서는 1 인 1회 섭취분량을 중앙값을 기준으로 하고 평균치와 최빈 치를 고려하여 5, 10 g 단위로 반올림하여 설정하되 10 g 미만인 양은 1 g 단위로 설정하였고 액체식품은 mL 단위로 설정하였다. 계절식품의 경우에는 주 계절에 사용된 양으로 1인 1회 섭취분량을 설정하였고, 뼈나 껍질이 있는 식품은 가식부위로 1인 1회 섭취분량을 설정하였다. 가공식품의 경 우 일반 소비자들이 편하게 받아들이는 적정량이나 포장단 위로 설정하였고 조미료는 계량스푼 단위로 나타내었다.
4. 6~11세 어린이와 성인의 상용식품 1인 1회 섭취분량 비교
성인의 상용식품 1인 1회 섭취분량은 2009년에 발표된 성인의 1인 1회 섭취분량 자료(Rural Development Administration 2009; Choi 등 2010) 374종 중 어린이 의 상용식품(172종)과 공통으로 선정된(167)종에 대하여 어린이 섭취분량과의 백분율(%)을 제시하였다.
5. 통계분석
본 연구에서 1회 분량을 설정하기 위하여 SAS program (version 9.1)을 이용하여 평균, 표준편차, 백분위수 25, 50(중위수), 75, 최빈값을 분석하였다.
—————————————————————————
결 과
—————————————————————————
1. 6~11세 어린이의 상용 식품 1인 1회 섭취분량
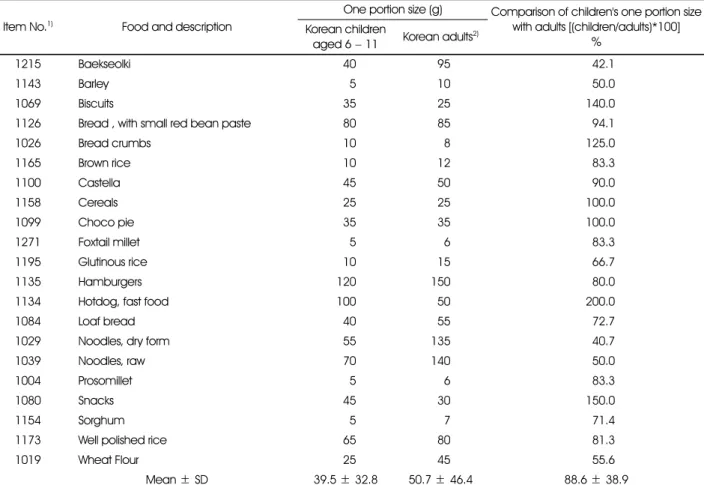
식품군별로 선정된 상용 식품의 1인 1회 섭취분량은 Table 1~9에 제시하였다. 선정된 다빈도 식품들은 식품성분표
Table 1. The comparison of one portion sizes of cereals and cereal products between Korean children aged 6-11 and adults Item No.
1)Food and description
One portion size (g) Comparison of children's one portion size with adults [(children/adults)*100]
% Korean children
aged 6 − 11 Korean adults
2)1215 Baekseolki 40 95 42.1
1143 Barley 5 10 50.0
1069 Biscuits 35 25 140.0
1126 Bread , with small red bean paste 80 85 94.1
1026 Bread crumbs 10 8 125.0
1165 Brown rice 10 12 83.3
1100 Castella 45 50 90.0
1158 Cereals 25 25 100.0
1099 Choco pie 35 35 100.0
1271 Foxtail millet 5 6 83.3
1195 Glutinous rice 10 15 66.7
1135 Hamburgers 120 150 80.0
1134 Hotdog, fast food 100 50 200.0
1084 Loaf bread 40 55 72.7
1029 Noodles, dry form 55 135 40.7
1039 Noodles, raw 70 140 50.0
1004 Prosomillet 5 6 83.3
1080 Snacks 45 30 150.0
1154 Sorghum 5 7 71.4
1173 Well polished rice 65 80 81.3
1019 Wheat Flour 25 45 55.6
Mean ± SD 39.5 ± 32.8 50.7 ± 46.4 88.6 ± 38.9
1) National Rural Resources Development Institute (2007): Food composition table, 7th edition, Rural Development Administration, Suwon
2) Rural Development Administration (2009): Food composition table for convenient use by general consumers. Rural Development
Administration, Suwon
(National Rural Development Institute 2007)의 식품 군 분류에 준하여 총 16개 식품군으로 분류하였으며, 일부 식품(마요네즈, 미트볼, 토마토패이스트)의 경우 소비자에 게 더 친숙하게 활용될 수 있도록 통상적으로 인식되는 식품 군으로 분류하였다. 선정된 어린이 상용식품 중 곡류 및 그 제품(21종)군의 1인 1회 분량은 기장 5 g에서 햄버거 120 g 의 범위를 보였고, 평균값은 39.5 ± 32.8 g이었다. 주식이 되는 쌀의 경우는 65 g이었다. 감자류(4종)는 전분 5 g에서
감자스낵 65 g의 범위였고, 평균 31.3 ± 25.6 g 이었다.
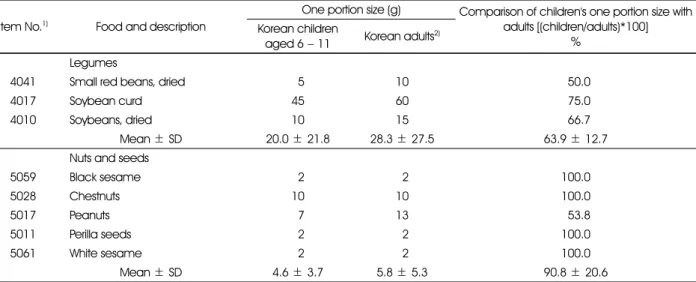
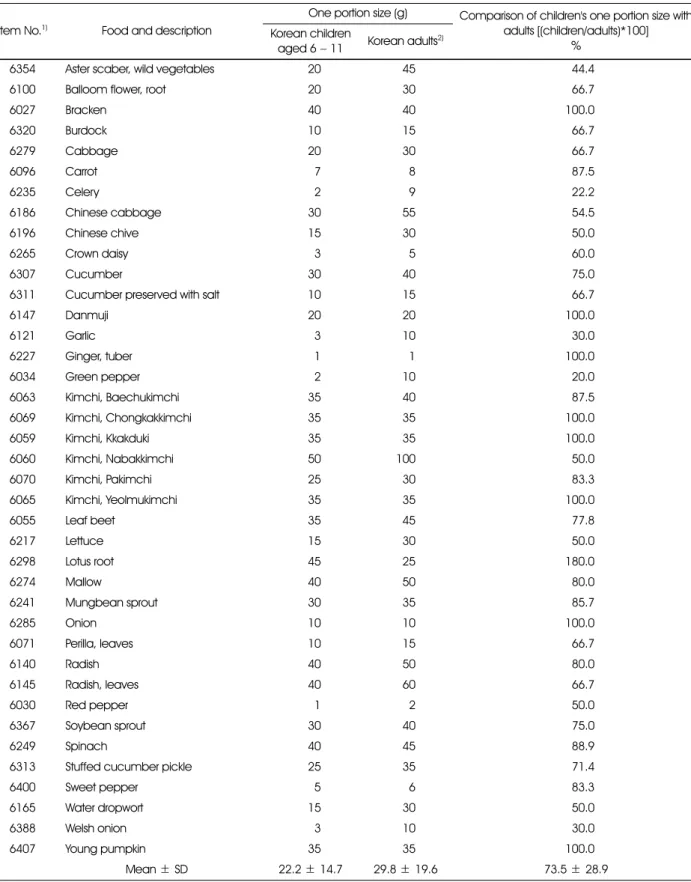
당류 및 그제품(4종)은 설탕 1 g에서 초콜릿 20 g의 범위 였고, 평균 8.3 ± 8.8 g이었으며, 두류(3종)는 팥 5 g, 대 두 10 g, 두부 45 g이었다. 견과류 및 종실류(5종)는 깨류 2 g, 땅콩 7 g, 밤 10 g이었다. 채소류(39종)는 붉은 고추 1 g에서 나박김치 50 g의 범위를 보였고, 평균 22.2 ± 14.7 g이었으며, 단일 채소로서 1인 1회 분량이 가장 큰 채 소는 연근으로 45 g이었다. 버섯류(6종)는 목이버섯 1 g에
Table 2. The comparison of one portion sizes of potatoes and sugar between Korean children aged 6 − 11 and adults Item No.
1)Food and description
One portion size (g) Comparison of children's one portion size with adults [(children/adults)*100]
% Korean children
aged 6 − 11 Korean adults
2)Potatoes and starches
2001 Potato 45 65 869.2
2011 Potato chips 60 45 133.3
2030 Starch 85 85 100.0
2040 Sweet potato Starch vermicelli, dry 15 20 875.0
Mean ± SD 31.3 ± 25.6 33.8 ± 26.6 94.4 ± 29.2
Sugar and sugar products
3021 Candy 10 86 166.7
3043 Chocolate 20 25 880.0
3014 Molasses 82 20 10.0
3024 Sugar 81 12 888.3
Mean ± SD 8.3 ± 8.8 15.8 ± 8.4 66.3 ± 74.8
1) National Rural Resources Development Institute (2007): Food composition table, 7th edition, Rural Development Administration, Suwon
2) Rural Development Administration (2009): Food composition table for convenient use by general consumers. Rural Development Administration, Suwon
Table 3. The comparison of one portion sizes of legumes, nuts and seeds between Korean children aged 6 − 11 and adults Item No.
1)Food and description
One portion size (g) Comparison of children's one portion size with adults [(children/adults)*100]
% Korean children
aged 6 − 11 Korean adults
2)Legumes
4041 Small red beans, dried 85 10 850.0
4017 Soybean curd 45 60 875.0
4010 Soybeans, dried 10 15 866.7
Mean ± SD 20.0 ± 21.8 28.3 ± 27.5 63.9 ± 12.7
Nuts and seeds
5059 Black sesame 82 82 100.0
5028 Chestnuts 10 10 100.0
5017 Peanuts 87 13 853.8
5011 Perilla seeds 82 82 100.0
5061 White sesame 82 82 100.0
Mean ± SD 4.6 ± 3.7 5.8 ± 5.3 90.8 ± 20.6
1) National Rural Resources Development Institute (2007): Food composition table, 7th edition, Rural Development Administration, Suwon
2) Rural Development Administration (2009): Food composition table for convenient use by general consumers. Rural Development
Administration, Suwon
Table 4. The comparison of one portion sizes of vegetables between Korean children aged 6-11 and adults Item No.
1)Food and description
One portion size (g) Comparison of children's one portion size with adults [(children/adults)*100]
% Korean children
aged 6 − 11 Korean adults
2)6354 Aster scaber, wild vegetables 20 45 44.4
6100 Balloom flower, root 20 30 66.7
6027 Bracken 40 40 100.0
6320 Burdock 10 15 66.7
6279 Cabbage 20 30 66.7
6096 Carrot 87 8 87.5
6235 Celery 82 9 22.2
6186 Chinese cabbage 30 55 54.5
6196 Chinese chive 15 30 50.0
6265 Crown daisy 3 5 60.0
6307 Cucumber 30 40 75.0
6311 Cucumber preserved with salt 10 15 66.7
6147 Danmuji 20 20 100.0
6121 Garlic 3 10 30.0
6227 Ginger, tuber 1 1 100.0
6034 Green pepper 2 10 20.0
6063 Kimchi, Baechukimchi 35 40 87.5
6069 Kimchi, Chongkakkimchi 35 35 100.0
6059 Kimchi, Kkakduki 35 35 100.0
6060 Kimchi, Nabakkimchi 50 100 50.0
6070 Kimchi, Pakimchi 25 30 83.3
6065 Kimchi, Yeolmukimchi 35 35 100.0
6055 Leaf beet 35 45 77.8
6217 Lettuce 15 30 50.0
6298 Lotus root 45 25 180.0
6274 Mallow 40 50 80.0
6241 Mungbean sprout 30 35 85.7
6285 Onion 10 10 100.0
6071 Perilla, leaves 10 15 66.7
6140 Radish 40 50 80.0
6145 Radish, leaves 40 60 66.7
6030 Red pepper 1 2 50.0
6367 Soybean sprout 30 40 75.0
6249 Spinach 40 45 88.9
6313 Stuffed cucumber pickle 25 35 71.4
6400 Sweet pepper 5 6 83.3
6165 Water dropwort 15 30 50.0
6388 Welsh onion 3 10 30.0
6407 Young pumpkin 35 35 100.0
Mean ± SD 22.2 ± 14.7 29.8 ± 19.6 73.5 ± 28.9
1) National Rural Resources Development Institute (2007): Food composition table, 7th edition, Rural Development Administration, Suwon
2) Rural Development Administration (2009): Food composition table for convenient use by general consumers. Rural Development
Administration, Suwon
Table 5. The comparison of one portion sizes of mushrooms and Fruits between Korean children aged 6 − 11 and adults Item No.
1)Food and description
One portion size (g) Comparison of children's one portion size with adults [(children/adults)*100]
% Korean children
aged 6 − 11 Korean adults
2)Mushrooms
7003 Oyster mushroom 20 25 80.0
7006 Ear mushroom, dried 1 2 50.0
7025 Agaricus bisporus 10 10 100.0
7038 Winter mushroom 10 10 100.0
7044 Oak mushroom 10 10 100.0
7046 Oak mushroom, dried 3 3 100.0
Mean ± SD 9.0 ± 6.7 10.0 ± 8.2 88.3 ± 20.4
Fruits
8090 Apple 100 150 66.7
8063 Banana 110 135 81.5
8011 Citrus fruit 100 100 100.0
8158 Grape 70 70 100.0
8162 Grape juice 180 200 90.0
8143 Kiwi 45 45 100.0
8121 Orange 120 200 60.0
8124 Orange juice 180 200 90.0
8137 Oriental melon 100 140 71.4
8065 Pear 100 150 66.7
8001 Persimmon 45 45 100.0
8160 Raisin 4 4 100.0
8036 Strawberry 60 75 80.0
6379 Tomato 50 100 50.0
6381 Tomato juice 180 210 85.7
8110 Watermelon 120 130 92.3
Mean ± SD 97.8 ± 51.8 122.1 ± 63.1 83.4 ± 16.2
1) National Rural Resources Development Institute (2007): Food composition table, 7th edition, Rural Development Administration, Suwon 2) Rural Development Administration (2009): Food composition table for convenient use by general consumers. Rural Development
Administration, Suwon
Table 6. The comparison of one portion sizes of meats and eggs between Korean children aged 6 − 11 and adults Item No.
1)Food and description
One portion size (g) Comparison of children's one portion size with adults [(children/adults)*100]
% Korean children
aged 6 − 11 Korean adults
2)Meats and products
17043 A meatball fried in egg batter 25 − −
9168 Beef feet, soup 200 − −
9137 Beef, loin 40 45 88.9
9142 Beef, plate 20 35 57.1
9143 Beef, round 50 25 200.0
9015 Chicken, fowl meat 80 95 84.2
9016 Chicken, lean 60 95 63.2
9121 Pork product, ham 35 15 233.3
9128 Pork product, Luncheon meat 15 15 100.0
9085 Pork, belly 130 155 83.9
9081 Pork, boston butt 30 − −
9077 Pork, loin 60 65 92.3
9071 Pork, rib 90 130 69.2
9083 Pork, shank 90 − −
9114 Sausage, vienna 45 35 128.6
Mean ± SD 64.7 ± 48.9 64.5 ± 47.9 109.2 ± 57.0
Eggs
10005 Hen’s egg 50 40 125.0
10015 Quail’s egg 35 40 87.5
Mean ± SD 42.5 ± 10.6 40.0 ± 0.0 106.3 ± 26.5
1) National Rural Resources Development Institute (2007): Food composition table, 7th edition, Rural Development Administration, Suwon 2) Rural Development Administration (2009): Food composition table for convenient use by general consumers. Rural Development
Administration, Suwon
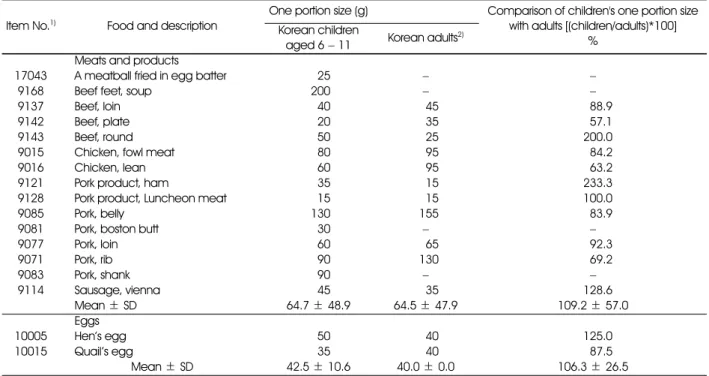
서 느타리버섯 20 g의 범위를 보였고, 평균 9.0 ± 6.7 g이 었다. 과실류(16종)는 건포도 4 g에서 과일주스류 180 g의 범위를 보였고, 평균은 97.8 ± 51.8 g이었으며, 주스류를 제외하고 1인 1회 분량이 가장 큰 과일은 수박과 오렌지로 120 g이었다. 육류(15종)는 돼지고기가공품(런천미트) 15 g에서 우족국물 200 g의 범위를 보였으며, 평균 64.7 ± 48.9 g이었고, 우족 국물을 제외하고 1인 1회 분량 이 가장 큰 육류는 돼지고기 삼겹살로 130 g이었다. 난류(2 종)는 메추라기알 35 g, 계란 50 g이었다. 어패류(19종)는 새우젓 1 g에서 조기 40 g의 범위를 보였고, 평균은 19.8 ± 13.1 g이었다. 해조류(4종)는 다시마 말린것 1 g 에서 미역 생것 20 g의 범위를 보였고, 평균은 6.8 ± 8.9 g 이었다. 우유 및 유제품(6종)은 치즈 20 g에서 우유 200 g
의 범위를 보였고, 평균은 94.2 ± 59.7 g이었다. 유지류(7 종)는 기름류 4 g에서 마요네즈 10 g의 범위를 보였고, 평 균은 5.00 ± 2.2 g이었다. 음료 및 주류(6종)는 코코아 분 말 30 g에서 과일탄산음료 250 g의 범위를 보였고, 평균은 210.5 ± 88.6 g이었다. 조미료류(15종)는 소금 1 g에서 자장소스 30 g의 범위를 보였고, 평균은 6.8 ± 7.7g 이었다.
2. 6~11세 어린이와 성인의 상용 식품 1인 1회 섭취분량 비교
2008년에 본 연구와 동일한 방법에 의하여 설정된 성인 의 상용 식품 1인 1회 섭취 분량 중 공통으로 선정된 167종 에 대하여 어린이 섭취분량과의 백분율(%)을 분석한 결과 는 다음과 같다(Table 1~9). 곡류 및 그 제품은 성인의
Table 7. The comparison of one portion sizes of fishes and seaweeds between Korean children aged 6 − 11 and adults Item No.
1)Food and description
One portion size (g) Comparison of children's one portion size with adults [(children/adults)*100]
% Korean children
aged 6 − 11 Korean adults
2)Fish, shellfish and fish/shellfish products
11172 Alaska pollack, dried 10 20 50.0
11174 Alaska pollack, frozen 25 50 50.0
11166 Anchovy, dried 5 5 100.0
11636 Common squid 40 35 114.3
11637 Common squid, dried 15 15 100.0
11560 Crab 20 45 44.4
11401 File fish, dried 15 15 100.0
11442 Fish paste 35 25 140.0
11018 Flat fish 25 45 55.6
11032 Hair tail 30 40 75.0
11550 Hard-shelled mussel 5 20 25.0
11491 Little neck clam 6 35 17.1
11039 Mackerel 35 50 70.0
11644 Salt-fermented squid, seasoned 15 15 100.0
11597 Shrimp 35 35 100.0
11601 Shrimp, dried 4 5 80.0
11625 Shrimp, salt-fermented 1 5 20.0
11094 Tuna, canned in oil 15 20 75.0
11392 Yellow croaker 40 45 88.9
Mean ± SD 19.8 ± 13.1 26.7 ± 15.7 74.0 ± 33.8
Seaweeds
12009 Laver 2 2 100.0
12035 Sea mustard, dried 4 6 66.7
12033 Sea mustard, raw 20 30 66.7
12018 Sea tangle, dried 1 1 100.0
Mean ± SD 6.8 ± 8.9 9.8 ± 13.7 83.3 ± 19.2
1) National Rural Resources Development Institute (2007): Food composition table, 7th edition, Rural Development Administration, Suwon
2) Rural Development Administration (2009): Food composition table for convenient use by general consumers. Rural Development
Administration, Suwon
Table 8. The comparison of one portion sizes of milk and oil between Korean children aged 6 − 11 and adults Item No.
1)Food and description
One portion size (g) Comparison of children's one portion size with adults [(children/adults)*100]
% Korean children
aged 6 − 11 Korean adults
2)Milk and dairy products
13032 Cheese 20 20 100.0
13010 Cow’s milk 200 200 50.0
13022 Ice cream 80 120 66.7
13020 Sherbet 100 80 125.0
13029 Yoghurt, curd type 100 110 59.1
13028 Yoghurt, liquid type 65 150 46.7
Mean ± SD 94.2 ± 59.7 113.3 ± 61.2 87.7 ± 28.7
Oils and fats
14010 Butter 5 5 100.0
14017 Corn oil 4 4 100.0
16025 Mayonnaise 10 10 100.0
14018 Olive oil 4 4 100.0
14003 Perilla seed oil 4 4 100.0
14023 Sesame oil 4 4 100.0
14028 Soybean oil 4 4 100.0
Mean ± SD 5.0 ± 2.2 5.0 ± 2.2 100.0 ± 0.0
1) National Rural Resources Development Institute (2007): Food composition table, 7th edition, Rural Development Administration, Suwon 2) Rural Development Administration (2009): Food composition table for convenient use by general consumers. Rural Development
Administration, Suwon
Table 9. The comparison of one portion sizes of beverages and seasonings between Korean children aged 6 − 11 and adults Item No.
1)Food and description (English)
One portion size (g) Comparison of children's one portion size with adults [(children/adults)*100], % Korean children
aged 6-11 Korean adults
2)Beverage
15013 Carbonated beverage 250 250 100.0
15019 Clear soda pop 250 250 100.0
15090 Cocoa, power 30 − −
15022 Coke 250 250 100.0
15012 Isotonic drink 245 250 98.0
15011 Sikhye 238 240 99.2
Mean ± SD 210.5 ± 88.6 248.0 ± 4.5 99.4 ± 0.9
Seasonings
16058 97.5% M.S.G. & 2.5% Nucleic acid 1 1 100.0
16062 Curry sauce, powder 15 8 187.5
16018 Doenjang 10 10 100.0
16010 Gochujang 5 18 27.8
16055 Jajang sauce 30 18 166.7
16049 Mixed soybean paste with red pepper paste 10 18 55.6
16071 Pepper 1 1 100.0
16009 Red pepper powder 2 2 100.0
16038 Salt 1 1 100.0
16057 Seasoning powder 1 1 100.0
16014 Sesame, roasted and ground 2 2 100.0
16001 Soy sauce 5 15 33.3
16067 Tomato ketchup 5 5 100.0
6383 Tomato paste 10 18 55.6
16047 Vinegar 4 4 100.0
Mean ± SD 6.8 ± 7.7 8.1 ± 7.3 95.1 ± 42.6
1) National Rural Resources Development Institute (2007): Food composition table, 7th edition, Rural Development Administration, Suwon 2) Rural Development Administration (2009): Food composition table for convenient use by general consumers. Rural Development
Administration, Suwon
88.6%의 분량을 나타내어 대부분의 식품에서 어린이의 1회 섭취분량이 성인에 비하여 적었으나, 비스킷(140.0%), 빵 가루(125.0%), 스낵과자(15.0%), 핫도그(200.0%)의 1 회 섭취 분량은 성인에 비하여 많은 것으로 나타났다. 감자 류는 성인의 94.4%, 당류 및 그제품은 성인의 66.3%의 분 량을 나타내어 역시 성인의 1회 섭취분량에 비하여 적었으 나, 사탕의 1회 섭취분량은 성인에 비하여 높았다(166.7%).
두류는 성인의 63.9%로 16개의 식품군중 성인의 1회 섭취 분량에 대비하여 비율이 가장 낮은 식품군 이었다. 견과류 및 종실류는 성인의 90.8%, 채소류는 73.5%, 버섯류는 88.3%, 과실류는 83.4%였다. 육류는 성인의 109.2%, 난 류는 성인의 106.3%로 16개의 식품군 중 성인보다 1회 섭 취분량이 높은 식품군이었다. 어패류는 74.0%, 해조류는 83.3%, 우유 및 유제품은 87.7%, 유지류는 100.0%, 음료 및 주류는 99.4%, 조미료는 95.1%의 비율을 나타내었다.
—————————————————————————
고 찰
—————————————————————————
영양교육, 식사계획 수립, 영양평가 및 국가 식량정책 수 립 등의 차원에서 식품 및 음식의 1인 1회 분량의 설정은 그 중요성이 매우 크다. 1인 1회 분량의 설정은 이용목적에 따 라 달라질 수 있는데(Krebs-Smith & Smiciklas-Wright 1985; Achterberg 등 1994), 목적에 따라서 1인 1회 섭 취기준량(serving size)과 1인 1회 실제섭취분량(portion size)의 2가지가 있을 수 있다. 1인 1회 섭취기준량은 건강 한 1일 식사구성에 대한 국민의 영양교육 지침으로 활용될 수 있는 반면 1인 1회 실제섭취분량(portion size)은 1회 섭취 시 소비자 개인이 먹기 위해 선택하는 양을 의미하며, 소비자들이 쉽게 자신이 먹은 식품의 양을 추정하는 것을 도 와 개인과 집단의 영양평가와 영양교육에 활용될 수 있다.
전국 규모의 식이조사인 국민건강영양조사가 1998년도 에 처음으로 ‘개인’ 단위로 실시되었다(Ministry of Health
& Welfare 1999). 이에 이 조사의 식품섭취량 자료에 근 거하여 대표 식품 및 대표 음식의 1인 1회 섭취분량을 설정 하여 ‘소비자가 알기 쉬운 식품영양가표(Rural Develop- ment Administration 2002)’가 개발된 바 있다. 이후 우 리나라 국민건강영양조사가 새로운 주기에 실시되어 2005 년도 국민건강영양조사 결과(Ministry of Health &
Welfare 2007)가 발표되면서 이의 원자료를 이용하여 ‘소 비자가 알기 쉬운 식품영양가표’ 개정을 위해 대표 식품을 선 정하고 이의 1인 1회 섭취분량이 설정, 발표되었다(Rural Development Administration 2009; Choi 등 2010).
이렇게 발표된 대표 식품의 1인 1회 분량은 성인의 섭취량
을 기준으로 하고 있다. 따라서 다른 생애주기에 해당하는 대 상자의 경우 1회 섭취분량이나 상용 식품에 차이를 보일 수 있어 활용에 제한점을 가지고 있다. 이러한 제한점을 해결하 고자 농촌진흥청에서는 단계적으로 국민건강영양조사 자료 를 근거로 다양한 생애주기를 대상으로 한 상용 식품과 1회 섭취분량을 설정하여 이에 대한 영양성분에 관한 정보를 제 공하는 사업을 추진하고 있다. 본 연구는 이러한 계획에 의 하여 수행되었으며, 다양하게 구분되는 생애주기 중 6~11 세 학동기 어린이를 우선적으로 선정한 이유는 학동기 어린 이는 서론에서 언급하였던 바와 같이 성장과 발육이 왕성하 여, 이 시기의 균형 잡힌 영양섭취와 올바른 식습관은 정상 적인 사회적, 정신적, 지적능력의 발달 뿐 아니라, 평생 건강 에 영향을 미치게 되는 중요한 시기이기 때문이다. 그러나 현 재까지 학동기 어린이를 위한 영양교육 자료가 충분치 않고 (Kim 등 2006a), 대규모의 개인별 식사섭취조사 자료를 바 탕으로 체계적이고 과학적인 분석방법에 의하여 영양소 섭 취량의 평가 및 올바른 식사계획에 활용하기 용이한 어린이 의 상용 식품 및 1회 섭취분량 자료는 제시된 바 없어, 그 중 요성과 활용도가 클 것으로 생각된다.
2005 국민건강영양조사 자료 중 6~11세 대상자의 실제 섭취량을 바탕으로 제시된 상용 식품과 1회 섭취분량은 어 린이들의 식사패턴을 파악하는 자료로서의 의미도 클 것으 로 생각된다. 특히 성인의 1회 섭취분량과의 비교 결과는 성 인과는 다른 6~11세 어린이의 식사패턴의 특징을 보여준 다. 어린이와 성인의 상용 식품 및 1회 섭취분량의 선정은 동 일하게 2005 국민건강영양조사의 자료를 활용하였나, 성인 의 경우 전체대상자 8,960명 중 60.87%인 5,436명을 대 상으로 하고 있고, 6~11세의 어린이는 9.96%인 889명을 대상으로 하고 있어 대상 인원수에서 큰 차이가 있었다. 따 라서 상용 식품 선정에 있어 최소 섭취빈도 기준을 성인은 30빈도 이상으로 하였으나 어린이는 10빈도 이상으로 한 차 이를 가지고 있다. 이와 같이 대상 인원수와 선정기준 빈도 의 차이가 있기는 하지만, 성인의 경우 상용 식품이 총 374 종으로 6~11세 어린이의 상용 식품으로 선정된 172개와 비교할 때 2배 정도의 차이를 보여 어린이가 성인에 비하여 식품섭취의 다양성이 떨어짐을 알 수 있었다. 한편 어린이의 상용 식품 172종을 기준으로 성인의 상용 식품과의 항목이 일치하는 것은 167종으로, 어린이 상용 식품 중 97.1%는 성인에 있어서도 상용되는 식품인 것으로 나타났다.
16개의 식품군 중 곡류 및 그 제품은 성인의 88.6%의
분량을 나타내어 대부분의 식품에서 어린이의 1회 섭취분
량이 성인에 비하여 적었으나, 비스킷(140.0%), 빵가루
(125.0%), 스낵과자(150.0%), 핫도그(200.0%)의 1회
섭취 분량은 성인에 비하여 많은 것으로 나타났다. 또한 감 자 및 전분류에서도 감자스낵(133.3%)이 성인의 섭취분량 에 비하여 높은 비율을 나타내어, 6~11세 어린이는 성인에 비하여 과자류 및 핫도그 등의 1회 섭취량이 많음을 알 수 있 다. 이는 어린이들의 과자에 대한 기호도가 높게 나타난 연 구보고와 일치하였다(Kang 등 2004). 한국인의 식사에서 기본이 되는 밥의 식재료인 쌀의 경우 1회 섭취분량이 65 g 으로 성인의 80g에 비하여 81.3%를 보였다. 한국영양학회 에서 제시하고 있는 백미의 1인 1회 섭취기준량(The Korean Nutrition Society 2005)은 90 g인데, 이 역시 성인을 기준으로 하고 있기 때문에 큰 차이를 보이고 있다.
단백질의 급원식품에 해당하는 두류는 63.9%, 육류는 109.2%, 난류는 106.3%, 어패류는 74.0%으로, 식물성 단 백질의 급원이 되는 두류는 16개 식품군 중에서 성인의 1회 섭취분량대비 가장 낮은 섭취분량을 나타낸 식품군인 반면, 육류와 난류의 1회 섭취분량은 성인에 비하여 높은 1회 섭 취분량이 제시된 식품군으로 어린이들의 단백질 급원식품군 의 선호 경향이 성인과 뚜렷한 차이를 보이고 있음을 알 수 있다. 또한, 채소류의 1회 섭취 분량은 성인의 73.5%로 역 시 성인에 비하여 1회 분량이 적은 식품군 중의 하나였다. 캐 나다의 5학년 아동을 대상으로 한 연구에서도 아동들은 후 렌치후라이, 육류, 감자칩에 대하여서는 권장되는 1회 분량 보다 더 많은 1회 분량을 선호하였고, 채소에 있어서는 권장 되는 1회 분량 보다 더 적은 1회 분량을 선호하는 것으로 나 타나 본 연구결과와 유사성을 보였다(Colapinto 등 2007).
성인의 1회 섭취분량과 차이를 보이지 않은 식품군은 유 지류와 음료류로 나타났는데, 이는 1회 분량 설정과정에서 가공식품의 경우 일반 소비자들이 편하게 받아들이는 적정 량이나 포장단위로 설정하였고, 조미료는 계량스푼 단위로 나타내게 되어 실질적인 섭취량의 차이가 보정되었기 때문 으로 사료된다.
최근 우리나라는 학동기 아동의 영양문제 중 아동 비만의 증가가 큰 사회적 문제로 지적되고 있다(Ministry of Health and Welfare 2006). 미국에서 1인 1회 섭취분량이 30년 간 꾸준히 증가하여 왔는데, 이는 비만 인구 증가에 하나의 원인이 된다고 보고되고 있다(Nestle 2003; Young &
Nestle 2003). 유아와 아동을 대상으로 한 연구에서도 1 인 1회 섭취분량이 총 에너지 섭취량이나 체중과 양의 관련 성을 갖는 것으로 보고되었다(Orlet Fisher 등 2003;
McConahy 등 2004; Fox 등 2006). 따라서 우리나라에 서도 주기적으로 국민건강영양조사가 실시되어 그 자료가 발 표됨에 따라 향후 지속적인 어린이의 상용 식품 및 음식의 1 인 1회 섭취분량 설정 연구가 필요하고 자료가 축적됨에 따
라 이를 비교분석하는 연구도 이루어져야 할 것으로 사료된 다. 한편 본 연구에서 설정된 6~11세 어린이의 상용 식품의 1인 1회 섭취분량은 그 활용도를 높이기 위하여 1인 1회 섭 취분량별 식품과 음식의 영양가표와 실물 크기의 사진을 추 가하여 2009년 ‘우리아이 영양길잡이(어린이 영양성분표)’
를 발간하였다(Rural Development Administration 2009b). 이러한 자료와 본 연구결과는 영양적으로 균형 잡 히고 합리적인 식품 선택에 있어 어린이 자신과 어린이의 식 생활을 관리하는 학부모, 영양사들이 간편하고 유용하게 활 용할 수 있을 것이다.
—————————————————————————
요약 및 결론