Introduction
The typical percentage of blood eosinophils in healthy in- dividuals is less than 5%
1. Absolute eosinophil count can be determined by multiplying total white blood cell count by the percentage of eosinophils. Eosinophilia is considered when absolute eosinophil count exceeds 500/µL in peripheral blood.
Eosinophilia can be categorized as mild (absolute eosinophil count ranges from 500/µL to 1,500/µL), moderate (absolute eosinophil count ranges from 1,500/µL to 5,000/µL), or severe (absolute eosinophil count >5,000/µL)
2. Peripheral blood eo- sinophilia can be caused by parasitic infections, allergy, drug reactions, leukemia, and non-hematologic cancers
1.
Peripheral Eosinophilia and Clinico-radiological Characteristics among Health Screening
Program Recipients
Tae Yun Park, M.D.*, Jae-Woo Jung, M.D., Ph.D.*, Ju Young Jang, M.D., Ph.D., Jae Chol Choi, M.D., Ph.D., Jong Wook Shin, M.D., Ph.D., In Won Park, M.D., Ph.D., Byoung Whui Choi, M.D., Ph.D.
and Jae Yeol Kim, M.D., Ph.D.
Department of Internal Medicine, Chung-Ang University College of Medicine, Seoul, Korea
Background: Eosinophilia is well recognized in specific conditions. The objective of the present study was to determine clinico-radiologic characteristics of eosinophilia and changes in prevalence over 10 years in recipients of private health screening program at a tertiary hospital in Korea.
Methods: Data of private health screening program recipients at the health promotion center of Chung-Ang University Hospital from 2004 to 2013 were collected. Health-related questionnaires and laboratory findings of private health screening program with possible relation with eosinophilia were reviewed. Results of enzyme-linked immunosorbent assay (ELISA) for parasite, chest computed tomography, and pulmonary function test were also reviewed.
Results: The cumulative prevalence of eosinophilia was 4.0% (1,963 of 48,928). Prevalence of eosinophilia showed a decreased trend from 2004 to 2013. Most cases (96.6%) had mild degree of eosinophilia. Eosinophilic subjects were older and male-predominant. They showed lower levels of forced expiratory volume in 1 second (FEV
1%), forced vital capacity (FVC%), and FEV
1/FVC than those without eosinophilia. Eosinophilic subjects showed higher positive rate for common parasite in ELISA than those without eosinophilia. On radiologic findings, consolidation and ground glass opacities were positively associated with the degree of eosinophilia. When eosinophil was classified based on severity, statistically significant correlation between the severity of eosinophil and radiologic abnormalities was found.
Conclusion: Eosinophilia is uncommon in healthy population. It usually occurs at a mild degree. Eosinophilic patients have more radiologic abnormalities compared to those without eosinophilia. Such radiologic abnormalities are associated with the severity of eosinophilia.
Keywords: Eosinophilia; Prevalence; Tomography, X-Ray Computed
Address for correspondence: Jae Yeol Kim, M.D., Ph.D.
Department of Internal Medicine, Chung-Ang University Hospital, 102 Heukseok-ro, Dongjak-gu, Seoul 06973, Korea
Phone: 82-2-6299-1005, Fax: 82-2-825-7571 E-mail: [email protected]
*Tae Yun Park and Jae-Woo Jung contributed equally to this work.
Received: Feb. 9, 2017 Revised: May. 30, 2017 Accepted: Oct. 10, 2017 Published online: Nov. 27, 2017
cc
It is identical to the Creative Commons Attribution Non-Commercial License (http://creativecommons.org/licenses/by-nc/4.0/).
Copyright © 2018
The Korean Academy of Tuberculosis and Respiratory Diseases.
The urgency for the evaluation of eosinophilia depends on the presence and the degree of tissue and/or organ involve- ment. There are many reports of acutely ill patients with extremely high eosinophil count or outpatients with signs of organ involvement
3-6. However, eosinophilia might be discov- ered as an incidental finding based on complete blood count in an otherwise healthy individual. Because eosinophilia in such situation is rarely reported, collective features of inciden- tal eosinophilia have not been clearly delineated.
Our health screening program is not a national health screening program. It is a private health screening program.
It is performed for subjects who want to take a health check.
Such private health screening program in our medical in- stitutes almost always includes complete blood count. Our hospital health screening program also contains many other useful tests such as stool parasite exam, blood chemistry, uri- nalysis, ultrasound of upper abdomen, chest X-ray, and chest computed tomography (CT). It can provide information re- garding the prevalence of eosinophilia in healthy population.
It is also helpful in defining the cause of eosinophilia.
Changes in prevalence of eosinophilia over time in healthy population have rarely been reported. Therefore, the objective of the present study was to evaluate the prevalence of eosino- philia among recipients of private health screening program at the health promotion center of Chung-Ang University Hos- pital from 2004 to 2013. Clinical characteristics of those with eosinophilia were determined. Annual trend of prevalence and severity of eosinophilia were evaluated. Patterns of eosin- ophilia according to gender, age, and radiologic findings were also analyzed.
Materials and Methods
1. Study subjects
Ten years of data of health screening program recipients at the health promotion center of Chung-Ang University Hos- pital from 2004 to 2013 were reviewed. From 2004 to 2013, there were 87,134 health screening cases at the health promo- tion center of Chung-Ang University Hospital. A total of 37,077 cases were excluded because they were taken by the same recipients for regular annual check-up after the initial visit.
In addition, 1,195 cases were excluded because eosinophil percentage was not reported. Four cases were excluded due to young age (<18 years). Therefore, a total of 48,928 subjects were included for analysis of this study (Figure 1).
Health-related questionnaires which contained demo- graphic data were specifically reviewed. Laboratory findings of health screening program with possible relations with eo- sinophilia such as stool parasite exam, blood chemistry, and spirometry data were evaluated. Radiologic findings were retrospectively reviewed by one chest radiologist. One pul- monologist reviewed the final report of radiologist. Most CT scans were low dose chest CT, the most frequently used scan to screen lung cancer in private health screening program.
Eosinophilia was defined when absolute eosinophil count exceeded 500/µL in peripheral blood. This study protocol was approved by the Institutional Review Board of Chung- Ang University Hospital (approval No. C2014146 (1342)) and documentation of informed consent was waived.
Total (n=87,134)
(n=48,928)
No eosinophilia (n=46,965)
Eosinophilia (n=1,963)
Excluded cases
Follow-up loss (n=1,892) Excluded cases
Regular check-up (n=37,007)
No eosinophil counts obtained (n=1,195) Less than 18 years old (n=4)
Cause of eosinophilia Idiopathic (n=29) Allergic disease (n=23) Asthma (n=9) Parasite (n=6) Cancer (n=2) Drug (n=1)
Eosinophilic pneumonia (n=1)
Figure 1. Flow chart describing study
subjects’ selection.
2. Statistical analysis
All statistical analyses were performed using SPSS ver- sion 16.0 (SPSS Inc., Chicago, IL, USA). Continuous variables were expressed as means and standard deviations of the means. Categorical variables were presented as numbers and percentages. Differences in values between those with eosinophilia and those without eosinophilia were evaluated using chi-square test and Student’s t test. Statistical significant change in annual prevalence of eosinophilia during the ob- served period was evaluated by binary logistic regression after adjusting for age and sex. It was expressed as odds ratio (OR) with 95% confidence interval (CI). A p-value of less than 0.05 was considered statistically significant.
Results
1. Comparison of clinical characteristics according to the presence or absence of eosinophilia
Among 46,928 cases, 1,963 (4.0%) had eosinophilia (abso- lute eosinophil count ≥500/µL). Mild eosinophilia (absolute eosinophil count of 500/µL to 1,500/µL) was found in most cases (n=1,893, 96.5%). Moderate eosinophilia (absolute eo- sinophil count of 1,500/µL to 5,000/µL) was found in 68 cases (3.5%) while severe eosinophilia (≥5,000/µL) was only found in 1 case (0.1%) in subjects with eosinophilia.
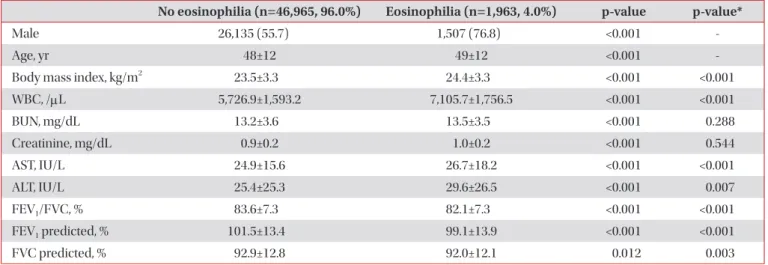
Clinical characteristics were assessed for all study subjects according to the presence or absence of eosinophilia (Table 1). Subjects with eosinophilia were older (p<0.001) than those without eosinophilia. They showed higher proportion of
males (76.8% vs. 55.7%, p<0.001). Subjects with eosinophilia also had higher levels of body mass index, leukocyte count, aspartate aminotransferase, and alanine aminotransferase than those without eosinophilia after adjusting for age and sex (all p<0.01). Subjects with eosinophilia showed lower levels of forced expiratory volume at one second (FEV
1), forced vital capacity (FVC), and FEV
1/FVC percentage than those without eosinophilia after adjusting for age and sex (all p<0.01).
2. Prevalence of eosinophilia according to age group and sex
The prevalence of eosinophilia increased with advancing age (p for trend <0.001) (Figure 2A). After adjusting for sex, the OR of eosinophilia in 10-year-old was 1.098 (95% CI, 1.053–
1.146; p<0.001). Regarding gender difference, male subjects showed significantly higher trend in the prevalence of eosino- philia with advancing age (p for trend <0.001; OR, 1.114; 95%
CI, 1.060–1.170) (Figure 2B). However, such significance was not detected in females (p for trend=0.255).
3. Annual trend of prevalence of eosinophilia
Annual prevalence of eosinophilia decreased during the observed period (p for trend <0.001) (Figure 3A). After adjust- ing for age and sex, OR of eosinophilia in 1 year was 0.942 (95%
CI, 0.926–0.958) (p<0.001). In both males and females, annual prevalence of eosinophilia decreased during the observed pe- riod (both p for trend <0.001) (Figure 3B). After adjusting for age, annual prevalence of eosinophilia decreased (in males:
OR, 0.942; 95% CI, 0.924–0.960; p<0.001; in females: OR, 0.941;
95% CI, 0.909–0.974; p=0.001). In subjects with eosinophilia,
Table 1. Demographic and laboratory data of subjects with and without eosinophilia
No eosinophilia (n=46,965, 96.0%) Eosinophilia (n=1,963, 4.0%) p-value p-value*
Male 26,135 (55.7) 1,507 (76.8) <0.001 -
Age, yr 48±12 49±12 <0.001 -
Body mass index, kg/m
223.5±3.3 24.4±3.3 <0.001 <0.001
WBC, /µL 5,726.9±1,593.2 7,105.7±1,756.5 <0.001 <0.001
BUN, mg/dL 13.2±3.6 13.5±3.5 <0.001 0.288
Creatinine, mg/dL 0.9±0.2 1.0±0.2 <0.001 0.544
AST, IU/L 24.9±15.6 26.7±18.2 <0.001 <0.001
ALT, IU/L 25.4±25.3 29.6±26.5 <0.001 0.007
FEV
1/FVC, % 83.6±7.3 82.1±7.3 <0.001 <0.001
FEV
1predicted, % 101.5±13.4 99.1±13.9 <0.001 <0.001
FVC predicted, % 92.9±12.8 92.0±12.1 0.012 0.003
Values are presented as number (%) or mean±SD.
*After adjusting for age and sex.
WBC: white blood cell; BUN: blood urea nitrogen; AST: aspartate aminotransferase; ALT: alanine aminotransferase; FEV
1: forced expiratory
volume at one second; FVC: forced vital capacity.
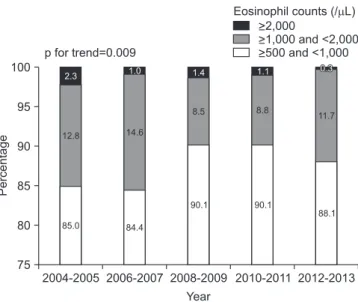
the proportion of subjects with eosinophil count ≥2,000/µL decreased and that with eosinophil count ≥500 but <2,000/
µL increased during the observed period (p for trend=0.009) (Figure 4).
4. Parasitic infections and eosinophilia
Stool exam for parasite egg was performed for 30,109 non- eosinophilic subjects (test performance rate, 64.2%) and 1,285 eosinophilic subjects (test performance rate, 65.5%).
Positive rate was 0.00% (9 of 30,109) in non-eosinophilic sub- jects and 0.1% (1 of 1,285) in eosinophilic subjects (p=0.342).
In addition, enzyme-linked immunosorbent assay (ELISA)
tests for four most common parasites (Clonorchis sinensis, Paragonimus westermani, Cysticercus, and Sparganum) were performed for 353 subjects (295 tests in 46,965 non-eosin- ophilic subjects and 58 tests in 1,963 eosinophilic subjects).
Among total patients, only 32 patients (20 non-eosinophilic subjects and 12 eosinophilic subjects) were positive based on ELISA. Of these 32 ELISA positive patients, 24 (75.0%) were males. They had mild eosinophilia (mean eosinophil count, 659.93±972.67). Their mean age was 54.66±10.74 years. Of these 32 ELISA positive cases, nine (28.1%) were positive for C.
sinensis, seven (21.9%) were positive for P. westermani, seven (21.9%) were positive for Cysticercus, and nine (28.1%) were positive for Sparganum. In the total population, the positiv-
Male Female 7
6 5 4 3 2 1 0 Prevalenceofeosinophilia(%)
A
<30 30-39 40-49 50-59
Age (yr)
>60 p for trend <0.001
7 6 5 4 3 2 1 0
Prevalenceofeosinophilia(%)
B
<30 30-39 40-49 50-59
Age (yr)
>60 p for trend in male <0.001
p for trend in female=0.255
2.9
3.6
4.1
4.7
4.1 4.1
1.8 4.8
2.2 5.4
2 5.7
2.1 6.6
2.6
Figure 2. The prevalence of eosinophilia according to age and sex. (A) The prevalence of eosinophilia according to age. The prevalence of eosinophilia increased with advancing age (p<0.001). (B) The increasing trend in the prevalence of eosinophilia was significant only in male subjects.
p for trend in male <0.001 p for trend in female <0.001 8
6 5 4 3 2 1 0 Prevalenceofeosinophilia(%)
A
2004 2005 2006 2007 2008 2009 2010 2011 2012 2013 Year
p for trend <0.001
5.0 5.0 5.0
4.5 4.8
4.6
2.8 3.1 3.3 3.4
7
8
6 5 4 3 2 1 0
Prevalenceofeosinophilia(%)
B
2004 2005 2006 2007 2008 2009 2010 2011 2012 2013 Year
7
Male Female 7.4
2.3 6.4
2.9 5.8
2.9 6.3
2.7 7.1
2.5 6.4
2.2 4.1
1.2 4
1.9 4.4
1.8 4.7
1.9
Figure 3. Annual prevalence of eosinophilia from 2004 to 2013. (A) In all subjects. (B) In males and females. p-value was adjusted for age and
sex.
ity rate of parasite based on ELISA gradually increased with advancing age: 0% in the 20s; 4% in the 30s; 4.5% in the 40s;
11.9% in the 50s; and 15.8% in the 60s (p=0.002). The rate of eosinophilia also gradually increased with advancing age: 0%
in the 20s; 25% in the 30s; 14.3% in the 40s; 20.8% in the 50s;
and 63.6% in the 60s (p=0.039).
5. Radiologic findings and eosinophilia
Of 46,928 subjects, a total of 9,893 subjects (20.2%) with- out eosinophilia and 504 subjects (1.0%) with eosinophilia underwent chest CT. Their radiologic findings were assessed regarding the presence of nodules, consolidation, and ground glass opacities on chest CT. Among them, consolidation (OR, 1.99; 95% CI, 1.27–3.12; p=0.003) and ground glass opacities (OR, 2.34; 95% CI, 1.45–3.77; p<0.001) were more frequently found in subjects with eosinophilia compared to those with- out eosinophilia. In addition, subjects with eosinophilia were
more likely to have suspicion of pulmonary infiltrate with eo- sinophilia (OR, 12.32; 95% CI, 5.70–26.62; p<0.001) (Table 2).
When eosinophil was classified based on severity, statistically significant correlation between the severity of eosinophilia and radiologic abnormalities was found (Figure 5).
Discussion
In the present study, the prevalence of eosinophilia was evaluated using 10 years of data from a health promotion cen- ter of a tertiary hospital. The prevalence of eosinophilia was 4.0%. Eosinophilic subjects were older and male-predominant.
Eosinophilia was mild in most cases. Subjects with eosino- philia had higher levels of body mass index, leukocyte count, and liver enzyme but lower lung function than those without eosinophilia. The prevalence of eosinophilia increased with advancing age. Interestingly, this relationship was valid only
Table 2. Radiologic manifestation on low dose chest computed tomography according to presence or absence of eosinophilia No. (%)
p-value p-value* OR (95% CI)
No eosinophilia (n=9,389, 20.0%)
Eosinophilia (n=504, 25.7%) Radiologic findings
Nodules 1,021 (10.9) 60 (11.9) 0.470 0.363 1.14 (0.86–1.51)
Consolidation 223 (2.4) 22 (4.4) 0.005 0.003 1.99 (1.27–3.12)
Ground glass opacity 170 (1.8) 20 (4.0) 0.001 <0.001 2.34 (1.45–3.77)
Suspicion of PIE 18 (0.2) 11 (2.2) <0.001 <0.001 12.323 (5.70–26.62)
*Values are adjusted for sex and age.
OR: odds ratio; CI: confidence interval; PIE: pulmonary infiltration with eosinophilia.
Figure 4. Changes in the distribution of severity of eosinophilia over time. The proportion of eosinophil count ≥2,000/µL decreased be- tween 2004 and 2013.
100
95
90
85
80
75
Percentage
2004-2005 2006-2007 2008-2009 2010-2011 2012-2013 Year
p for trend=0.009 2.3
12.8
85.0
>2,000
>1,000 and <2,000
>500 and <1,000 Eosinophil counts (/ L)
1.0
14.6
84.4
1.4
8.5
90.1
1.1
8.8
90.1
0.3 0.3
11.7
88.1
14 12 10 8 6 4 2 0
Radiologicabnormalities(%)
Nodules Pneumonic infiltrations
Ground glass opacity
Suspicion of PIE p=0.019
p=0.001 p<0.001 0-500
501-1,500
>1,500
Eosinophil counts (/ L)