Korean J Environ Agric (2011) Online ISSN: 2233-4173 Vol. 30, No. 3, pp. 323-329 http://dx.doi.org/10.5338/KJEA.2011.30.3.323 Print ISSN: 1225-3537
Simultaneous Analysis of Conazole Fungicides in Garlic by Q-TOF Mass Spectrometer Coupled with a Modified QuEChERS
Method
Min Sun Bong,
1Si Young Yang,
1Seung Ho Lee,
1Jung Mi Seo
2and In Seon Kim
1*1Department of Agricultural Chemistry, Institute of Environmentally-friendly Agriculture, College of Agriculture and Life Sciences, Chonnam National University, Gwangju 500-757, Republic of Korea,
2Gwangju Advanced Institute of Health and Environment, Gwangju 502-240, Republic of Korea
Received: 07 September 2011 / Accepted: 23 September 2011
ⓒ 2011 The Korean Society of Environmental Agriculture
*교신저자(Corresponding author),
Phone: +82-62-530-2131; Fax: +82-62-530-2139;
E-mail: [email protected]
323
Abstract
BACKGROUND: The conazoles, difenoconazole, dinicona- zole, hexaconazole, penconazole and tetraconazole are a large class of synthetic fungicides used extensively for foliage and seed treatments in agricultural crops. The extensive use of conazoles has brought concerns on the potentiality of environmental contamination and toxicity. Thus studies on the development of methods for monitoring the conazoles are required.
METHODS AND RESULTS: A modified quick, easy, effective, rugged and safe (QuEChERS) method was involved in sample preparation. Quadrapole time of flight mass spectrometer (Q-TOF MS) in electron spray ionization (ESI) mode was employed to determine conazoles in garlic samples. The limit of detection (LOD) and limit of quantification (LOQ) of conazoles by Q-TOF-MS ranged from 0.001 to 0.002 mg/L and 0.002 to 0.005 mg/L, respectively. Q-TOF-MS analysis exhibited less than 2.6 ppm error of accurate mass measurements for the detection of conazoles spiked at 0.05 mg/L in garlic matrix. Recovery values of conazoles fortified in garlic samples at 0.02, 0.05 and 0.1 mg/L were between 79.2 and 106.2% with a maximum 11.8% of standard deviation. No
detectable conazoles were found in the domestic market samples by using the Q-TOF-MS method.
CONCLUSION(s): High degree of confirmation for conazoles by accurate mass measurements demonstrated that Q-TOF-MS analysis combined with a QuEChERS method may be applicable to simultaneous determination of conazoles in garlic samples.
Key Words: Conazoles, Pesticide analysis, Q-TOF-MS, QuEChERS
Introduction
Conazoles are a group of commercial fungicides widely used for agricultural applications against seed and foliage pathogens in vegetables such as garlic, pepper, tomato and cucumber. Their fungicidal activities are from the inhibition of the synthesis of ergosterol, a precursor for the synthesis of fungal cell membranes, by inhibiting the activity of lanosterol 14α-demethylase.
A number of studies have demonstrated the potential risks of conazoles in relation to mutagenicity, endocrine disrupting effects, cellular toxicity and bioaccumulation (Konwick et al ., 2006; Tully et al ., 2006; Ross et al ., 2009;
Kjærstad et al ., 2010). Thus monitoring the conazoles in agricultural products is an important issue in order to avoid risks to consumers.
Gas liquid chromatography (GLC) equipped with
electron capture detector or nitrogen selective detector is a typical method generally used for the determination of conazole fungicides (Wood et al ., 1986; Harris et al ., 1989; Rege et al ., 1992). High performance liquid chromatography (HPLC) has been introduced as a method for the determination of conazole fungicides in variable samples (Woestenborghs et al ., 1987;
Warnock et al ., 1988; Darouiche et al ., 1995). Mass spectrometry analysis using HPLC quadrupole- time-of-flight (LC-Q- TOF) has also been introduced as a sensitive method for the detection of the pesticides (Lacina et al ., 2010; Pareja et al ., 2011).
Among them LC-Q-TOF-MS is known to be the most powerful approach to the field of pesticide analysis as it increases the selectivity and avoids false positive findings (Petrovic and Barcelo, 2006). Q-TOF-MS is characterized with a highly reliable separation technic between multiple targets (Ferrerand Thurman, 2007;
Gilbert-López et al ., 2010), since it provides mass accuracies with an error in the range of 1 to 2 ppm (Wolff et al ., 2001; Stroh et al ., 2007).
Considering that the world trade activity of agricultural products has increased year by year between the nations, monitoring pesticides in a variety of agricultural product requires more simple and easy process for sample preparation before analyzed. The quick, easy, effective, rugged and safe (QuEChERS) method is a typical example useful for multi-residue pesticide analysis in vegetables and fruits (Anastassiades et al ., 2003). This method involves micro-scale extraction using a small amount of organic solvent such as acetonitrile followed by purifying the extract using dispersive solid phase extraction (SPE). A number of studies have demonstrated the advantages of QuEChERS method in the analytical scope (Lehotay et al ., 2010; Wilkowska and Biziuk, 2011). QuEChERS avoids producing considerable amount of solvent wastes and consuming time and labor that are generally received in conventional methods (Gilbert-López et al ., 2009).
In the present study, we examined simultaneous determination of conazoles, being used worldwide for the control of fungal pathogens in garlic, by Q-TOF-MS with combination of a modified QuEChERS method for the sample preparation.
Materials and Methods
Chemicals and Solvents
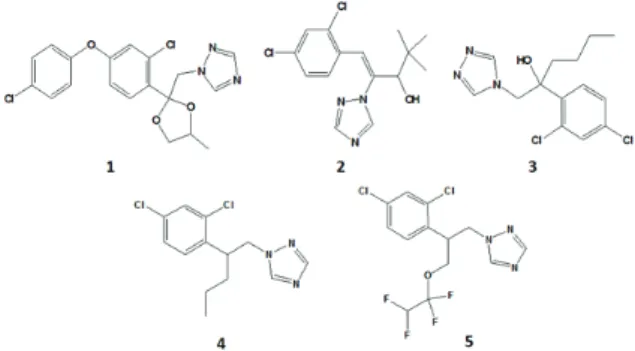
Conazoles, such as difenoconazole, diniconazole,
hexaconazole, penconazole and tetraconazole (Fig. 1), were purchased from Dr. Ehrenstorfer (Ausburg, Germany). Solvents used in this study are HPLC grade obtained from Fisher Scientific (Pittsburgh, PA, USA). All other chemicals were of analytical grade obtained from Merck (Darmstadt, Germany), unless otherwise stated. The reagents for QuEChERS method were obtained from commercial suppliers.
Mass Spectrometry
Q-TOF MS was a Bruker Daltonics micro-TOF mass spectrometer connected with a Dionex model P680 HPLC equipped with a Dionex model PDA-100 photodiode array detector. The HPLC column was a Waters SunFire C-18 stainless steel column (2.1 x 50 mm, 5 μm thickness). The mobile phase consisted of acetonitrile and ultra-pure water containing 0.1%
(v/v) formic acid at a flow rate of 0.2 mL/min. The HPLC system was interfaced to Q-TOF-MS equipped with electrospray ionization (ESI) interface in positive ion mode. A capillary voltage and collision energy were 4.5 kV and 7eV, respectively. The sample was dried under N
2gas at a rate of 8.0 mL/min and 210
oC. Hexapole and Collision RF values were 200 V and 100 V, respectively. The data for accurate mass spectra were acquired in the range of 50-800 m/z at a rate of one second per spectrum. TOF-MS analyzer was calibrated with a sodium formate solution consisting of a mixture of 10 mM sodium hydroxide in isopropanol and 0.2% (v/v) formic acid at a ratio
Fig. 1. Chemical structures of the conazoles tested in this study. 1. Difenoconazole; 2. Diniconazole; 3. Hexa- conazole; 4. Penconazole; 5. Tetraconazole.
of 1:1 (v/v), as described previously (Ren et al ., 2008).
The calibration mixture was injected at the beginning
and end of each run via a six-port-divert valve
equipped with a 100 μL sample loop. The exact masses
of the calibration ions were calculated by using the
Bruker Data Analysis version 3.4 software as follows:
(M+H)
+Na(NaCOOH)
2m/z 158.9641, Na(NaCOOH)
3m/z 226.9515, Na(NaCOOH)
4m/z 294.9389, Na(NaCOOH)
5m/z 362.9263, Na(NaCOOH)
6m/z 430.9138, Na(NaCOOH)
7m/z 498.9012, Na(NaCOOH)
8m/z 566.8886, Na(NaCOOH)
9m/z 634.8760, Na (NaCOOH)
10m/z 702.8635, Na(NaCOOH)
11m/z 770.8509. The conazoles were detected in a mode of extraction ion chromatogram on the basis of molecular ions as follows: (M+H)
+, difenoconazole m/z 406, diniconazole m/z 326, hexaconazole m/z 314, penconazole m/z 284, tetraconazole m/z 372.
Sample Preparation
Sample preparation was performed by a method modified from the QuEChERS method described in the previous studies (Lehotay et al ., 2010; Wilkowska and Biziuk, 2011). For this, a 5 g-portion of the homogenized garlic samples were weighed in 50 mL-PTFE centrifuge tube containing 15 mL acetonitrile and 1% (v/v) acetic acid. The tube was then shaken vigorously for 1 min and added 6 g anhydrous magnesium sulfate (MgSO
4) and 1.5 g sodium acetate (NaOAC). The tube was shaken for 1 min to prevent coagulation of MgSO
4and centrifuged at 3,000 rpm for 5 min. A 6 mL-aliquot of the supernatant was transferred into a new tube containing 900 mg anhydrous MgSO
4and 300 mg Varian Bulk Bondesil
TMPSA. The tube was finally shaken for 1 min and centrifuged at 3,000 rpm for 5 min. A 1 mL-aliquot of the supernatant was subjected to instrumental analysis.
Method validation, Detection sensitivity and Recovery tests
The calibration was evaluated with working solutions in a range of 0.001 to 0.2 mg/L which had been diluted from 100 mg/L stock solutions. A 20 μL -aliquot of the working solutions prepared in triplicate was injected onto Q-TOF-MS and their linear regression was calculated on the basis of peak area. The matrix effects of the sample extracts on the response of Q-TOF-MS were examined by calculating
the linear regression of conazole standards added in the control samples at the range above.
Limit of detection (LOD) and limit of quantitation (LOQ) were determined at a signal-to-noise (S/N) ratio of 3:1 and 10:1, respectively, by injecting a series of the working solutions in triplicate. The accuracy of mass detection by Q-TOF-MS determined by injecting three preparations of conazoles added to the control samples at a level of 0.05 mg/L, calculating the relative standard deviation.
Recovery tests were carried out by determining conazoles fortified in the control garlics at the levels of 0.02, 0.05, 0.1 mg/L, which is in the range of maximum residue limits (MRL), regulated by Korea Food Drug Administration (KFDA), of conazoles in garlic. All experiments were performed in triplicate, unless otherwise stated.
Results and Discussion
The calibration of each conazole spiked in the garlic matrix at a range of 0.001 to 0.02 mg/L was shown in Table 1. Good linearity of the calibration curves was observed, exhibiting correlation coefficients higher than 0.99. In order to examine the effects of the sample matrix on the response of Q-TOF-MS, the slopes obtained from the calibration of each conazole in the matrix were compared to those obtained from the calibration in the solvent. The slope factors were determined by calculating slope ratios of matrix to solvent for each conazole. The highest signal suppression by the matrix was observed in difeno- conazole, giving about 12% suppression. Negligible signal suppression was observed in diniconazole and tetraconazole, exhibiting 1.04 and 1.01, respectively.
All conazoles tested showed the signal suppression
lower than 15%. The LOD and LOQ of conazoles
ranged from 0.001 to 0.002 mg/L and 0.002 to 0.005
mg/L, respectively. Good calibration linearity and
low LOD and LOQ values suggest that Q-TOF-MS be
an excellent approach for determining conazoles in
garlic samples.
Pesticide Concentration (mg/kg) Linearity (
R
2) Slope factor* LOD (mg/kg) LOQ (mg/kg)Difenconazole 0.001 - 0.02 0.999 0.88 0.001 0.002
Diniconazole 0.001 - 0.02 0.999 1.04 0.001 0.002
Hexaconazole 0.001 - 0.02 0.999 0.93 0.002 0.005
Penconazole 0.001 - 0.02 0.999 0.94 0.002 0.005
Tetraconazole 0.001 - 0.02 0.999 1.01 0.002 0.005
* The values were determined by: slope in matrix/slope in solvent.
Table 1. Calibration data, correlation coefficients, LODs and LOQs of the mixture of conazole standards spiked in the garlic samples
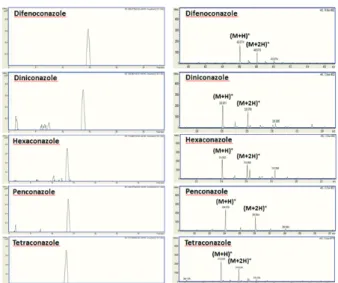
The mass accuracies of conazoles were determined by analyzing the extracted ion chromatogram (XIC) from the total ion chromatogram (TIC). The accurate mass of the protonated molecule was used for confirmation of each conazole spiked in the sample matrix at 0.05 mg/L. The experimental masses determined by Q-TOF-MS were compared to the exact empirical masses. No significant differences were observed in the experimental mass obtained from the matrix-matched protonated molecule compared to the exact empirical mass, representing the resolution of
15,000 and the mass accuracy values better than 2.6 ppm of error for all the conazoles (Table 2). The accurate masses were characterized by elemental isotopes analysis. All conazoles showed their characteristic isotopic signals between
35Cl and
37Cl, exhibiting (M+2H)
+peak with a relative intensity of about two-thirds of the molecular ion peak (Fig. 2).
The mass differences of the experimental ions between
35
Cl and
37Cl ranged from 1.996 to 2.002, which is very close to the mass difference (1.997) of the empirical ions between
35Cl (34.9689) and
37Cl (36.9659).
Pesticide Selected ion Empirical formula Theoretical m/z Experimental m/z Error
mDa ppm
Difenconazole (M+H)+ C19H18Cl2N3O3 406.0720 406.0714 0.6 1.5
Diniconazole (M+H)+ C15H18Cl2N3O 326.0821 326.0813 0.9 2.6
Hexaconazole (M+H)+ C14H18Cl2N3O 314.0821 314.0825 0.3 1.0
Penconazole (M+H)+ C13H16Cl2N3 284.0716 284.0715 0.4 1.5
Tetraconazole (M+H)+ C13H12Cl2F4N3O 372.0288 372.0289 0.1 0.3 Table 2. LC-TOF-MS accurate mass determinants of the mixture of conazole standards spiked in garlic matrices
Pesticide
Recovery value (%)* Fortified level (mg/kg)
0.02 0.05 0.1
Difenconazole 97.5±11.8 112.7±7 97.3±8.1
Diniconazole 106.2±7.4 102.1±9.7 102.7±6.0
Hexaconazole 104.2±11.0 103.4±6.3 104.1±2.3
Penconazole 92.7±5.7 94.2±4.9 104.8±5.8
Tetraconazole 79.2±9.8 84.8±2.0 88.7±5.9
*The data are means ± SD of three determinants.
Table 3. Recovery of the mixture of conazole standards fortified in the blank garlics
Fig. 2. XIC and mass spectra of conazoles spiked in the garlic matrix at 0.05 mg/L.
Recovery tests were carried out in the garlic samples fortified with the mixture of conazole standards at 0.02, 0.05 and 0.1 mg/L. The mean recovery values in the samples fortified at 0.02 mg/L ranged from about 79% to 106% with relative standard deviation (RSD) less than 12%. The values ranged from about 85% to 113% with RSD less than 10% in the samples fortified at 0.05 mg/L, while the values in the samples fortified at 0.1 mg/L ranged from about 88% to 105% with RSD less than about 8%. The highest recovery was found in difenoconazole, while lowest was found in tetraconazole. No significant difference in recovery values was observed between the test levels, suggesting that Q-TOF-MS be a reliable approach to determining the conazoles in garlic.
Figure 3 shows the XIC of the sample fortified with the mixture of conazoles at 0.05 mg/L. The XIC was obtained by subtracting that of the control sample. The control samples were found not to contain the tested conazoles. Difenoconazole and tetraconazole showed a significant difference retention times between them, while other conazoles showed a poor separation between them, exhibiting similar retention times. However, it was no problem to quantitatively determine the conazoles in the samples, since the mass accurate of the XIC enabled the selective detection.
The Q-TOF-MS was examined for determining conazoles in market real samples. No detectable conazoles were found in the samples. However, we were able to accidently detect a conazole in the market samples by Q-TOF-MS (Fig. 4). It was determined to be a compound with molecular formula C
16H
25ClN
3O. The
mass spectrum was characterized by (M+2H)
+peak with a relative intensity of about 20-30% of the molecular ion peak, which is a typical ion peak with one chlorine. The elemental analysis by TOF software indicated tebuconazole as the best candidate, which was evidenced more by molecular mass 308.1532 very close to that of tebuconazole (308.1524), exhibiting only -2.4 ppm of mass accurate error.
Garlic is one of the most important food sources for health benefits in Korea. The beneficial effects of garlic on the health (Stevinson et al ., 2000; Borek 2001) have brought continuous increase in its consumption. The increased garlic consumption is expected to affect the amount of garlic imported from foreign countries.
Fig. 3. XIC and mass spectra of conazoles fortified in the blank garlics at 0.1 mg/L. 1. Difenoconazole; 2. Diniconazole;
3. Hexaconazole; 4. Penconazole; 5. Tetraconazole.
Fig. 4. XIC (A) and mass spectrum (B) of a compound detected in a market real sample.