Print ISSN: 2288-4637 / Online ISSN 2288-4645 doi:10.13106/jafeb.2020.vol7.no11.1033
Analysing Productivity Change in Vietnamese Garment Industry Using Global Malmquist Index
Thanh Khac MAI
1, Van NGUYEN
2, Trang Huyen Thi VU
3Received: August 01, 2020 Revised: September 30, 2020 Accepted: October 15, 2020
Abstract
Vietnam is conducting an export-led growth model and labour-intensive industries contributing majorly to the total export value. In the context of Industry 4.0, the labour-based industries are significantly affected; hence, enhancing productivity is the key measure to maintain these industries. The garment industry contributes significantly to the total export value of Vietnam. Based on meta-frontier framework, the approach of data envelopment analysis is used to measure technical efficiency of Vietnamese garment firms and the global Malmquist TFP index is utilised to identify productivity change and its components including efficiency, technology and technical gaps between different groups of firms. The data of Vietnamese garment firms from 2013 to 2018 collected from the Vietnam General Statistic Office is used in this study. The results show that: (i) The total factor productivity of Vietnamese garment firms growth, technical progress is the main contributor; (ii) The private garment sector is the leading group; (iii) There is a large technological gap among Vietnamese garment sectors. The private and FDI garment firms have experienced a growth in all components of total factor productivity change. Meanwhile, technological progress change is the main reason to constrain the productivity growth of state-owned garment firms.
Keywords: Data Envelopment Analysis, Global Malmquist Total Factor Productivity Index, Meta-Frontier, Technical Efficiency JEL Classification Code: C6, D24, O14, O47
intensive industries are the most beneficial (Nguyen et al., 2019; Le et al, 2020).
However, these industries face a number of challenges.
The first challenge is from the Industrial Revolution 4.0 in which labourers are possibly replaced by machines and equipment. Consequently, temporary labour-intensive industries will become automatic and require only a small number of labourers. The second is from the competitors in other Asian countries including India, and Bangladesh (Tran, 2012). These countries have also intensified their global connection and have more abundant and cheaper labour forces. To solve these problems and remain competitive, the key solution for Vietnam is to continuously improve the productivity in labour-incentive areas before replacing these low-tech industries by high- tech industries.
Textile and garment are the most important labour- intensive industries in Vietnam by mainly contributing to the country’s export and economic growth over the last three decades. According to the statistics data of the Vietnam Textile and Garment Association, the average growth rate of export value in the last 5 years stands at 14.74% per
1. Introduction
In recent years, Vietnam has accelerated its integration into the world economy by signing new free trade agreements (FTAs), such as Comprehensive and Progressive Agreement for Trans-Pacific Partnership (CPTPP), Vietnam- Europe Union FTA, Vietnam-South Korean FTA, Vietnam- ASEAN FTA (Nguyen et al, 2020). This strategy advocates the export-led growth model of Vietnam whereas labour-
1
First Author. Vine Dean, Faculty of Management and Finance, Vietnam Maritime University, Vietnam.
Email: [email protected]
2
Corresponding Author. Lecturer, Faculty of Fundamental Science, Vietnam Maritime University, Vietnam [Postal Address: 484 Lach Tray Street, Le Chan District, Haiphong, 180000, Vietnam]
Email: [email protected]
3
Lecturer, Department of Mathematics, Thuongmai University, Vietnam. Email: [email protected]
© Copyright: The Author(s)
This is an Open Access article distributed under the terms of the Creative Commons Attribution
Non-Commercial License (https://creativecommons.org/licenses/by-nc/4.0/) which permits
unrestricted non-commercial use, distribution, and reproduction in any medium, provided the
original work is properly cited.
year and export turnover in 2018 was 36.2 billion USD, accounting for 16% of Vietnam industrial production value. The textile and garment is the second largest export item of the country following telephone and telephone accessories (Ministry of industry and trade, 2019). Having more than 6,000 large firms and SMEs, the textile and garment industries in Vietnam have created 5% of jobs and accounted for approximately 2.5 million labourers. Vietnam has been ranked at the 4th position among the largest textile and garment exporters in the world (after China, India and Bangladesh) (Tran, 2012).
Although the textile and garment industries play an important role in the development of the economy, the performance of these sectors in recent years has not met their potential. Foreign direct investment (FDI) in textile and garment firms are more advantageous than domestic rivals due to their better production integration and receiving privileges from the policy of foreign investment (Nguyen, 2020). FDI in textile and garment industry firms accounts for less than 20% of firms operating in the Vietnamese industry and employs only 4% of the total workforce, still they dominate the total export value from Vietnam at 70%
while both state-owned and private enterprises contribute the minority towards the exports from the country (Ngo and Tarko, 2018). It is widely accepted that state-owned firms face difficulties in governance due to the problem of agency; however, they can access financial and land resources more easily than other firms. Private firms are almost small and medium; as a result, they cannot exploit the scale effectively and are more vulnerable to external shocks.
The above-mentioned issues on the textile and garment firms in Vietnam point out distinctive production conditions of three firm types belonging to different ownerships (FDI, state-owned and private). According to O’Donnell et al., (2008), disparities in the characteristics of the physical, social and economic environment in which production takes place can result in different technology sets, which are the feasible input–output combinations faced by firms in several industries, regions and/or countries. In order to overcome these drawbacks, this study will analyse efficiency and productivity of Vietnamese garment firms by using the meta-frontier approach and the global Malmquist total factor productivity (TFP) index. Each type of garment firms (state- owned, private and FDI) are considered to have a different production set (technology). Accordingly, productivity change and its components including efficiency change, technical change and technological gap of Vietnamese garment firms are estimated.
Using the meta-frontier approach and the data of the garment industry in Vietnam from 2013-2018, the study shows that the productivity of Vietnamese garment industry has grown and this growth is due to technical progress. The
private firms with the most advanced technology are leading the garment industry and contribute mainly to this industry’s growth.
The structure of the paper is as follows. Section 2 presents a methodology of meta-frontier and Data Envelopment Analysis. Section 3 describes the data and specifies inputs/
outputs. An analysis of the empirical results is given in Section 4. Finally Section 5 concludes and highlights the key findings.
2. Methodology
The concept of meta-frontier was proposed by Hayami (1969), Hayami and Ruttan (1970). Since then, Battese et al (2002; 2004) have developed a meta-frontier approach to estimate technical efficiency, technical change and total factor productivity change. The meta-frontier approach can be applied in both data envelopment analysis (DEA) and stochastic frontier analysis (SFA) frameworks.
Up to now, not only Vietnam but also many other countries in the world have studied in different economic sectors using the DEA approach to estimate meta-frontier.
For example, Rao et al (2003), O’Donnell et al (2008) used the DEA approach to analyse differences in agricultural productivity of 97 countries in Asia, Europe, America and Africa. Alexandra and Kostas (2010) studied about the effectiveness of cooperative banking in Europe. Wang et al (2013) analysed energy efficiency among provinces in China. Quan (2011) used the DEA approach and meta- technology ratio (MTR) to estimate the technical efficiency of three rice monocultures and two crop rotations in Tra Vinh province. Ho (2016) studied technical efficiency, factor productivity and technological gap between agricultural areas of Vietnam, etc. Figure 1 below presents a definition of technical efficiencies in meta-frontier and group frontiers.
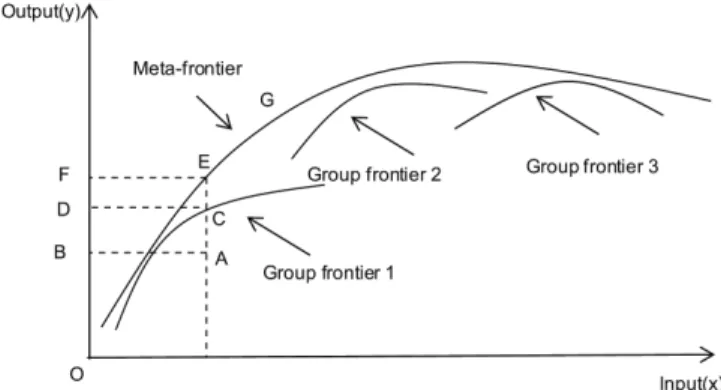
Figure 1: Technical efficiency and technology gap ratio in meta-frontier framework
Note: Adapted from O’Donnell, C.J., Rao, D.S.P.
& Battese, G.E. (2008)
Let’s consider firm A in the group 1, there are two measures of technical efficiency that can be derived. Firstly, technical efficiency with respect to meta-frontier. It is defined by using concept of output oriented distance function and using meta-frontier:
TE(x,q) = D
o(x,q) = OB/OF (1) Secondly, using the group frontier to define technical efficiency.
TE
k(x,q) = D
ko(x,q) = OB/OD (2) Where TE(x,q) is always less than or equal TE
k(x,q) The Figure 1 shows that there is a gap between meta- frontier and group frontiers, which reflects the backwardness between group technology and meta-technology. This gap is measured by the concept of technology gap ratio (TGR) (Battese et al. 2004).
The output orientated technology gap ratio (TGR) for group k
this defined as:
( , ) ( , ) ( , )
( , ) ( , )
k o
k k
o
D x q TE x q TGR x q
D x q TE x q
= =
(3) The formula (3) can be re-written as:
TE(x, q) = TE
k(x, q).TGR
k(x, q) (4) The formula (4) shows that technical efficiency with respect to meta-frontier consists of two components:
Firstly, the current knowledge of production, natural environment, and socio-economic conditions of each group (TE
k). Secondly, the technology gap of each group over the whole industry (O’Donnell et al. 2008). Oh and Lee (2010) proposed the concept of technology gap change (TGC) to measure the trend of technology gap ratio as:
t 1
t
TGC TGR
TGR
+= (5)
TGC> 1 means the production technology gap of groups is getting closer.
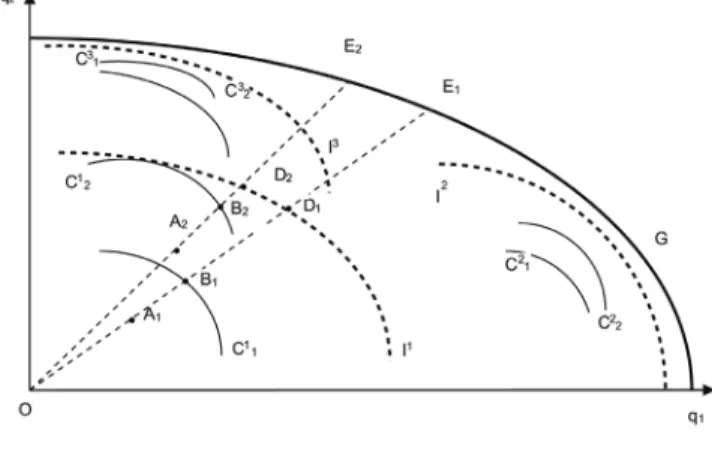
Unlike traditional DEA studies that focus only on efficiency and technological gap at a specific time. The global Malmquist TFP index was proposed by Pastor and Lovell (2005) and developed by Oh and Lee (2010) to measure change in the technical efficiency, technical change and productivity growth. The Figure 2 describes concept of the global Malquist TFP as:
Where C
ijare contemporaneous frontiers of groups at a specific time, I
iare inter-temporal frontiers for groups and there is only one global frontier G.
The common contemporaneous Malmquist TFP index of an observation within group k
this defined at technology of periods t and t+1as:
1 1 1 1
1 1 1
1
( , ) ( , )
( , , , )
( , ) ( , )
t t t t
t t t t t t
C t t t t
t t
D x q D x q M x q x q
D x q D x q
+ + + +
+ + +
+
= ×
(6) Where M
Cis Malmquist TFP index, D
t(.) is the output orientated distance function with respect to frontier of period t. The inter-temporal Malmquist TFP index of an observation for each group is defined as:
1 1
1 1
( , )
( , , , )
( , )
I t t
t t t t
I I t t
D x q M x q x q
D x q
+ +
+ +
= (7)
Where M
Iis an inter-temporal Malmquist TFP index, D
I(.) is output orientated distance function with respect to the inter-temporal frontier of group I.
Following Pastor and Lovell (2005), this index can be decomposed as:
1 1
1 1 1
1 1
1 1
1
( , )
( , , , )
( , )
( , )
( , )
( , ) ( , )
t t
t t t t t
I t t
t
t t
I t t
t t tI t t
t
D x q M x q x q
D x q
D x q D x q
D x q D x q
+ +
+ + +
+ +
+ +
+
=
× ×
(8)
Figure 2: The concepts of the meta-frontier Malmquist indexes
Note: Adapted from Oh, D.H. & Lee, J.D. (2010)
Due to D
t+1(x
t+1, q
t+1) / D
t(x
t, q
t) = TE
t+1/ TE
t= TEC, the first component in the formula (8) measures technical efficiency change. D
I(x, q) / D (x, q) is Best Practice Gap (BPG) as constructed by Pastor and Lovell (2005) and Oh and Lee (2010). BPG is ratio of output orientated distance function with respect to inter-temporal frontier over output orientated distance function with respect to contemporaneous frontier and takes the value in [0;1]
1
1 1
1
1 1
( , ) ; ( , )
( , ) ( , )
t t
I t t I t t
t t
t t t t
D x q D x q
BPG BPG
D x q D x q
++ +
+
+ +
= = (9)
BPG
t+1> BPG
tdescribes technological improvements from period t to period t + 1.
We will use this to describe the concept of Best Practice Gap Change (BPC). BPC that measures technical change is defined in the global Malmquist TFP index framework in the flowing way:
1
1
1 1
1 1
1 1
1 1
( , ) / ( , )
( , ) ( , )
( , )
( , )
( , ) ( , )
t t
t t
I t t I t t
t t t t
t t
I t t
t t I t t
D x q D x q BPC D x q D x q D x q D x q
D x q D x q
+
+
+ +
+ +
+ +
+ +
=
= × (10)
In summary, inter-temporal Malmquist TFP index can be defined as:
M x q x q
I( , ,
t t t+1,
t+1) = TEC BPC × (11) Following Oh and Lee (2010), because output orientated distance function is homogeneous of degree one in output, each λ ϵ ℝ then λD(x, q) = D(x, λq). Therefore, the formula (11) can be re-written as:
(
1,
1/
1(
1,
1))
( , / ( , ))
t t
I t t t t
I t t t t
D x q D x q BPC D x q D x q
+
+ + + +
= (12)
Similarly, the global Malmquist TFP index is constructed as:
1 1
1 1
( , )
( , , , )
( , )
G t t
t t t t
G G t t
D x q M x q x q
D x q
+ +
+ +
= (13)
Where D
G(x
t, q
t) is the output orientated distance function with respect to the meta-frontier. Because there is only a meta-frontier in period t to t+1, the formula (13) is not in the geometric mean form. We can decompose M
Ginto the following components:
1 1
1 1
1 1
( , , , )
( , ) ( , )
( , ) ( , )
t t t t
G
I t t G t t
I t t G t t
M x q x q TEC BPC D x q D x q D x q D x q
+ +
+ +
+ +
= ×
× ×
(14)
According to the concept of technology gap ratio has been introduced above we have:
1
1 1
1 1
( , ) ;
( , )
t
G t t
I t t
D x q TGR
+D x q
+ +
+ +
= ( , ) ;
( , )
t
G t t
I t t
D x q TGR = D x q
t t, 1 t1
t
TGC TGR
TGR
+
+
= (15)
Therefore, the formula (14) can be re-written as:
M x q x q
G( , ,
t t t+1,
t+1) = TEC BPC TGC × × (16) This formula implies that the following steps can be implemented to increase total factor productivity: Effective exploitation of existing production resources; Technological improvements within groups; Improvement the technology of industry.
Because output orientated distance function is homogeneous, (14) can be re-written as:
1
1
1 1
1 1
1 1 1 1
1 1 1 1
( , )
( , , , )
( , )
( , / ( , ))
( , / ( , ))
( , / ( , ))
( , / ( , ))
t t
t t
t t
t t t t
G t t
I t t t t
I t t t t
G t t I t t
G t t I t t
D x q M x q x q
D x q D x q D x q
D x q D x q D x q D x q
D x q D x q
+
+
+ +
+ +
+ + + +
+ + + +