The ability to differentiate viable from non-viable myocardium is clinically im-
Evaluation of Reperfused Myocardial Infarction by Low-Dose Multidetector Computed Tomography
Using Prospective Electrocardiography (ECG)- Triggering: Comparison with Magnetic
Resonance Imaging
Hye Mi Gweon,
1Sang Jin Kim,
1Tae Hoon Kim,
1Sang Min Lee,
1Yoo Jin Hong,
1Se-Joong Rim,
2Bum Ki Hong,
2Phil Ki Min,
2Young Won Yoon,
2and Hyuck Moon Kwon
21Department of Radiology and Research Institute of Radiological Science,
2Department of Cardiology, Gangnam Severance Hospital, Yonsei University College of Medicine, Seoul, Korea.
Purpose: To evaluate the potential of prospective electrocardiography (ECG)- gated 64-slice multidetector computed tomography (MDCT) for evaluation of myocardial enhancement, infarct size, and stent patency after percutaneous coronary intervention (PCI) with stenting in patients with myocardial infarction.
Materials and Methods: Seventeen patients who were admitted with acute myocardial infarction were examined with prospective ECG-gated 64-slice cardiac MDCT and magnetic resonance (MR) imaging after reperfusion using PCI with stenting. Cardiac MDCT was performed with two different phases: arterial and delayed phases. We evaluated the stent patency on the arterial phase, and nonviable myocardium on the delayed phase of computed tomography (CT) image, and they were compared with the results from the delayed MR images.
Results: Total mean radiation dose was 7.7 ± 0.5 mSv on the two phases of CT images. All patients except one showed good patency of the stent at the culprit lesion on the arterial phase CT images. All patients had hyperenhanced area on the delayed phase CT images, which correlated well with those on the delayed phase MR images, with a mean difference of 1.6% (20 ± 10% vs. 22 ± 10%, r = 0.935, p = 0.10). Delayed MR images had a better contrast-to-noise ratio (CNR) than delayed CT images (27.1 ± 17.8% vs. 4.3 ± 2.1%, p < 0.001). Conclusion:
Prospective ECG-gated 64-slice MDCT provides the potential to evaluate myocardial viability on delayed phase as well as for stent patency on arterial phase with an acceptable radiation dose after PCI with stenting in patients with myo- cardial infarction.
Key Words: Prospective ECG-gated MDCT, magnetic resonance imaging, myo- cardial infarction, delayed enhancement imaging
Received: October 3, 2009 Revised: November 30, 2009 Accepted: December 11, 2009
Corresponding author: Dr. Tae Hoon Kim, Department of Radiology,
Gangnam Severance Hospital, Yonsei University College of Medicine, 712 Eonju-ro, Gangnam-gu, Seoul 135-720, Korea.
Tel: 82-2-2019-3517, Fax: 82-2-3462-5472 E-mail: [email protected]
∙The authors have no financial conflicts of interest.
© Copyright:
Yonsei University College of Medicine 2010 This is an Open Access article distributed under the terms of the Creative Commons Attribution Non- Commercial License (http://creativecommons.org/
licenses/by-nc/3.0) which permits unrestricted non- commercial use, distribution, and reproduction in any medium, provided the original work is properly cited.
INTRODUCTION
portant for determining the therapeutic management of patients with coronary artery disease and also for predict- ing functional recovery in the culprit arterial territory.
1,2Over the past several years, delayed contrast-enhanced magnetic resonance (MR) imaging has been regarded as a clinically validated tool in the assessment of myocardial viability and infarct morphology.
3,4However, MR imaging requires a long acquisition time and has limitations in patients with implantable cardiac defibrillators and biventricular pacing devices.
2Moreover, there are difficulties in evaluating coronary artery disease or stent patency with MRI.
The recent advent of multidetector computed tomography (MDCT) technology has greatly improved spatial and tem- poral solutions, which can provide a potential to assess coro- nary atherosclerosis.
5-7Furthermore, previous studies have demonstrated that delayed contrast-enhanced MDCT me- thods would be a reliable technique to assess the myocardial viability.
8-10However, increasing radiation exposure with additional delayed contrast-enhanced computed tomo- graphy (CT) scans is a major obstacle in assessing the myocardial viability through delayed CT scans combined with arterial CT scans.
More recently, new MDCT imaging protocols have been proposed with prospective ECG-gating, in which radiation is applied only at predefined time points of the cardiac cycle, rather than during the entire cardiac cycle.
11To date, the clinical application of cardiac MDCT with a prospec- tive ECG-gating protocol in the assessment of myocardial viability has not yet been reported. Accordingly, the pur- poses of the present study were to compare prospective ECG-gated 64-slice MDCT with cardiac MR imaging in the assessment of myocardial enhancement and infarct size early after acute reperfused myocardial infarction, and to evaluate the stent patency after percutaneous intervention (PCI) with stenting at the culprit lesion using prospective ECG-gated 64-slice MDCT angiography.
Patients with reperfused myocardial infarction
Seventeen patients who were admitted with acute myocar- dial infarction (MI) were prospectively enrolled in this study (Table 1). MI was diagnosed on the basis of elevated cardiac enzymes, ST-segment elevation on ECG and pre- sence of an angiographically demonstrated partial or com- plete occlusion of the culprit artery. All patients were suc- cessfully treated with percutaneous coronary intervention (PCI) with stenting.
All patients who were treated with PCI with stenting underwent cardiac MDCT for the evaluation of stent pa- tency and myocardial changes at the involved lesions and
cardiac MR imaging to assess the MI. Patients who had an arrhythmia, overt heart failure, impaired renal function, contrast allergy or any other contraindications for MR imaging (metal implants, pacemaker or severe claustro- phobia, etc) were excluded from this study. An explana- tion concerning radiation risks related to CT and risks related to CT and MR contrast media was given to each patient. This study was undertaken after informed consent was obtained from the patient for cardiac MDCT and MR imaging, and the study was approved by the institutional review boards.
CT protocols
Cardiac MDCT was performed using a 64-slice MDCT scanner (Philips Brilliance 64, Philips Medical System, Best, The Netherlands). With the patient in a supine posi- tion, cardiac MDCT was performed in the craniocaudal direction within a single breath-hold at end-inspiratory sus- pension. A β-blocker (40 to 80 mg propranolol hydrochlo- ride; Pranol, Dae Woong, Seoul, Korea) was administered orally one hour before the examination to reduce the heart rate in patients who had a heart rate of more than 70 beats per minute. A total 2.0 mL/kg of iodinated contrast agent (Optiray 350; Tyco healthcare, Kantata, Canada), not exceeding a total of 150 mL, was administered using a two- phase injection protocol on the arterial and delayed phases of the CT images.
Arterial phase CT imaging
We used a prospective ECG-gating protocol that involved a step-and-shoot technique.
11The scanning parameters were as follows: step-and-shoot axial scanning direction, 420- msec gantry rotation time, 120 kV, 210 mAs, 64×0.625- mm slice collimation, and 2 cm table feed per rotation.
Seventy mL of iodinated contrast medium was adminis- tered intravenously at a rate of 5 mL/sec, followed by 40 mL of normal saline at a rate of 4 mL/sec using a power injector (Nemoto; Nemoto Kyorindo, Tokyo, Japan). Imag- ing was performed using a real time bolus tracking techni- que. The scans were started 7 seconds after a trigger thre- shold of 110 HU was reached. An ECG for each patient was recorded simultaneously. The mean heart rate during the scan was 61 beats per minute (BPM) (range, 56 to 67 BPM).
The image reconstruction was performed on the Brilli- ance V2.4.5 (Philips Medical Systems, Veenpluis, The Netherlands). The reconstruction parameters were as fol- lows: a 0.8 mm slice thickness, a 0.45 mm increment, a 512
×512 pixels image matrix, a XCC kernel (a XCD kernel for stent), a 15-22 cm field of view, and the center of the imaging reconstruction window at 75% of the R-R interval.
In order to evaluate the stent patency at the culprit artery, volume rendering technique (VRT) and curved multiplan-
MATERIALS AND METHODS
nar reformation (MPR) with 1-mm thickness were per- formed using the Aquarius Workstation V3.6 (TeraRecon, San Mateo, CA, USA). MPR images with a section thick- ness of 8 mm and without a gap in a 4-chamber view and long- and short-axis orientations of the left ventricle were produced to assess the myocardial perfusion status.
Delayed phase CT imaging
After taking arterial phase scanning, the remaining contrast medium was injected at a rate of 4 mL/sec, followed by 30 mL of normal saline at a rate of 4 mL/sec using a power injector. Delayed phase scans were performed in 7 minutes after the second bolus injection of contrast material. The scanning protocol and image reconstruction for delayed phase images were same as those used at the arterial phase.
MPR images with a section thickness of 8 mm and without a gap in a 4-chamber view and long- and short-axis orien- tations of the left ventricle were produced to assess the myocardial perfusion status.
MR protocols
Cardiac MR imaging was performed with a 1.5T system (Magnetom Avanto; Siemens Medical Solutions, Erlan- gen, Germany). After completion of the perfusion images with a bolus injection of 0.1 mmol/kg gadopentetate dimegl- umine (Magnevist; Schering, Berlin, Germany) at the rate of 4 mL, followed by 20 ml of normal saline at the rate of 4 mL/sec using a power injector (Nemoto; Nemoto Kyo- rindo, Tokyo, Japan), cine images were obtained for the assessment of myocardial contractile function and wall motion (not included for data analysis in this study).
Delayed phase MR imaging
A second bolus of 0.1 mmol/kg of gadopentetate dimeglu- mine was intravenously administered at the rate of 4 mL followed by 20 mL of normal saline at a rate of 4 mL/sec using a power injector. We performed gradient echo se- quences with varying inversion times in order to select the most appropriate inversion time to null the signal from the normal myocardium. Imaging parameters were as follows:
repetition time/echo time, 23.5/1.1 msec; image matrix, 19
×78; flip angle, 25
O; inversion pulse, 180
O; and inversion time, 150-650 msec.
Ten minutes after the administration of a second bolus of gadopentetate dimeglumine (total, 0.2 mmol/kg), delay- ed enhancement images were obtained in a 4-chamber view and long- and short-axis orientations of the left ven- tricle with 8-mm section thickness using inversion reco- very prepared turbo gradient echo sequence. The image parameters were as follows: repetition time/echo time, variable/variable; image matrix 256×156; echo train length, 1; flip angle, 25
O; pixel bandwidth 130 kHz; section
thickness, 8 mm; and inversion time, 180-380 ms.
Data analysis
The image sets were transferred to separate workstations for cardiac MDCT (Aquarius Workstation V3.6; TeraRe- con, San Mateo, CA, USA) and MR (Syngo Numaris/4;
Siemens Medical Solutions, Erlangen, Germany) for anal- ysis. The dose-length product displayed by the CT unit was recorded at the arterial and delayed enhancement phases for each cardiac CT examination. The effective dose was calculated by multiplying the dose-length product by the conversion coefficient (0.017) for the chest and expressed as millisieverts.
12We assessed CT images on the first analysis session and then evaluated MR images in 1 month after evaluation of CT images. On the arterial phase of CT images, the stent patency was evaluated in consensus by two readers. The stent was regarded to be patent if the lumen was filled with contrast material without filling defect and if the distal seg- ment of the vessel was well traced on the CPR images.
Two independent readers then evaluated the values of attenuation or signal intensity and the size of the perfusion deficit or infarct myocardium on the CT and MR images.
We measured the values of CT attenuation and MR signal intensity for each technique by drawing regions of interest of approximately 30 mm
2in areas of hypo- or hyperen- hanced and remote normal myocardium on the arterial and delayed phases of CT images and on the delayed phase of MR images. The mean values measured by two readers were used for evaluation of the contrast-to-noise ratio (CNR) between the infarct and remote normal myocar- dium. The CNR was calculated as the attenuation dif- ference in CT or the signal intensity difference in MR imag- ing between the infarct and remote normal myocardium, divided by the standard deviation of the CT attenuation or MR signal intensity within the remote normal myocard- ium.
The total size of the perfusion defect or infarct, which was expressed as a percentage of the total left ventricular myocardial mass, was evaluated by two observers who were blind to the clinical history on the arterial and delayed phases of CT images and on the delayed phase of MR images. Arterial phase CT images were assessed using pre- defined image display setting: window width, 200 HU;
window level, 100 HU. For delayed enhancement CT, the window level was set at 100 HU, and the width was set at 150 HU.
Statistical analysis
Continuous variables are presented as means ± standard
deviations. The statistical differences for the CNR were
examined using a Student t-test between the arterial and
delayed phases of CT images and between the delayed phase images of CT and those of MR imaging. A Pear- son’s correlation and Bland-Altman analysis
13were per- formed to determine the correlation and limits of agreement for infarct sizes between the arterial and delayed phases of CT images and between the delayed phase images of CT and those of MR imaging. A p value of less than 0.05 was considered significant. SPSS software (version 12.0.1, Statistical Package for the Social Sciences, Chicago, IL, USA) was used for the statistical evaluations. Inter-obser- ver variability (Var) for the infarct size measured by the delayed phase images of CT and MR imaging was assess- ed with two-way random, single-measure intra-class correlation coefficient (ICC).
Radiation dose and stent patency
The mean longitudinal length for prospective gating was 13.1 ± 1.4 cm (range 12.3-15.5 cm) on the arterial phase of CT images and 12.6 ± 0.8 cm (range 12.4-15.5 cm) on the delayed enhanced phase of CT images. Mean patient radiation dose was 3.9 ± 0.5 mSv (range, 3.5-4.6 mSv) on the arterial phase of CT images and 3.8 ± 0.3 mSv (range, 3.6-4.7 mSv) on the delayed enhanced phase of CT images.
Total mean radiation dose was 7.7 ± 0.5 mSv (range, 7.2- 8.5 mSv) on the arterial and delayed enhanced phases of CT images.
A total of 19 stents in 17 patients were evaluated. Of these, 12 had a beam hardening artifact without motion artifact, while 6 had a beam hardening artifact with mild motion artifact that did not limit lumen evaluation (2 in RCA, 3 in LAD, and 1 in LCx) (Figs. 1A-C and 2A-C). One stent demonstrated a severe artifact due to a beam harden- ing artifact and coronary artery motion, which would be an obstacle in evaluating luminal patency (1 in RCA).
Comparison between arterial and delayed phases of cardiac CT imaging
On the arterial phase of CT images, areas of hypoenhan- cement were visualized in 14 of 17 patients. Areas of del- ayed hyperenhancement were observed in all 17 patients on the delayed phase of CT images (Figs. 1D-F and 2D-I).
Mean CT attenuation on the arterial phase of the CT images was 65 ± 19 Hounsfield Units (HU) in infarct myocardium and 104 ± 17 HU in normal myocardium. Mean CT atten- uation on the delayed phase of CT images was 125 ± 23 HU in infarct myocardium and 89 ± 16 HU in normal myocardium. Delayed phase of CT images had a better CNR than arterial phase of CT images (4.3 ± 2.1% vs. 2.3
± 1.7%, p < 0.01) (Table 2).
RESULTS
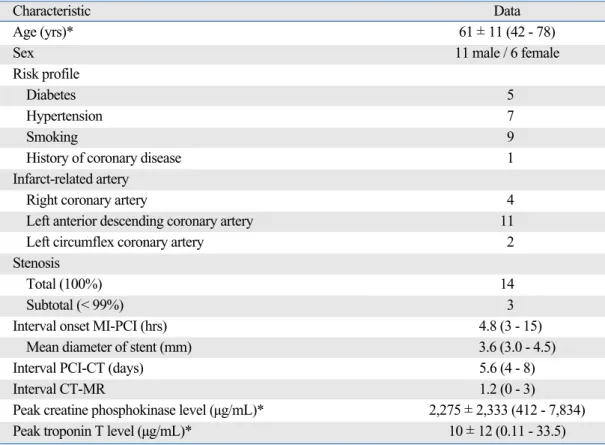
Table 1. Characteristics of 17 Patients with Myocardial Infarction
Characteristic Data
Age (yrs)* 61 ± 11 (42 - 78)
Sex 11 male / 6 female
Risk profile
Diabetes 5
Hypertension 7
Smoking 9
History of coronary disease 1
Infarct-related artery
Right coronary artery 4
Left anterior descending coronary artery 11
Left circumflex coronary artery 2
Stenosis
Total (100%) 14
Subtotal (< 99%) 3
Interval onset MI-PCI (hrs) 4.8 (3 - 15)
Mean diameter of stent (mm) 3.6 (3.0 - 4.5)
Interval PCI-CT (days) 5.6 (4 - 8)
Interval CT-MR 1.2 (0 - 3)
Peak creatine phosphokinase level (µg/mL)* 2,275 ± 2,333 (412 - 7,834)
Peak troponin T level (µg/mL)* 10 ± 12 (0.11 - 33.5)
MI, myocardial infarct; PCI, percutaneous coronary intervention; CT, computed tomography; MR, magnetic resonance.
*Data are means ± standard deviations, with ranges in parentheses.
The mean area of hypoenhanced myocardium was 15 ± 10% (range, 0-34%) on the arterial phase of CT images and the mean area of hyperenhanced myocardium was 20
± 10% (range, 4-38%) on the delayed phase of CT images.
There was good correlation between the mean area of hypoenhanced myocardium on the arterial phase of CT images and the mean area of hyperenhanced myocardium on the delayed phases of CT images (Y = 6.296 + 0.928 X, r = 0.911, p = 0.001) with a mean difference of 5.2 ± 8.5%
(p = 0.001) (Fig. 3) (Table 3).
Comparison between delayed cardiac MDCT and MR imaging
Delayed hyperenhanced areas were observed in all 17 pati- ents on the delayed enhancement MDCT and MR imaging (Figs. 1E, F and 2E, F, H, I). Mean signal intensity on the delayed phase of MR images was 86 ± 30 arbitrary units (AU) in infarct myocardium and 14 ± 10 AU in normal myocardium. Delayed MR images had a better CNR than delayed phase of CT images (27.1 ± 17.8% vs. 4.3 ± 2.1%, p < 0.001) (Table 2).
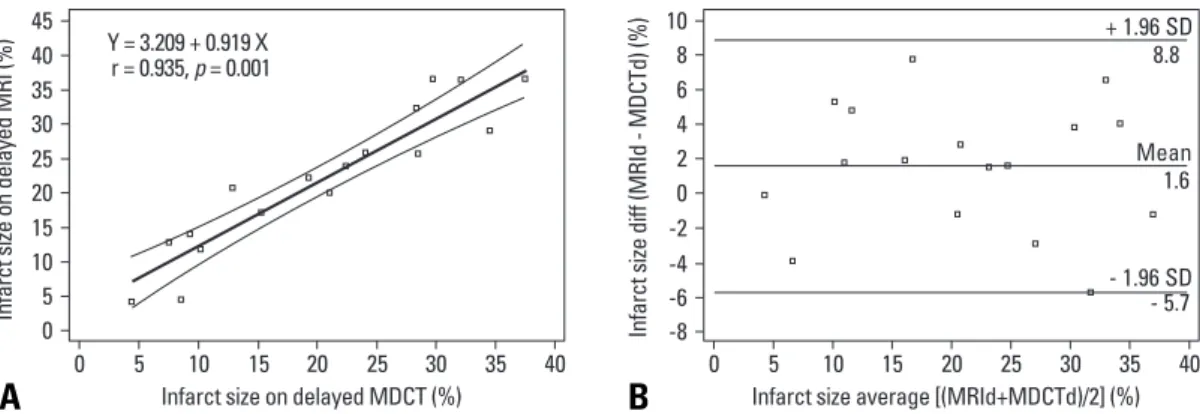
The mean area of hyperenhanced myocardium was 22 ± 10% (range, 4-36%) on the delayed MR images. There was good correlation between the mean area of hyperen-
hanced myocardium on the delayed phase of CT images and that of hyperenhanced myocardium on the delayed MR images (Y = 3.209 + 0.919 X, r = 0.935, p = 0.001) with a mean difference of 1.6 ± 7.3% (p = 0.10) (Fig. 4) (Table 3).
Interobserver agreement
Interobserver agreements for measurements of infarct size represented by the hyperenhancement area were ICC = 0.94 and ICC = 0.91 on the delayed enhanced CT and MR images, respectively.
The major findings of the present study were that delayed MDCT images could show the myocardial infarct as a hyperenhanced area that was well correlated to the area measured by delayed cardiac MR imaging. Furthermore, arterial MDCT images could show the stent patency after doing PCI with stenting in patients with myocardial infarc- tion. The total mean radiation dose, including the arterial and delayed phases of CT images, was below 8 mSv, which is clinically acceptable. However, a CNR was not good in
DISCUSSION
A B C
D E F
Fig. 1. Images obtained for a 50-year-old man with anterolateral myocardial infarction. (A) Total occlusion in the ramus intermedius (RI) (arrow) and 60% stenosis in the mid-LAD artery. (B and C) Patent stents at the culprit lesion of RI and the LAD artery on 3D-VRT (A) and curved MPR (C) CT images after PCI with stenting. (D-F) No definite area of hypoperfusion and some beam-hardening artifact in anterior and posterior wall of left ventricle on the arterial CT image (D), anterolateral hyperenhancement on delayed phase CT (E) (white arrows) and MR (F) images. LAD, left anterior descending artery; 3D-VRT, 3 dimensional volume rendering technique; MPR, multiplannar reformatted imaged; CT, computed tomography; PCI, percutaneous coronary intervention. LAD, left anterior descending artery; 3D-VRT, 3-dimensional volume rendering technique;
MPR, multiplannar reformatted imaged; CT, computed tomography; PCI, percutaneous coronary intervention; MR, magnetic resonance.
the delayed phase of CT images when compared to the delayed MR images.
Cardiac MDCT has recently emerged as the promising diagnostic tool for infarct characterization, based on experi- mental studies in animals
2,14-16as well as by clinical studies in patients.
10,17The main problem in evaluating myocardial infarction using cardiac MDCT is radiation exposure. For
64-slice MDCT coronary angiography, dose values of up to 15.2 mSv for males and 21.4 mSv for females have been reported.
6The radiation exposure can, however, be reduced by technical adjustments such as ECG-dependent tube current modulation. This technique reduces the radia- tion exposure up to 47%, depending on the patient’s heart rate.
18However, ECG-gating technique in cardiac CT
A B C
D E F
G H I
Fig. 2. Images obtained for a 59-year-old man with anteroseptal myocardial infarction. (A) Total occlusion at ostium of the LAD artery (arrowhead).
(B and C) A patent stent at the culprit lesion of LAD artery on 3D-VRT (B) and curved MPR (C) CT images after PCI with stenting. (D-I) Anteroseptal hypoperfusion on early arterial CT images (D-G) (arrows), anteroseptal hyperenhancement on delayed phase CT (E-H) (arrows) and MR (F-I) images. LAD, left anterior descending artery; 3D-VRT, 3-dimensional volume rendering technique; MPR, multiplannar reformatted imaged; CT, computed tomography; PCI, percutaneous coronary intervention; MR, magnetic resonance.
Table 2. Contrast-to-Noise Ratio of Cardiac CT and MR Imaging in 17 Patients with Myocardial Infarct
Model Phase Normal Infarct CNR p value
MDCT Arterial 104 ± 17 65 ± 19 2.3 ± 1.7 0.01
Delayed 89 ± 16 125 ± 23 4.3 ± 2.1 0.01
MRI Delayed 14 ± 10 86 ± 30 27.1 ± 17.8 0.001
CNR, contrast-to-noise ratio; MDCT, multi-detector row computed tomography; MRI, magnetic resonance imaging.
Data are means ± standard deviations.
imaging is still limited due to the repeated exposure to radia- tion necessary to acquire the arterial and delayed phases of CT images.
More recently, a new MDCT imaging protocol has been proposed with a prospective ECG-gating technique that limits radiation exposure to only predefined time points in the cardiac cycle, rather than during the entire cardiac cycle.
11Hirai, et al.
19reported that the calculated effective dose with prospective CT angiography was 79% lower
than that with retrospective CT angiography. Although, the reduction in radiation exposure was not compared between prospective and retrospective ECG-gating techniques in our study, the former technique showed a mean effective dose of about 7.7 mSv during the combined studies of the arterial and delayed phases of CT images.
The advantages of a two-phase CT study are that the arterial phase of CT images can provide information of early perfusion status of the myocardium as well as infor-
A B
Fig. 3. Linear regression analysis and Bland-Altman plots for infarct size between early arterial and delayed phase MDCT images. (A) Areas of hypoperfusion and hyperenhancement for early arterial phase and delayed phase MDCT images (Y = 6.296 + 0.928X, r = 0.911, p < 0.001). (B) Bland- Altman plots showing the relationship between early arterial MDCT images and delayed enhanced MDCT images. Mean differences (y-axes) between each pair [(mean MDCTd) - (mean MDCTa)] are plotted against the average values (x-axes) of the same pair [{(mean MDCTd) + (mean MDCTa)}/2]. These results showed that area of hyperenhancement on the delayed phase MDCT images was 5.2% larger than that of hypoenhancement on the arterial phase MDCT images (p < 0.05). MDCTd (a) = multidetector computed tomography, arterial phase (delayed phase). MDCT, multidetector computed tomography.
A B
Fig. 4. Linear regression analysis and Bland-Altman plots for infarct size between delayed phase MDCT images and delayed phase MR images.
(A) Areas of hyperenhancement for delayed phase MDCT and MR images (Y = 3.209 + 0.919X, r = 0.935, p < 0.001). (B) Bland-Altman plots showing the relationships between delayed enhanced MDCT and MR images. Mean differences (y-axes) between each pair [(mean MRId) - (mean MDCTd)] are plotted against the average values (x-axes) of the same pair [{(mean MRId) + (mean MDCTd)}/2]. These results showed that the delayed phase MDCT infarct size was 1.6% larger than MRI (p = 0.10). MDCT, multidetector computed tomography.
Table 3. Mean Sizes of Hypo- or Hyperenhanced Areas on the Cardiac CT and MR Images for 17 Patients with Myocardial Infarct
Model Hypo- (%) / Arterial Hyper- (%) / Delayed p value
MDCT 15 ± 10 20 ± 10 0.001
MRI - 22 ± 10 -
p value - 0.10
Hypo- or Hyper-, hypoenhanced or hyperenhanced areas on arterial or delayed CT images; MDCT, multi-detector row computed tomography; MRI, magnetic resonance imaging.
Data are means ± standard deviations.
mation of the stent patency just after PCI with stenting in patients with myocardial infarction. In our study, the arterial phase of CT images showed good patency of the stent in most patients except a patient who has poor image quality of the stent due to severe motion artifact. The motion arti- fact is usually more severe in the right coronary artery.
20,21We also experienced more severe motion artifacts in the right coronary artery than in the left coronary artery, al- though we maintained a heart rate below 65 beats per minute. The motion artifact seemed to be caused by the limit in temporal resolution in our CT scanner, which had 420 msec of tube rotation time. Delayed CT imaging with prospective gating technique can effectively reveal myo- cardial infarction as a hyperenhanced area in spite of the relatively lower radiation exposure of about 3.8 mSv. The volume of myocardial infarction on the delayed CT images was well correlated with that on the delayed MR images, but there was no clinically significant difference between the two modalities.
Limitations
Our study has some limitations that should be overcome in the future. First, the study population was too small to generalize the results in all patients without arrhythmia.
Second, there was no comparative study for evaluation of stent patency using the arterial phase of CT images. Third, we did not optimize the proper delay time for late enhanced CT images. The previous reports have suggested intervals ranging from 5 to 15 minutes after administration of con- trast medium, which is similar to intervals used in MR imaging.
2However, dedicated injection protocols should be developed to optimize the contrast-to-noise ratio accord- ing to the amount of contrast media. Forth, we did not evaluate the presence of the hypoenhanced area within myocardial infarction, which is known to be the area of microvascular obstruction or no-reflow on the delayed phase CT or MR imaging. Finally, we did not consider manipulation of the kVp to reduce the radiation dose accord- ing to the patient’s body weight. It may be possible to reduce the effective radiation exposure more effectively if we control the kVp according to the body mass index of patients in the future study.
Conclusion
The present study demonstrates that the delayed phase of CT imaging can depict a myocardial infarction as an area of increased attenuation values, which is similar to the pat- tern of myocardial enhancement on delayed MR images.
The arterial CT images can be used to show the perfusion status, which has lower attenuation values in the infarct area, as well as to assess the stent patency in patients with PCI with stenting after myocardial infarction.
1. Gutberlet M, Fröhlich M, Mehl S, Amthauer H, Hausmann H, Meyer R, et al. Myocardial viability assessment in patients with highly impaired left ventricular function: comparison of delayed enhancement, dobutamine stress MRI, end-diastolic wall thick- ness, and TI201-SPECT with functional recovery after revascu- larization. Eur Radiol 2005;15:872-80.
2. Lardo AC, Cordeiro MA, Silva C, Amado LC, George RT, Sali- aris AP, et al. Contrast-enhanced multidetector computed tomo- graphy viability imaging after myocardial infarction: characteri- zation of myocyte death, microvascular obstruction, and chronic scar. Circulation 2006;113:394-404.
3. Kühl HP, Papavasiliu TS, Beek AM, Hofman MB, Heusen NS, van Rossum AC. Myocardial viability: rapid assessment with delayed contrast-enhanced MR imaging with three-dimensional inversion-recovery prepared pulse sequence. Radiology 2004;
230:576-82.
4. Kim RJ, Wu E, Rafael A, Chen EL, Parker MA, Simonetti O, et al. The use of contrast-enhanced magnetic resonance imaging to identify reversible myocardial dysfunction. N Engl J Med 2000;
343:1445-53.
5. Nieman K, Cademartiri F, Lemos PA, Raaijmakers R, Pattynama PM, de Feyter PJ. Reliable noninvasive coronary angiography with fast submillimeter multislice spiral computed tomography.
Circulation 2002;106:2051-4.
6. Mollet NR, Cademartiri F, van Mieghem CA, Runza G, McFad- den EP, Baks T, et al. High-resolution spiral computed tomogra- phy coronary angiography in patients referred for diagnostic con- ventional coronary angiography. Circulation 2005;112:2318-23.
7. Achenbach S, Ulzheimer S, Baum U, Kachelriess M, Ropers D, Giesler T, et al. Noninvasive coronary angiography by retrospec- tively ECG-gated multislice spiral CT. Circulation 2000;102:
2823-8.
8. Chiou KR, Liu CP, Peng NJ, Huang WC, Hsiao SH, Huang YL, et al. Identification and viability assessment of infarcted myo- cardium with late enhancement multidetector computed tomo- graphy: comparison with thallium single photon emission com- puted tomography and echocardiography. Am Heart J 2008;155:
738-45.
9. Sato A, Hiroe M, Nozato T, Hikita H, Ito Y, Ohigashi H, et al.
Early validation study of 64-slice multidetector computed tomo- graphy for the assessment of myocardial viability and the predic- tion of left ventricular remodelling after acute myocardial infarc- tion. Eur Heart J 2008;29:490-8.
10. Nieman K, Shapiro MD, Ferencik M, Nomura CH, Abbara S, Hoffmann U, et al. Reperfused myocardial infarction: contrast- enhanced 64-Section CT in comparison to MR imaging. Radiol- ogy 2008;247:49-56.
11. Husmann L, Valenta I, Gaemperli O, Adda O, Treyer V, Wyss CA, et al. Feasibility of low-dose coronary CT angiography: first exper- ience with prospective ECG-gating. Eur Heart J 2008;29:191-7.
12. Shuman WP, Branch KR, May JM, Mitsumori LM, Lockhart DW, Dubinsky TJ, et al. Prospective versus retrospective ECG gating for 64-detector CT of the coronary arteries: comparison of image quality and patient radiation dose. Radiology 2008;248:
431-7.
13. Bland JM, Altman DG. Statistical methods for assessing agree- ment between two methods of clinical measurement. Lancet 1986;
REFERENCES
1:307-10.
14. Büecker A, Katoh M, Krombach GA, Spuentrup E, Bruners P, Gunther RW, et al. A feasibility study of contrast enhancement of acute myocardial infarction in multislice computed tomography:
comparison with magnetic resonance imaging and gross mor- phology in pigs. Invest Radiol 2005;40:700-4.
15. Brodoefel H, Reimann A, Klumpp B, Fenchel M, Ohmer M, Miller S, et al. Assessment of myocardial viability in a reperfused porcine model: evaluation of different MSCT contrast protocols in acute and subacute infarct stages in comparison with MRI. J Comput Assist Tomogr 2007;31:290-8.
16. Baks T, Cademartiri F, Moelker AD, van der Giessen WJ, Krestin GP, Duncker DJ, et al. Assessment of acute reperfused myocar- dial infarction with delayed enhancement 64-MDCT. Am J Roen- tgenol 2007;188:W135-7.
17. Mahnken AH, Koos R, Katoh M, Wildberger JE, Spuentrup E, Buecker A, et al. Assessment of myocardial viability in reperfus- ed acute myocardial infarction using 16-slice computed tomo- graphy in comparison to magnetic resonance imaging. J Am Coll
Cardiol 2005;45:2042-7.
18. Trabold T, Buchgeister M, Kuttner A, Heuschmid M, Kopp AF, Schröder S, et al. Estimation of radiation exposure in 16-detector row computed tomography of the heart with retrospective ECG- gating. Rofo 2003;175:1051-5.
19. Hirai N, Horiguchi J, Fujioka C, Kiguchi M, Yamamoto H, Matsuura N, et al. Prospective versus retrospective ECG-gated 64- detector coronary CT angiography: assessment of image quality, stenosis, and radiation dose. Radiology 2008;248:424-30.
20. Giesler T, Baum U, Ropers D, Ulzheimer S, Wenkel E, Mennic- ke M, et al. Noninvasive visualization of coronary arteries using contrast-enhanced multidetector CT: influence of heart rate on image quality and stenosis detection. AJR Am J Roentgenol 2002;
179:911-6.
21. Kopp AF, Schroeder S, Kuettner A, Heuschmid M, Georg C, Ohnesorge B, et al. Coronary arteries: retrospectively ECG-gated multi-detector row CT angiography with selective optimization of the image reconstruction window. Radiology 2001;221:683-8.