Effects of Bacillus subtilis, Kefir and β-Glucan Supplementation on Growth Performance, Blood Characteristics, Meat Quality and Intestine Microbiota in Broilers
Abdolreza Hosseindoust
*, Jae Won Park
*and In Ho Kim
†Dept. of Animal Resource & Science, Dankook University, Cheonan 330-714, South Korea
ABSTRACT A total of 528 broilers (47±0.1 g; 1 day of age) were used in a 35-day feeding trial to evaluate probiotics,
prebiotics and their interactive effects on growth performance, blood characteristics, relative organ weight and meat quality.
Broilers were randomly distributed into 1 of 6 treatments on the basis of body weight (BW) (4 replicate pens per treatment, 22 broilers per pen). The dietary treatments were CON, basal diet; B, CON + 0.1 g kg-1 Bacillus subtilis; K, CON + 1 g kg-1 Kefir; G, CON + 1 g kg-1 β-glucan; GB, G + 1 g kg-1 Bacillus subtilis; and GK, G + 1 g kg-1 Kefir. The overall effects indicated that broilers fed the K, G and GK diets had greater body weight gain (BWG) than those fed the CON diet (P<0.05).
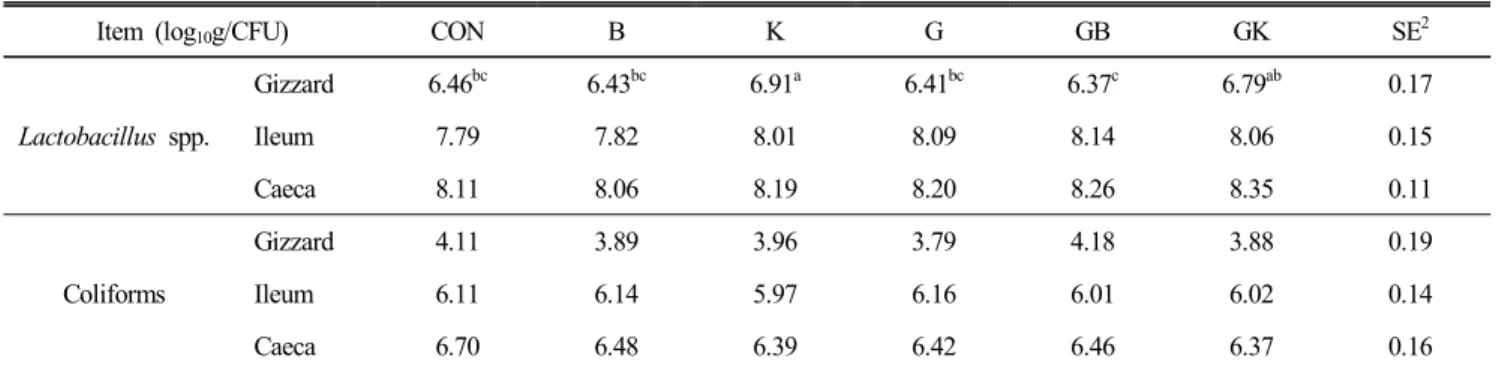
The number of white blood cells increased (P<0.05) in the GB group compared with the CON, B and G treatments; however, the lymphocyte percentage in the B group was higher than in the G group. The weight of bursa fabricii was lower in the B and G groups compared to the K group (P<0.05), whereas a higher spleen weight was observed in chickens that were fed the GB and GK diets compared to the B group (P<0.05). The treatments did not affect the meat quality parameters, except for meat redness, which improved with all of the supplementation groups (P<0.05). The population of Lactobacillus spp. in gizzard was significantly higher in the K treatment compared with CON, B, G and GB. In conclusion, supplementation with kefir and β-glucans improved growth performance.
(Key words: broiler, Bacillus subtilis, β-glucan, kefir, growth performance, meat quality)
* These authors contributed equally to the present study.
†To whom correspondence should be addressed : [email protected]
INTRODUCTION
Previously, antibiotics were usually included in diets as growth promoters. However, due to the regular use, antibiotic resistance emerged as another problem and thus a ban was enforced on the use of in-feed antibiotics for livestock growth promotion (Simon, 2005). In search for the better alternatives, probiotics and prebiotics have gained a great attention to replace in-feed antibiotics. This study focuses first on the de- finitions of probiotics, prebiotics, and the possible synbiotics effects of β-glucans as a prebiotic with either Lactobacillus- based or Bacillus subtilis-based probiotics. β-Glucans are indigestible polysaccharides that can be extracted from the cell walls of yeasts, fungi, and various grains as an immune modulator to improve the immune system and act as a me- chanism against pathogenic activities (Cheng et al., 2004).
Several studies have shown that dietary supplementation of β- glucans improved the growth performance (An et al., 2008) or immune system’s capability (Cheng et al., 2004; Wang et al., 2008; Zhang et al., 2008). The relative weight of the spleen
as an organ, which is related to immune system, was increased by 3.9% by β-glucan supplementation (Zhang et al., 2012).
Previous work in the author’s laboratory showed an interaction between β-glucans and kefir (Cho et al., 2013). The inter- action between prebiotics and probiotics has been already confirmed several times (Cho et al., 2013; Zhang et al., 2012), however, it seems crucial to know which kinds of probiotics (kefir as a Lactobacillus-based probiotic or B. subtilis) can make a better combination with β-glucans. Different species of B. subtilis are considered to be probiotic microorganisms that can improve intestinal health. Dietary Bacillus-based direct-fed microbials (DFM) are reported to have beneficial effects on animal and poultry growth and feed conversion efficiency (An et al., 2008; Park and Kim, 2015; Zhang et al., 2012). Use of compounds that have B. subtilis in them could possibly improve intestinal health (Aliakbarpour et al., 2012;
Lei et al., 2014) and manipulation of intestinal microflora (Lei
et al., 2014). Kefir is a popular traditional Middle Eastern be-
verage created from the fermentation of milk with kefir grains
and other cultures prepared from grains. Kefir grains contain
a complex mixture of lactobacilli, bacteria, and yeasts, as well as the probiotic bacteria that is found in yogurt (Fuller, 1989;
Zhang et al., 2012). Thus, kefir can be defined as a probiotic food ingredient and feed additive. The current experiment was undertaken to demonstrate the effects of β-glucans, kefir and B. subtilis as different sorts of probiotics on growth perfor- mance, blood characteristics, relative organ weight, and meat quality.
MATERIALS AND METHODS
All broilers used in this trial were handled in accordance with the guidelines of the Animal Care and Use Committee of Dankook University.
1. Preparation of Kefir, β-Glucan and B. subtilis A concentrated β-glucan was derived from Agrobacterium sp. R259 KCTC 10197B, which was derived by an aerobic fermentation method (Genebio), and was guaranteed to contain 86.1 g kg
—1β-1,3/1,6-glucan, 42 g kg
—1protein, and 13 g kg
—1lipids. A fermenter with volume of 34 tonnes was used in this method. The fermentation temperature was controlled at a bout 30 ℃ with an aeration rate of 0.75 air volume per culture volume perminute. The solids in the broth were isolated by a decanter. Thereafter, the solids were put into a high-speed bead mill to disrupt the cells, and then protein was sieved. The final product with purity of 9.5% was obtained after drying the screened slurry usin g a spray dryer. The Bacillus subtilis UBT-MO2 probiotic isolated from the soil around poultry farms (DMJ Biotech Co. Ltd., Youngi-gun, Chungcheongnam- do, South Korea) is composed of spray-dried spore-forming B. subtilis endospores, which is determined to contain at least 10
8cfu B. subtilis/kg. The test Kefir was provided by a commercial company, Genebio (Seoul, South Korea) from sterilize ultra-high temperature milk inoculated with 5% active kefir grains under aseptic conditions and incubating at 22℃
for 20 hours (Marshal and Cole, 1985). Viable counts of lactic acid bacteria in the kefir samples were then determined by plating serial 10-fold dilutions (in 10 g/L peptone solu- tion) onto Lactobacilli MRS agar plates to verify the number of Lactobacillus. The Lactobacilli MRS agar plates were in- cubated for 48 h at 39℃ and the number of Lactobacillus
bacteria in the kefir samples was 5.3±4.2×10
8.
2. Birds and Diets
A total of 528 day-of-hatch mixed sex ROSS 308 broiler chicks (Yang Ji Company, Cheonan, South Korea) with initial BW of 47±0.1 g were randomly placed in battery brooders with 4 replicate pens of 22 birds/pen for each treatment. There were 6 treatments in this experiment: CON, basal diet; B, CON + 1 g kg
—1Bacillus (10
8cfu Bacillus subtilis/kg); K, CON + 1 g kg
—1kefir; G, CON + 1 g kg
—1β-glucan; GB, G + 1 g kg
—1Bacillus (10
8cfu Bacillus subtilis/kg); GK, G + 1 g kg
—1kefir. Birds were given access to water and a maizesoybean meal-based feed as starter including 3,100 kcal/kg metabolism energy (ME), 220 g kg
—1crude protein (CP) and finisher diets (ME 3,050 kcal/kg, CP 190 g kg
—1) (Table 1) ad libitum.
Chicks were kept under daylight (electric) lamp lighting on a light regime consisting of 23 h light and 1 h darkness. The temperature of the room was maintained at 33±1℃ for the first 3 d and decreased to 23℃ until the end of the experiment with the relative humidity was around 60%. The diets were provided during the experiment in 2 phases consisting of a starter phase from d 0∼21 and a finisher phase from d 21∼35.
3. Growth Performance Parameters
Birds were weighed on d 0, d 21 and d 35, with birds in each pen being weighed as a group. Mean BW of the birds in each treatment was calculated from the pen replicates for each weighing day. Body weight gain (BWG) was calculated individually for each period and cumulatively based on pen weights. For the same period, feed intake (FI) of each pen as a group was measured as BW (d 21 and d 35) with cu- mulative averages calculated. Feed conversion ratio (FCR) was calculated as (feed intake)/(body weight gain).
4. Sampling and Measurements
On d 21 and d 35 of the experiment, 8 broilers were ran-
domly selected from each treatment (2 birds/pen) and blood
samples were collected from the wing vein using a sterile sy-
ringe. Half of the sample was transferred into either a vacuum
(clot activator with gel) or a 5 mL K3 EDTA vacuum tube
(Becton Dickinson Vacutainer Systems, Franklin Lakes, NJ)
and stored at —4℃. The white blood cell (WBC), red blood
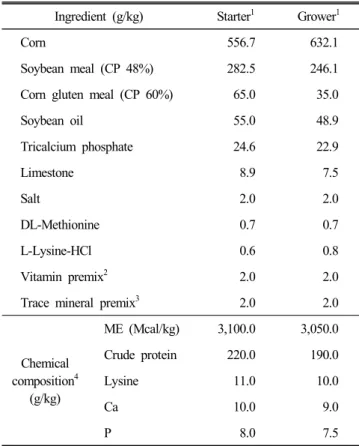
Table 1. Diet composition (as-fed basis)
Ingredient (g/kg) Starter1 Grower1
Corn 556.7 632.1
Soybean meal (CP 48%) 282.5 246.1
Corn gluten meal (CP 60%) 65.0 35.0
Soybean oil 55.0 48.9
Tricalcium phosphate 24.6 22.9
Limestone 8.9 7.5
Salt 2.0 2.0
DL-Methionine 0.7 0.7
L-Lysine-HCl 0.6 0.8
Vitamin premix2 2.0 2.0
Trace mineral premix3 2.0 2.0
Chemical composition4
(g/kg)
ME (Mcal/kg) 3,100.0 3,050.0
Crude protein 220.0 190.0
Lysine 11.0 10.0
Ca 10.0 9.0
P 8.0 7.5
1 Starter diets, provided during weeks 0∼3; grower diets, provided during weeks 4∼5.
2 Provided per kg of diet: 15,000 IU of vitamin A, 3,750 IU of vi- tamin D3, 37.5 mg of vitamin E, 2.55 mg of vitamin K3, 3 mg of vitamin B1, 7.5 mg of vitamin B2, 4.5 mg of vitamin B6, 24 mg of vitamin B12, 51 mg of niacin, 1.5 mg of folic acid, 126 mg of biotin and 13.5 mg of pantothenic acid.
3 Provided per kg of diet: 37.5 mg of Zn, 37.5 mg of Mn, 37.5 mg of Fe, 3.75 mg of Cu, 0.83 mg of I, 62.5 mg of S and 0.23 mg of Se.
4 Calculated values.
cell (RBC) and lymphocyte counts in the whole blood were determined using an automatic blood analyser (ADVIA, Bayer, Tarrytown, NY).
Plasma was separated from whole blood by centrifuging at 3,000 g for 15 min. Immunoglobin G (IgG) was analysed using nephelometry (Dade Behring, Marburg, Germany). On d 35, 20 broilers (5 chickens/pen) were randomly selected from each treatment and then killed by cervical dislocation.
The liver, spleen, bursa Fabricii, breast meat and abdominal fat and were then removed and cleaned. The breast muscle was stored at 4℃ before analysis. Relative organ weight was
expressed as a percentage of the live body weight. The breast meat Hunter lightness (L*), redness (a*) and yellowness (b*) values were measured using a Minolta CR410 chromameter (Konica Minolta Sensing Inc., Osaka, Japan). Drip loss was measured using approximately 2 × 2 × 2 cm of meat sample according to the plastic bag method described by Honikel (1986). The water holding capacity (WHC) was measured according to the methods of Kauffman et al. (1986). Cooking loss was determined using 5 g of breast meat, which was heat- treated in plastic bags separately in a water bath (100℃) for 5 min. Samples were cooled at room temperature. Cooking loss was calculatedas (sample weight before cooking—sample weight after cooking)/sample weight before cooking × 100.
At one hour postmortem, duplicate pH values for each breast muscle sample were measure dusing a pH meter by inserting a glass electrode directly in the thickest part of the pectoralis major (Fisher Scientific, Pittsburgh, PA, US).
The same slaughtered broiler chickens were used for micro- bial counts. Gizzard, Ileal and caecal contents were collected into Qorpak glass containers (118 mL) under CO
2, sealed and placed on ice until transported to the laboratory for enumera- tion of microbial populations. Gizzard, caecal and ileal samples were assessed for populations of Lactobacillus and Escherichia coli. One gram of the composite excreta sample from each cage was diluted with 9 mL of 1% peptone broth (Becton, Dickinson and Co., Franklin Lakes, NJ) and then homogenised.
Viable counts of bacteria in the gizzard, caecal and ileal sam-
ples were then conducted by plating serial 10-fold dilutions (in
1% peptone solution) onto lactobacilli medium III agar plates
(Medium 638; DSMZ, Braunschweig, Germany), MacConkey
agar plates (Difco Laboratories, Detroit, MI) supplemented
with glacial acetic acid (1 mL/L) and mupirocin (100 mg/L)
extracted from antimicrobial discs to isolate the Lactobacillus
and Escherichia coli, respectively. The lactobacilli medium III
agar plates were then incubated for 48 h at 37 ℃ under anae-
robic conditions. The MacConkey plates were incubated for 24
h at 37 ℃ and the Wilkins-Chalgren agar plates were incubated
for 72 h at 37 ℃. The microflora colonies were counted imme-
diately after removal from the incubator. The concentration of
microflora was expressed as log10 colony-forming units per
gram of intestinal content.
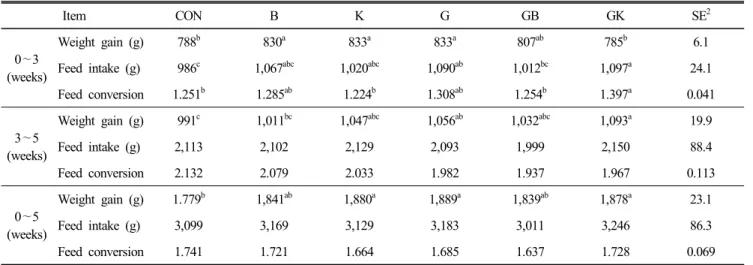
Table 2. Effects of Bacillus subtilis, kefir and beta-glucan on growth performance in broilers1
Item CON B K G GB GK SE2
0∼3 (weeks)
Weight gain (g) 788b 830a 833a 833a 807ab 785b 6.1
Feed intake (g) 986c 1,067abc 1,020abc 1,090ab 1,012bc 1,097a 24.1
Feed conversion 1.251b 1.285ab 1.224b 1.308ab 1.254b 1.397a 0.041
3∼5 (weeks)
Weight gain (g) 991c 1,011bc 1,047abc 1,056ab 1,032abc 1,093a 19.9
Feed intake (g) 2,113 2,102 2,129 2,093 1,999 2,150 88.4
Feed conversion 2.132 2.079 2.033 1.982 1.937 1.967 0.113
0∼5 (weeks)
Weight gain (g) 1.779b 1,841ab 1,880a 1,889a 1,839ab 1,878a 23.1
Feed intake (g) 3,099 3,169 3,129 3,183 3,011 3,246 86.3
Feed conversion 1.741 1.721 1.664 1.685 1.637 1.728 0.069
1 Abbreviations: (CON), basal diet; (B), CON + 1 g kg—1 Bacillus subtilis; (K), CON + 1 g kg—1 kefir; (G), CON + 1 g kg—1 betaglucan;
(GB), G + 1 g kg—1 Bacillus subtilis; (GK), G + 1 g kg—1 kefir.
2 Standard error of the means.
a∼c Means in the same row with different superscripts differ (P<0.05).
5. Statistical Analysis
All data were statistically analysed by one-way ANOVA using the GLM procedure of SAS system for windows (SAS Institute Inc., 2001, Cary, NC), with pen as the experimental unit. The mean differences among all treatments were separated by Tukey multiple range tests, with a P<0.05 indicating sig- nificance.
RESULTS
1. Growth Performance
Live-weight gain, feed intake and feed conversion ratio for the experimental period are shown in Table 2. From 0 to 3 weeks period, birds fed diets with either B. subtilis, kefir or β-glucans grew faster (P<0.05) than those of the CON and GK groups, but feed conversion ratio was significantly (P<
0.05) lower in the CON, K and GB groups compared to GK group. From 4∼5 weeks period, the body weight gain of bro- ilers in the GK group was better (P<0.05) than those of the CON and B group, but the feed conversion and feed intake did not change. Body weight gain significantly increased by kefir, β-glucans and mix of kefir and β-glucans during the overall 35-d period, however, feed intake and feed conversion were not affected from the treatments.
2. Blood Profile
For the blood characteristic, the group receiving feed su- pplemented with B. subtilis had the highest RBC in the 3rd week but there was not any difference among all treatments in the end of experiment (Table 3). For lymphocyte, all groups (K, G, GB and GK) except B. subtilis group had a higher lymphocyte percentage in the 3rd week compared to control diet, but percentage of lymphocyte was significantly (P<0.05) higher only in the group receiving B. subtilis than that of the β-glucan diet at the end of experiment. There were no di- fferences in total protein and IgG between birds fed the supplemented diets in both 3rd and 5th week. At 35 d of age, total WBC were significantly (P<0.05) greater in GB than those in CON, B and G groups (Table 3).
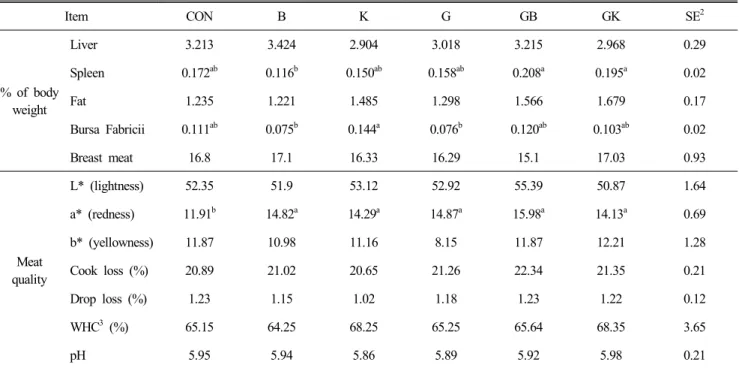
3. Relative Organ Weight
Table 4 presents relative organ weight in broiler chickens fed the CON, B, K, G and mixture of G with GB or GK.
Relative weights of the liver, abdominal fat and breast meat
did not affect from the treatments (P>0.05), but kefir was
able to increase the weight of bursa Fabricii compare to both
B. subtilis and β-glucan groups at the end of experiment. Re-
sults also showed that the weight of spleen was significantly
increased in the GB and GK groups compared to B group.
Table 3. Effects of Bacillus subtilis, kefir and beta-glucan on blood profile in broilers1
Item CON B K G GB GK SE2
3 (week)
RBC (×106/μL) 1.85b 2.25a 2.02b 2.01b 1.95b 2.01b 0.07
WBC (×106/μL) 244 277 244 287 258 267 28.6
Lymphocyte (%) 74.7b 80.5ab 81.5a 83.0a 84.5a 85.5a 1.92
Total protein (g/dL) 3.1 3.2 2.9 3.1 2.85 3.18 0.11
IgG (g/dL) 1.13 1.31 1.55 1.44 1.31 1.26 0.42
5 (week)
RBC (×106/μL) 1.84 1.94 1.89 1.99 2.02 2.03 0.06
WBC (×106/μL) 468b 482b 530ab 484b 572a 521ab 18.91
Lymphocyte (%) 79.2ab 83.2a 75.7ab 71.7b 76.2ab 80.0ab 2.99
Total protein (g/dL) 3.85 3.72 3.81 3.91 3.83 4.13 0.28
IgG (g/dL) 1.06 1.4 1.4 1.12 1.18 1.19 0.34
1 Abbreviations: (CON), basal diet; (B), CON + 1 g kg—1 Bacillus subtilis; (K), CON + 1 g kg—1 kefir; (G), CON + 1 g kg—1 betaglucan;
(GB), G + 1 g kg—1 Bacillus subtilis; (GK), G + 1 g kg—1 kefir.
2 Standard error of the means.
a,b Means in the same row with different superscripts differ (p<0.05).
Table 4. Effects of Bacillus subtilis, kefir and beta-glucan on relative organ weight and meat quality in broilers1
Item CON B K G GB GK SE2
% of body weight
Liver 3.213 3.424 2.904 3.018 3.215 2.968 0.29
Spleen 0.172ab 0.116b 0.150ab 0.158ab 0.208a 0.195a 0.02
Fat 1.235 1.221 1.485 1.298 1.566 1.679 0.17
Bursa Fabricii 0.111ab 0.075b 0.144a 0.076b 0.120ab 0.103ab 0.02
Breast meat 16.8 17.1 16.33 16.29 15.1 17.03 0.93
Meat quality
L* (lightness) 52.35 51.9 53.12 52.92 55.39 50.87 1.64
a* (redness) 11.91b 14.82a 14.29a 14.87a 15.98a 14.13a 0.69
b* (yellowness) 11.87 10.98 11.16 8.15 11.87 12.21 1.28
Cook loss (%) 20.89 21.02 20.65 21.26 22.34 21.35 0.21
Drop loss (%) 1.23 1.15 1.02 1.18 1.23 1.22 0.12
WHC3 (%) 65.15 64.25 68.25 65.25 65.64 68.35 3.65
pH 5.95 5.94 5.86 5.89 5.92 5.98 0.21
1 Abbreviations: (CON), basal diet; (B), CON + 1 g kg—1 Bacillus subtilis; (K), CON + 1 g kg—1 kefir; (G), CON + 1 g kg—1 betaglucan;
(GB), G + 1 g kg—1 Bacillus subtilis; (GK), G + 1 g kg—1 kefir.
2 Standard error of the means.
3 Water holding capacity.
a,b means in the same row with different superscripts differ (P<0.05).
Table 5. Effects of Bacillus subtilis, kefir and beta-glucan on microbiota of intestine in broilers1
Item (log10g/CFU) CON B K G GB GK SE2
Lactobacillus spp.
Gizzard 6.46bc 6.43bc 6.91a 6.41bc 6.37c 6.79ab 0.17
Ileum 7.79 7.82 8.01 8.09 8.14 8.06 0.15
Caeca 8.11 8.06 8.19 8.20 8.26 8.35 0.11
Coliforms
Gizzard 4.11 3.89 3.96 3.79 4.18 3.88 0.19
Ileum 6.11 6.14 5.97 6.16 6.01 6.02 0.14
Caeca 6.70 6.48 6.39 6.42 6.46 6.37 0.16
1 Abbreviations: (CON), basal diet; (B), CON + 1 g kg—1 Bacillus subtilis; (K), CON + 1 g kg—1 kefir; (G), CON + 1 g kg—1 betaglucan;
(GB), G + 1 g kg—1 Bacillus subtilis; (GK), G + 1 g kg—1 kefir.
2 Standard error of the means.
a,b means in the same row with different superscripts differ (P<0.05).