1)
Introduction
Fatty acids are basic components of naturally occurring lipids in animals and plants which are important for energy metabolism and cell signalling
1-3)
. The FAs profiling is important during lipid analysis either in biological matrices from human or plant samples like food, extracts or oils
4). Study
책임저자 윤혜란 서울 도봉구 삼양로길: , 33 덕성여자대학교 약학대학 생의약분석실 Tel: 02)901-8387, Fax: 02)901-8386 E-mail: [email protected]
of individual fatty acids profiling is important for the diagnosis of fatty acid disorders and inherited errors of metabolism like mitochondrial fatty acid disorder and peroxisomal disorders
5,6). Thus, there is a need of development of simple and sensitive analytical method to determine fatty acids
7)Gas chromatography is the widely used techni- ques to measure fatty acids. James et al. initially measured fatty acids directly in an underivatized form. The drawbacks like sample loss in the in- jector, column and the problem with the integration
지방산대사이상질환 스크리닝을 위한 TBDMS 유도체화 후 를 이용한 혈장 중 유리지방산의 분석 GC-MS
덕성여자대학교 약학대학 생 의약분석실ㆍ
윤혜란 타파마헤샬ㆍ
A Sensitive Determination of Plasma Free Fatty Acids Following
Tert
-butyldimethylsilyl Derivatization using GasChromatography-Mass Spectrometry for Screening of Fatty Acid Oxidation Disorders
Hye-Ran Yoon, Maheshwor Thapa
Biomedical & Pharmaceutical Analysis Lab, College of Pharmacy, Duksung Women s University, Seoul, Republic of Korea’
Purpose: A sensitive gas chromatography mass spectrometry (GC-MS) method was developed for screening of fatty acid oxidation disorders.
Methods: The assay utilized a simple protein precipitation with sulfosalicylic acid followed by tert -butyl dimethylsilyl (TBDMS) derivatization of hydroxyl functional group by N- tert -butyldimethylsilyl-N-methyltriflu- oroacetamide (MTBSTFA).
Results: Calibration curves of spiked pooled plasma showed a linear relationship in the range of 0.01 ng -2 mg with correlation coefficient value greater than 0.98. Limits of detection (LOD) and limits of quantification (LOQ) were found in the range of 0.9-8.8 ng and 9-88 ng, respectively.
Conclusion: The new developed method might be useful for a rapid, sensitive screening of inherited fatty acid oxidation disorders. In addition, the method expected to be one of the alternative method for screening newborns of metabolic disorders in the laboratories where expensive MS/MS is unavailable.
Key words: Free fatty acids, Gas chromatography-mass spectrometry, tert -butyldimethylsilyl derivatives,
Fatty acid oxidation disorders
limits the use of fatty acids in underivatized form
8)
. James et al. again reduces the disadvantages of previous method by preparing the methyl esters of fatty acids. Further, this method has increased the sensitivity
7). FAs do not possesses chro- mophores so they cannot be measured by UV- Visible techniques
8). Pre- and post-column deri- vatization with suitable chromophores is required to enhance the sensitivity and selectivity of fatty acid detection by UV detector. The use of capillary column coupled with flame ionization detector (FID) provides a high resolution of free fatty acids an- alysis. Furthermore, HPLC coupled with evapora- tive light scattering detection (ELSD) and HPLC with corona charged aerosol detection was de- veloped to measure FFAs
9,10). The coupling of HPLC with mass spectrometry provides the effi- ciency of analysis as well as structural elucidation
11)
. A major advantage of HPLC over GC is the lower temperature during analysis which prevent the risk of isomerization of unsaturated fatty acids.
The various other methods to measure fatty acid includes HPLC-fluorimetric detection
12)CE-UV detection
13,14), HPLC-UV coupled with 2-nitro- phenylhydrazines
15), high performance liquid chro- matography mass spectrometry (HPLC-MS/MS)
16-18)
, Hydrophilic interaction liquid chromatography tandem mass spectrometry (HILIC-ESI-MS/MS)
19)
.
Free fatty acids are generally analyzed after various derivatization before GC-MS analysis such as trimethylsilyl, pentafluorobenzoyl
20), or esteri- fication derivatives
21)etc. Silylation for low mo- lecular weight dicarboxylic acids provide low detection limits and satisfactory reproducibility compared to esterification derivatization
22). Tri- methylsilyl (TMS) derivatives are prone to hy- drolysis compared to corresponding TBDMS deri- vatives indicating that the TBDMS derivatives are
hydrostatically more stable
23). Here we describe a rapid and sensitive analytical method for the determination of free medium and long chain fatty acids in human plasma using GC-MS. .
Materials and Methods
1. Materials
Decanoic acid (C10), lauric acid (C12), cyristic acid (C14), myristoleic acid (C14:1), palmitoleic acid (C16), stearic acid (C18), octadecenoic acid (C18:1), and linoleic acid (18:2) were purchased from TCI Co. (Tokyo, Japan) (Fig. 1). Decanoic acid-d
3, lauric acid-d
3, and 13C-stearic acid were used as internal standard and purchased from Sigma Aldrich (MA, USA). N-methyl-N-(tert- butyldimethylsilyl) trifluoroacetamide (MTBSTFA) was used as derivatizing reagent and purchased from Sigma Aldrich (MA, USA). All other che- micals and solvents were of analytical grade and purchased from J. T. Baker. Distilled water was prepared using a Millipore-Milli QTM. Thermo vap (TAITEC model DTU-2C) was used for eva- poration and derivatization of samples. A centrifuge (Eppendorf model 5424) (Hamberg, Germany) was used for centrifuging the sample in different steps.
2. Gas chromatography-mass spectrometry
Hewlett-Packard-6890 Series gas chromato- graph coupled with 5973 network mass selective detector was used as the GC/MSD system. Sepa- ration of 8 free fatty acids with TBDMS derivative was accomplished using HP 5 capillary column (30 m 0.251 mm I.D, 0.33 m). Helium was used × μ as a mobile phase carrier gas at the flow rate of 0.8 ml/min.
The column oven temperature was programed
at 80 ℃ for 2 min, then constantly increased to 290 ℃ with 5 /min increment. The injection port ℃ and transfer line temperature was set at 280℃
and 300 ℃ respectively. 1 L sample was injected µ with a flow rate 0.8 ml/min and split ratio 1:10.
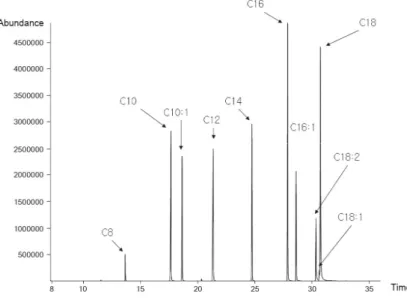
Electorn voltage was 70 eV for electron impact ionization. Spectra were observed for eight free fatty acids in scan mode (range: 50-550 m/z) and SIM mode was utilized for quantification (Fig.
1).
3. Preparation of standard solution
10 mg/10 mL (1,000 ppm) stock solution of C10, C12, C14, C16, C16:1, C18, C18:1, and 18:2 were prepared by dissolving the standard com- pound in n-hexane and stored at -20 . Each ℃ stock solution was further diluted to 10, 40, 80, 160, and 200 g/mL working standard solution for µ generating calibration curves. Decanoic acid-d
3, dodecanoic acid-d
3, and 13C-octadecanoic acid were also prepared as 10 mg/10 mL stock solution (1,000 ppm). All the solutions were stored at
-20 ℃ until the analyses.
4. Sample preparation and derivatization
Whole blood samples were collected and cen- trifuged at 3,000 rpm for 20 minutes. The plasma was separated and stored at -70 ℃ deep freezer to prevent the enzymatic degradation of FFAs.
The plasma samples were collected and stored at -20 ℃ until analysis.
A 100 L of plasma specimen was collected in μ eppendorf tube. 20 L of 30% sulfosalicylic acid µ was then added for protein precipitation. 10 L of µ each internal standard was added. The mixture was vortex mix for 1 min and centrifuged at 5,000 rpm for 3 mins. The precipitate was discarded and the upper layer was transferred to glass tube.
Two mL of methylene chloride was added, vortex mixed and centrifuged at 2,000 rpm for 3 minutes.
The lower layer was then transferred to a new glass tube and a tea spoonful moisture free so- dium chloride was added. The organic solvent was evaporated to dryness at 80 ℃ under gentle stream
Fig. 1. GC-MS chromatograms of standard free fatty acids (C8-C18:1) fol- lowing TBDMS derivatives.
of nitrogen.
The TBDMS derivative of hydroxyl functional groups was achieved by adding 20 L of MTBSTFA µ and 30 L of toluene. After gentle vortex mixing μ for 1 min, the mixture was reacted at 80 ℃ for 30 min. The complete TBDMS derivative of FFAs were cooled for 5 min and transferred to GC-vial for analysis using GC-MS.
5. Linearity, precision, and accuracy
The calibration curve was constructed by plot- ting the peak area intensity with five different con- centration levels of fatty acids 10, 40, 80, 160 and 200 g/mL and measured in five replicates. µ Limit of detection (LOD) is the lowest concentra- tion that can be detected and calculated at signal- to-noise ration greater than 3. Limit of quantita- tion (LOQ) is the lowest concentration that can be quantitate and calculated at signal-to-noise ratio greater than 10. The accuracy of the method was calculated by the following formula: [measured concentration-apparent concentration]/[apparent concentration] 100%. The precision was deter × - mined as the relative standard deviation (RSD).
Results
Each standard solution (1 ppm) was initially in- jected in GC-MS in a scan mode. Mass spectrum for TBDMS derivative of each compound was ob- tained as molecular ion [M]
+. The molecular ion was used for the identification of the compound investigated. The subsequent product ions were monitored on the basis of fragmentation pattern and are used for the confirmation of compounds.
Loss of specific ion m/z 57 was most abundantly observed for each compounds. Formula weight (FW), [M]
+ion and the retention time were eva- luated for selected ion monitoring (SIM) mode (Fig. 1). The ions having maximum intensity in the spectra was chosen as a quantification ion (QI) that does not interfere with other ions from matrices (Fig. 1). Either [M]
+ion or [M-57]
+ion was chosen for confirmation ion (CI). Retention time (RT), molecular weight (M.W), molecular ion [M]
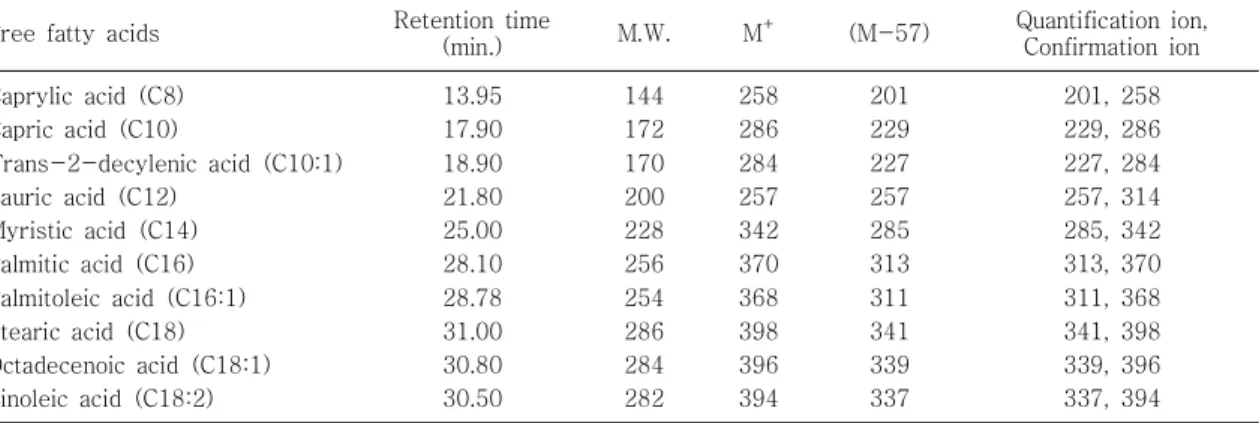
+, characteristic fragmented ion (M-57) are presented in Table 1.
The chromatogram from SIM mode (Fig. 2) shows the clear separation of each compounds in- vestigated. GC-MS mass spectrum for each com- pound was obtained (Fig. 2).
The linear range of the method was observed
Table 1. Retention Time, Molecular Ion (M+), Common Fragment Ion (M-57) and SIM Ions of FFAs Following TBDMS Derivatives
Free fatty acids Retention time
(min.) M.W. M+ (M-57) Quantification ion,
Confirmation ion Caprylic acid (C8)
Capric acid (C10)
Trans-2-decylenic acid (C10:1) Lauric acid (C12)
Myristic acid (C14) Palmitic acid (C16) Palmitoleic acid (C16:1) Stearic acid (C18) Octadecenoic acid (C18:1) Linoleic acid (C18:2)
13.95 17.90 18.90 21.80 25.00 28.10 28.78 31.00 30.80 30.50
144 172 170 200 228 256 254 286 284 282
258 286 284 257 342 370 368 398 396 394
201 229 227 257 285 313 311 341 339 337
201, 258 229, 286 227, 284 257, 314 285, 342 313, 370 311, 368 341, 398 339, 396 337, 394
over the concentration range of 0.01-2,000 g/ μ mL (r
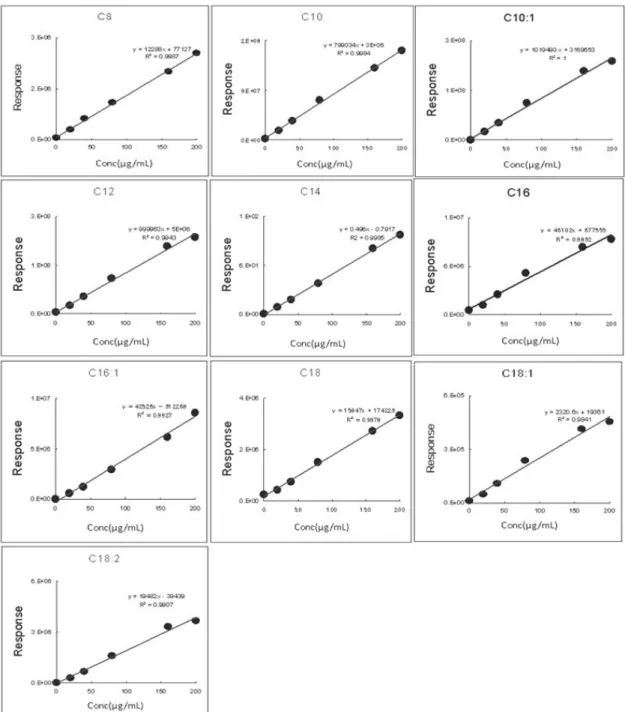
2≥ 0.99) (Table 2). Calibration curves were plotted by the peak area ratio of analyte to IS against the analyte concentration using control human pooled plasmas spiked at various concent- rations.
The regression equation and correlation coef- ficients were presented in Fig. 3. The calibration curve showed an excellent linearity with a corre- lation coefficient of greater than 0.99 for all com- pounds except 0.9832 and 0.9841 for C16 and C18:1 respectively. This wider linear range allow
Fig. 2. Mass spectra of free fatty acids (C8-C18:1) following TBDMS.
Table 2. Linear Range, LOD, and LOQ for Free Fatty Acids
Free fatty acids
Linear Range ( g /mL)μ
LOD (ng)
LOQ (ng) C10
C10:1 C12 C14 C16 C16:1 C18 C18:1 C18:2
0.01-2,000 0.01-2,000 0.01-2,000 0.01-2,000 0.01-2,000 0.01-2,000 0.01-2,000 0.01-2,000 0.01-2,000
3.3 2.4 2.2 1.8 0.9 2.2 2.8 8.8 6.6
33 24 22 18 9 22 28 88 66 Abbreviations: LOD, 3X signal-to-noise ratio, LOQ, 10X signal-to-noise ratio.
us to determine the amount of free fatty acids in normal plasma as well as fatty acid oxidation dis- orders.
LOD ranged from 0.9 to 8.8 ng and LOQ ranged from 9 to 88 ng (Table 2). LOD and LOQ from
our method permits the successful detection and quantification of FFAs . Intra-day and inter-day assay was measured (Table 3, 4).
Fig. 3. Calibration curve of free fatty acids (C8-C18 ) standard solution spiked to plasma.
Discussion
In a previous report
20-24), we verified that the TBDMS derivatives of FFAs possess superior GC and MS properties. In most of their El mass spectra, [M-57]
+high- mass ions generated by preferential cleavage of the labile tert.-butyl func- tion from molecular ions constituted base peaks with a few exceptions
24). Thus, for profiling an- alysis of FFA mixtures in SIM acquisition mode, [M-57]
+ions were selected as the single ion to be monitored for all FFAs. Under the present GC- MS condition, the retention time of each drug was very precise with reproducibility of 0.20% or bet- ter. Therefore, the start time of SIM activation
was programmed from 8.0 to 35.0 min to set up six groups of ions to be monitored (Table 1).
Among the dwell times tested, 80 ms was found to yield the highest ion abundance for most of the FFAs.
Previous report presented that determination of trace FFAs in plasma was difficult due to the presence of interfering biogenic organic acids at much higher concentrations. Therefore, plasma matrix effects on SIM detection were examined with plasma extracts prepared from blank plasma using our developed method in partition mode.
Those were recovered more efficiently within a shorter time (20 min), and required smaller amounts of plasma (100 L). µ
The typical total ion chromatogram of blank
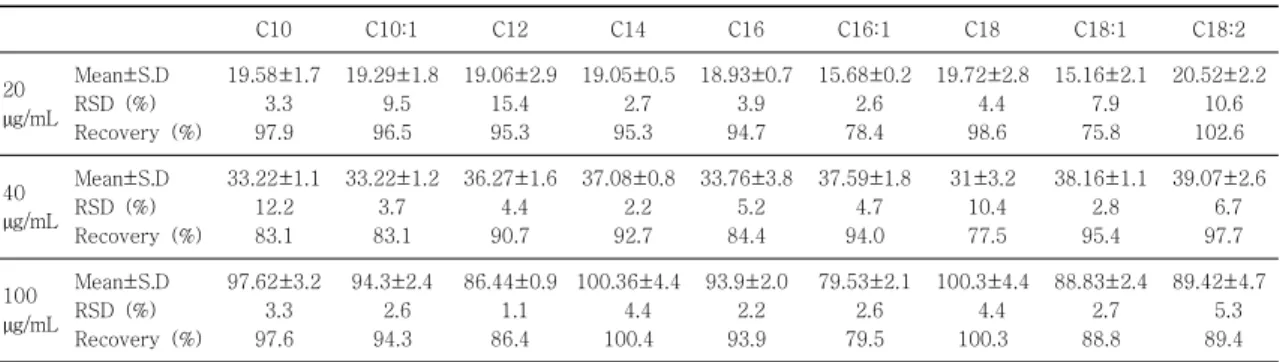
Table 3. Intra-day Precision and Recovery for QC Samples Spiked in Plasma (n=5)C10 C10:1 C12 C14 C16 C16:1 C18 C18:1 C18:2
20 g/mL µ
Mean S.D± RSD (%) Recovery (%)
19.58 1.7± 3.3 97.9
19.29 1.8± 9.5 96.5
19.06 2.9± 15.4 95.3
19.05 0.5± 2.7 95.3
18.93 0.7± 3.9 94.7
15.68 0.2± 2.6 78.4
19.72 2.8± 4.4 98.6
15.16 2.1± 7.9 75.8
20.52 2.2± 10.6 102.6
40 g/mL µ
Mean S.D± RSD (%) Recovery (%)
33.22 1.1± 12.2 83.1
33.22 1.2± 3.7 83.1
36.27 1.6± 4.4 90.7
37.08 0.8± 2.2 92.7
33.76 3.8± 5.2 84.4
37.59 1.8± 4.7 94.0
31 3.2± 10.4 77.5
38.16 1.1± 2.8 95.4
39.07 2.6± 6.7 97.7
100 g/mL µ
Mean S.D± RSD (%) Recovery (%)
97.62 3.2± 3.3 97.6
94.3 2.4± 2.6 94.3
86.44 0.9± 1.1 86.4
100.36 4.4± 4.4 100.4
93.9 2.0± 2.2 93.9
79.53 2.1± 2.6 79.5
100.3 4.4± 4.4 100.3
88.83 2.4± 2.7 88.8
89.42 4.7± 5.3 89.4 Abbreviations: S.D, standard deviation; RSD, precision calculated as relative standard deviation; Recovery, calculated as (mean calculated concentration/ nominal concentration) 100.×
Table 4. Inter-day Precision and Recovery for QC Samples Spiked in Plasma (n=10)
C10 C10:1 C12 C14 C16 C16:1 C18 C18:1 C18:2
20 g/mL µ
Mean S.D± RSD (%) Recovery (%)
20.64 1.1± 5.6 103.2
20.09 1.9± 9.5 100.5
18.98 0.2± 1.1 94.9
19.14 0.4± 2.3 95.7
19.73 1.0± 5.1 98.7
18.54 1.0± 5.5 92.7
21.65 1.2± 5.5 108.3
19.07 1.0± 5.4 95.4
20.42 0.8± 3.9 102.1
40 g/mL µ
Mean S.D± RSD (%) Recovery (%)
37.2 1.3± 3.6 93.0
36.62 2.9± 8.1 91.6
36.8 1.9± 5.3 92.0
37.2 3.0± 2.0 93.0
37.33 2.4± 8.1 93.3
36.74 1.8± 4.8 91.9
36.55 1.5± 4.0 91.4
35.63 2.6± 7.4 89.1
37.91 2.5± 6.5 94.8
100 g/mL µ
Mean S.D± RSD (%) Recovery (%)
96.34 1.0± 1.1 96.3
96.15 6.1± 6.3 96.2
86.43 1.2± 1.4 86.4
95.83 3.1± 3.3 95.8
92.09 3.2± 3.5 92.1
82.88 3.6± 4.4 82.9
98.31 3.7± 3.8 98.3
82.52 4.3± 5.3 82.5
97.42 5.4± 5.5 97.4 Abbreviations: S.D, standard deviation; RSD, precision calculated as relative standard deviation; Recovery, calculated as (mean calculated concentration/ nominal concentration) 100.×
plasma extracts obtained in scanning mode shows a good plasma fatty acid profile (data not shown).
When the same extract was analyzed in SIM mode, complete resolutions with no interferences are more clearly depicted in the individual ion chro- matograms (Fig. 2).
For method validation, accuracy was determined as the ratio of back-calculated value to the no- minal standard concentration and precision as the
% CV of peak areas from replicate analyses for intra-day (n=5) and for inter-day (n=5). Accuracy was calculated as: [measured concentration]/[no- minal concentration] 100%. Precision and re × - covery of the method were evaluated on standard spiked plasma at low (20 g/mL), medium (40 µ g/mL), and high (100 g/mL) quality control
µ µ
concentrations. The precision was calculated in terms of relative standard deviation (RSD) and evaluated as 1.1 to 15.4% for intraday assay and 1.1 to 9.5 % for inter-day assay. The precision was found in accordance with the validation criteria i.e. 1 to 15%. Recovery of FFAs ranged from 75.8 to 102.6% for intra-day assay and 82.5 to 108.3
% for inter-day assay (Table 3, 4).
Fatty acid β -oxidation (FAO) plays a pivotal role in energy homoeostasis, but it competes with glucose as the primary oxidative substrate. The mechanisms behind this so-called glucose fatty – acid cycle operate at the hormonal, transcriptional and biochemical levels. Inherited defects for most of the FAO enzymes have been identified and characterised and are currently included in neo- natal screening programmes. Symptoms range from hypoketotic hypoglycaemia to skeletal and cardiac myopathies. The pathophysiology of these diseases is still not completely understood, ham- pering optimal treatment. Studies of patients and mouse models will contribute to our understanding of the pathogenesis and will ultimately lead to
better treatment.
Korean patients with Glutaric aciduria type 2 plasma, one of the fatty acid oxidation disorders was analyzed, which characterized clinically by fatal neonatal acidosis, hypoglycemia and a strong sweaty-feet odour. Biochemical features showed
‘ ’
a massive urinary excretion of glutaric and lactic acids. In free fatty acid profile, the excretion of C8 and C10 fatty acid was elevated compared to normal. In organic acid profile, it showed abnormal excretions of adipic, C8:1 dicarboxylic acid, su- beric, C10:1 dicarboxyllic acid, sebacic, and he- xanoic acid. In addition, the plasma level of glutaric acid was greatly elevated
Conclusion
A sensitive, and selective analytical method of FFAs was developed using GC-MS/SIM for the screening of fatty acid oxidation disorder. The method was validated and this method could pro- vide useful tool for the screening of fatty acid oxidation disorders where the places does not facilitate MS/MS.
References
1) Ng LK. Analysis by gas chromatography/mass spec- trometry of fatty acids and esters in alcoholic beve- rages and tobaccos. Anal Chim Acta 2002;465:309.
2) Horowitz JF, Klein S. Oxidation of non-plasma fatty acids during exercise is increased in women with ad- bominal obesity. J Appl Physiol 2000;89:2276.
3) Timmers D, Schrauwen P, Vogel JD. Muscular dia- cylglycerol metabolism and insulin resistance. Physiol Behav 2008;94:242.
4) Bravi E, Perretti G, and Montanari L. Fatty acids by high-performance liquid chromatography and evapo- rative light-scattering detector. J of Chrom A 2006;
1134:210.
5) Costa C.G, Dorland L, Holwerda U, Tavarse de al- meida I, Poll BT, Jakobs C, et al. Simultaneous ana- lysis of plasma free fatty acids and their 3-hydroxy
analogs in fatty acid b-oxidation disorders. Clin Chem 1998;44:463.
6) Moser AN, Kreiter N, Bezman L, Lu S, Raymond GV, Naidu S, et al. Plasma very long chain fatty acids in 3000 peroxisome disease patients and 29000 controls.
Annal Neurol 1999;45:100.
7) James AA, Martin AJP. Gas-liquid chromatography:
the separation and identification of the methyl esters of saturated and unsaturated acids from formic acid to n-octadecanoic acid. Biochem J 1956;63:144.
8) Lima ES, Abdalla DSP. High-performance liquid chro- matography of fatty acids in biological samples. Anal Chim Acta 2002;465:81.
9) Dixon RO. Development and testing of a detection method for liquid chromatography based on aerosol charging. Anal Chem 2002;74: 2930.
10) Ramos RG, Libong D, Rakotomanga M, Gaudin PP, Chaminade P. Comparision between charged aerosol detection and light scattering detection for the analysis of leishmania membrane phosphopipids. J of Chrom A 2008;88:1209.
11) Zeb A. Chemistry, and liquid chromatography methods for the analyses of primary oxidation products of tri- acylglycerols. Free Radic Res 2015;19:549.
12) Lam S, Grushka E. Labelling of fatty acids with 4- bromomethyl-7-methoxycoumarin via crownether ca- talyst for fluorometric detection in high performance liquid chromatography. J of Chrom A 1978;158:207.
13) Drange E, Lundanes E. Determination of long-chained fatty acids using non-aqueous capillary electrophoresis and indirect UV. J of Chrom A 1997;771:301.
14) Miwa H, Hiyama C, Yamamoto M. High-perfor- mance liquid chromatography of short and long chain fatty acids as 2-nitrophenlyhydrazines. J of Chrom A 1985;321:165.
15) Tsao FHC, Shanmuganayagam D, Zachman DK, Khosravi M, Flots JD, Meyer KC. A continuous fluo- rescence assay for the determination of calcium- dependent secretory phospholipase A2 activity in serum.
Clin Chim Acta 2007;279:119.
16) Persson XM, Blanchnio Z, Jensen MD. Rapid mea- surement of plasma free fatty acid concentration and isotopic enrichment using LC/MS. J Lipid Res 2010;
51:2761.
17) Zhang T, Chen S, Syed I, Stahlamn M, Kolar JM, Homan EA, et al. A LC-MS based workflow for measurement of branched fatty acid esters of hydroxy fatty acids. Nat Protoc 2016;11:747.
18) Aslan M, Ozcan F, Aslan I, Yuce G. LC-MS/MS analysis of plasma polyunsaturated fatty acids in type 2 diabetic patients after insulin analog initiation the- rapy. Lipids Health Dis 2013;12:169.
19) Viidanoja J. Quantification of short chain amines in aqueous matrices using liquid chromatogrpahy electro- metry ionization tandem mass spectrometry. J of Chrom A 2017;1480:106.
20) Mielniczuk Z, Mielniczuk E, Larsson L. Gas chro- matography-mass spectrometry methods for analysis of 2- and 3-hydroxylated fatty acids: application for endotoxin measurement. J of Microbiol Methods 1993;17:91.
21) Takemoto Y, Suzuki Y, Horible R, Shimozawa N, Wanders RJA, Kondo N. Gas-chromatography/mass spectrometry analysis of very long chain fatty acids, docosahexaenoic acid, phytanic acid and plasminogen for the screening of peroxisomal disorders. Brain Dev 2003;27:481.
22) Pietrogrande MC, Bacco D, Mercuriali M. GC-MS analysis of low-molecular-weight dicarboxylic acids in atmospheric aerosol: comparision between silylation and esterification derivatization procedures. Anal Bio- anal Chem 2010;396:877.
23) Xaikin V, Halket ZJ. A handbook of derivatives for mass spectrometry. IM publications. 2nd Edition.
Chapter 1. Page 6.
24) Schwenk WF, Berg PJ, Beaufrere B, Miles JM, Hay- mond MW. Use of t-butyldimethylsilylation in the gas chromatographic/mass spectrometric analysis of physiologic compounds found in plasma using electron- impact ionization. Anla Chem 1984;141:101.