Vol. 20, No. 4, pp. 32-37, August 2016
Fish Injured Rate Measurement Using Color Image Segmentation Method Based on K-Means Clustering
Algorithm and Otsu’s Threshold Algorithm
Dong-Bo Sheng*, Sang-Bong Kim*†, Trong-Hai Nguyen*, Dae-Hwan Kim*, Tian-Shui Gao* and Hak-Kyeong Kim*
(Received 12 April 2016, Revision 10 August 2016, Accepted 10 August 2016)
Abstract: This paper proposes two measurement methods for injured rate of fish surface using color image segmentation method based on K-means clustering algorithm and Otsu’s threshold algorithm. To do this task, the following steps are done. Firstly, an RGB color image of the fish is obtained by the CCD color camera and then converted from RGB to HSI. Secondly, the S channel is extracted from HSI color space. Thirdly, by applying the K-means clustering algorithm to the HSI color space and applying the Otsu’s threshold algorithm to the S channel of HSI color space, the binary images are obtained. Fourthly, morphological processes such as dilation and erosion, etc. are applied to the binary image. Fifthly, to count the number of pixels, the connected-component labeling is adopted and the defined injured rate is gotten by calculating the pixels on the labeled images. Finally, to compare the performances of the proposed two measurement methods based on the K-means clustering algorithm and the Otsu’s threshold algorithm, the edge detection of the final binary image after morphological processing is done and matched with the gray image of the original RGB image obtained by CCD camera. The results show that the detected edge of injured part by the K-means clustering algorithm is more close to real injured edge than that by the Otsu’ threshold algorithm.
Key Words:Image Segmentation, RGB, HSI, K-means Clustering Algorithm, Otsu’s Threshold Algorithm
*†Sang-Bong Kim(corresponding author) : Department of Mechanical Design Engineering, Pukyong National University E-mail : [email protected], Tel : 051-629-6158
*Dong-Bo Sheng : Department of Mechanical Design Engineering, Pukyong National University.
*Trong-Hai Nguyen : Department of Mechanical Design Engineering, Pukyong National University
*Tian-Shui Gao : Department of Mechanical Design Engineering, Pukyong National University
*Dae-Hwan Kim : Department of Mechanical Design Engineering, Pukyong National University
*Hak-Kyeong Kim : Department of Mechanical Design Engineering, Pukyong National University
― Nomenclature ― KMCA : K-means clustering algorithm OTA : Otsu’s threshold algorithm
R : Injured rate
Ni : Number of pixels of injured area N : Number of pixels of fish surface t
1. Introduction
Computer vision systems are being used increasingly in the food industry for quality assurance purposes. During the transport of fish, there were many injury events occurred by machines
and people. Checking the freshness of fish is needed for food quality. Image processing is a very powerful tool for food industrial inspection. There have been several researches for food quality evaluation by image processing techniques1,2). Detection for injured parts of a given object is essentially a segmentation problem. Several image analysis methods for the detection of the injured parts have been reported. McDonald et al.
investigated the possibility of image-based beef grading in some of the earliest studies in this area3). However, the results were not good. Storbeck et al.
measured a number of features of different fish species as they passed on a conveyor belt perpendicular to the camera with a high accuracy based on a neural network algorithm in 20014). Color detection methods have been used for detecting defects in chicken meat9), quality grading of beef10), and grading of beef with respect to fat marbling11). Shirinata et al. proposed a method of analyzing meat quality based on pattern recognition and texture analysis12). H. F. Ng proposed a defect detection method based on Valley-emphasis method5). H. Chakravorty et al. proposed a method of diseased area segmentation of fish image based on colour features with K-means clustering based on L*a*b* color space6). However, the result is not accurate. Specially, there are few researches for injured rate measurement about injured parts of fish.
In this paper, two methods to measure injured rate of fish surface based on color image segmentation using K-means clustering algorithm and Otsu’s threshold algorithm are proposed, and the performance of the two methods is compared.
2. Image processing system
2.1 System description
A computer vision system to calculate the injured rate of fish surface is constructed as shown as Fig.
1. The camera is a CCD color camera and the light is used to maintain the intensity of light. The image processing is done by computer and the fish is transported by a conveyor belt.
Fig. 1 Schematic diagram of the image processing system
2.2 Problem statement and injured rate calculation
When the targeted objected fish is given, the following problems must be solved.
1) The head including the eyes and the tail parts are cut or injured.
2) There are the various injured types on the fish surface such as scratch texture injury, puddle-cutting injury, surface- cutting injury, crush injury, etc.
3) The injured areas corresponding to the above types must be measured.
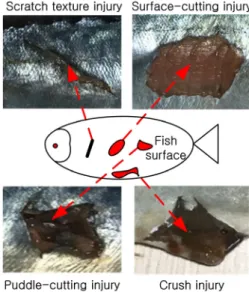
Fig. 2 Various types of injury on the fish surface
Various types of injury on the fish surface are shown in Fig. 2. Scratch texture injury is injury on the fish surface caused by friction with something rough or sharp. Puddle-cutting injury is injury on the fish surface which looks like a puddle caused by something sharp. Surface-cutting injury is injury on the fish surface cut by something sharp. Crush injury is injury on the fish surface, especially the belly part, caused by an object compressed.
In this paper, only the surface-cutting injury type is considered and an injured rate of fish surface R can be calculated by Eq. (1). By using the pixels of an injured part as the black area and total pixels of fish surface as shown in Fig. 2, it can be calculated.
× (1)
where and are the pixels of injured area on the image of fish and the total pixels of total surface area of fish, respectively.
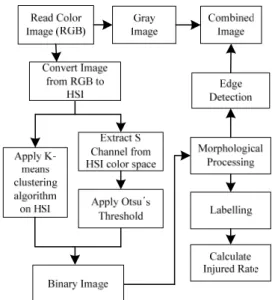
2.3 Injured rate calculation process The process to obtain the injured rate of fish using the proposed image processing system is shown as Fig. 3.
In Fig. 3, HSI color space is used because the luminance of the fish’s injured part is different from the good surface part. The binary image is obtained after K-means clustering algorithm (KMCA) mentioned in section 2.4 and Otsu’s threshold algorithm (OTA) mentioned in section 2.5. To remove the unnecessary part, morphological processes such as dilation and erosion are applied and labelling is adopted to count number of pixels.
Finally, the injured rate of fish surface is calculated by Eq. (1), and the Canny edge detection method is adopted to the binary image after morphological processing. To compare the performance of the two methods, the combined image is obtained using gray image and edge image.
Fig. 3 Flowchart of calculating the injured rate of fish
2.4 K-means clustering algorithm
K-means clustering is a partitioning algorithm for grouping objects so that within-group variance is minimized7) as follows:
Step 1) Initialize K class centers randomly as
⋯ these centers represent initial group centroids.
Step 2) Calculate the value of histogram bin value distance between each image pixel. Distribute the samples among the K clusters using relation as follows:
∈ i f∥ ∥∥ ∥ (2)
for all ⋯ ⋯ ≠ where
denotes the set of samples whose cluster centre is .
Step 3) Calculate the new cluster centres
⋯ such that the sum of the squared distances from all points in to the new cluster centre is minimized. Therefore, the new cluster centre is given by
∈
⋯ (3)
where is the number of sample in . Step 4) Repeat steps 2 and 3 until the
for ⋯ and the procedure is terminated.
2.5 Otsu’s threshold algorithm
Otsu’s threshold is applied to the S channel of HSI color space8). Otsu proposed the concept of the maximum classes’ variance method. OTA is greatly used to segment the image because it is simple in calculation, less time consuming and effective. This algorithm segments the image by automatically selecting the threshold value of S channel image based on largest inter-class variance between injured area and non-injured area. The histogram of S channel based on HSI color space is shown as Fig. 4.
Fig. 4 Gray histogram of S channel
3. Experimental results
3.1 Results of image processing
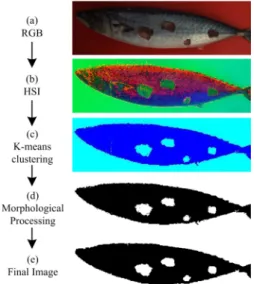
Figs. 5-6 show the results of image processing using K-means clustering algorithm and Otsu’s threshold algorithm based on S channel from HSI color space, respectively mentioned in section 2.3.
Fig. 5 Results of image processing based on KMCA
Fig. 6 Results of image processing based on OTA
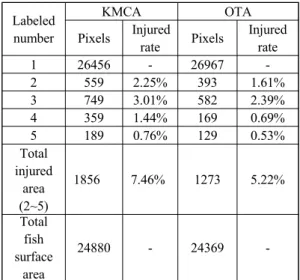
3.2 connected-component labeling To get each injured part’s pixel, the final image of K-means clustering algorithm and Otsu’s threshold algorithm are labeled as shown in Fig. 7 (a) and Fig. 7 (b). The numbers of injured area
pixels and injured rates of each labeled injured part are shown as Table 1. The size of final binary image is 414 x 124 pixels. In Table 1, labeled number 1 means the pixel numbers of background, and labeled number 2~5 are the injured areas. The total fish surface area can be calculated by subtracting the pixels of background from total image of 51,336 pixels. The injured rate and the area in KMCA are greater than those values in OTA.
Fig. 7 Total surface and labeled parts of fish
Table 1 Pixel numbers of labeled parts
Labeled number
KMCA OTA
Pixels Injured
rate Pixels Injured rate
1 26456 - 26967 -
2 559 2.25% 393 1.61%
3 749 3.01% 582 2.39%
4 359 1.44% 169 0.69%
5 189 0.76% 129 0.53%
Total injured
area (2~5)
1856 7.46% 1273 5.22%
Total fish surface
area
24880 - 24369 -
3.3 Edge matching
To compare the result of K-means clustering and Otsu’s threshold, their edge matchings are achieved as Fig. 8. Fig. 8 is the edge matching results of
K-means clustering algorithm and Otsu’s threshold algorithm. Figs. 9 (a2)~(a5) and (b2)~(b5) shows combined images using a gray image with edge matching of the injured parts to compare performance of KMCA and OTA, respectively. In Fig. 8 and Fig. 9, real injured edge is shown as the dotted line. The results show that the edge detection of K-means clustering algorithm is more close to the real injured edge than Otsu’s threshold method.
Fig. 8 Results of edge matching
Fig. 9 Results comparison by KMCA and OTA
5. Conclusions
In this paper, the results of measuring the injured rate of fish surface using color image based on K-means clustering algorithm and Otsu’s threshold algorithm were presented. After a series of image processing, the final binary image of a fish with injured area was obtained by KMCA and OTA,
respectively. By calculating the number of pixels, the injured rate was calculated. To compare the performances of two methods based on KMCA and OTA, the edge detection of final binary image after morphological processing was done and matched with the gray image of the original RGB image obtained by CCD camera. The results showed that the detected edge of an injured part by KMCA was more close to the real injured edge than that by OTA.
For further study, the performance, robustness and accuracy will be improved by using other algorithms like neural networks and genetic algorithm, and 3D image processing with the depth and volume of different injured types should be considered.
Acknowledgement
This research was a part of the project titled
‘Development of environment friendly plastic fish box and a logistics system’, founded by the Ministry of Oceans and Fisheries, Korea.
References
1. C. J. Du and D. W. Sun, 2003, “Recent Developments in The Applications of Image Processing Techniques for Food Quality Evaluation”, Trends in Food Science &
Technology, Vol. 15, No. 5, pp. 230-249.
2. Q. Z. Li, M. H. Wang and W. K. Gu, 2002,
“Computer Vision Based System for Apple Surface Defect Detection”, Computers and Electronics in Agriculture, Vol. 36, No. 2, pp.
215-223.
3. T. McDonald and Y. R. Chen, 1990, “ Separating Connected Muscle Tissues in Image of Beef Carcass Ribeyes”, Transactions of the ASAE, Vol. 33, No. 6, pp. 2059-2065.
4. F. Storbeck and B. Daan, 2001, “Fish Species Recognition Using Computer Vision and a Neural Network”, Fisheries Research, Vol. 51, No. 1, pp. 11-15.
5. H. F. Ng, 2006, “Automatic Thresholding for Defect Detection,” Pattern Recognition Letters, Vol. 27, No. 14, pp. 1644-1649.
6. H. Chakravorty, R. Paul and P. Das, 2015,
“Image Processing Technique to Detect Fish Disease”, International Journal of Computer Science and Security (IJCSS), Vol. 9, No. 2, pp.
121-131.
7. S. Ray and R. H. Rose, 1999, “Determination of Number of Clusters in K-means in Clustering and Application in Colour Image Segmentation”, Proceeding of the 4th International Conference on Advances in Pattern Recognition and Digital Techniques, pp. 137-143.
8. N. Otsu, 1979, “A Threshold Selection Method from Gray-level Histograms”, IEEE Transaction on Systems, Man and Cybernetics, Vol. 9, No.
1, pp. 62-66.
9. M. Barni, V. Cappellini and A. Mecocci, 1997,
“Color-based Detection of Defects on Chicken Meat”, Image and Vision Computing, Vol. 15, No.7, pp. 549-556.
10. K. Shiranita, K. Hayashi, A. Otsubo, T.
Miyajima and R. Takiyama, 2000, “Grading Meat Quality by Image Processing”, Pattern Recognition, Vol. 33, No.1, pp. 97-104.
11. F. Yoshikawa, K. Toraichi, K. Wada, N. Ostu, H. Nakai, M. Mitsumoto and K. Katagishi, 2000, “On a Grading System for Beef Marbling”, Pattern Recognition Letters, Vol. 21, No. 12, pp. 1037-1050.
12. K. Shiranita, T. Miyajima and R. Takiyama, 1998, “Determination of Meat Quality by Texture Analysis”, Pattern Recognition Letters, Vol. 19, No. 14, pp. 1319-1324.