186
FOREST SOCIETY
Growth and Tissue Nutrient Responses of Fraxinus rhynchophylla , Fraxinus mandshurica , Pinus koraiensis , and Abies holophylla Seedlings Fertilized with Nitrogen, Phosphorus, and Potassium
Byung Bae Park1*, Jae Kyong Byun2, Pil Sun Park3, Soo Won Lee4 and Woo Sung Kim1
1Division of Forest Ecology, Korea Forest Research Institute, 57, Hoegiro, Dongdaemun-gu, Seoul 130-712 Korea
2Division of Forest Restoration, Korea Forest Research Institute, 57, Hoegiro, Dongdaemun-gu, Seoul 130-712 Korea
3Department of Forest Sciences, Seoul National University, 599 Gwanak-ro, Gwanak-gu, Seoul 151-921 Korea
4Forest Practice Research Center, Korea Forest Research Institute, 51, Jikdong-ri, Soheul-eup, Pocheon-si, Gyeonggi-do 487-821
Abstract :Fertilization increases the crop productivity and produces high quality seedlings for plantation.
We quantitatively measured both physical performances and nutrient responses of Fraxinus rhynchophylla, Fraxinus mandshurica, Pinus koraiensis, and Abies holophylla seedlings, which are commercially planted species in Korea, to nitrogen, phosphorus, and potassium fertilization. We analyzed the growth performances by using Dickson’s quality index (QI) and the nutrient status by using vector diagnosis. Nitrogen or phosphorus treatment increased height and root collar diameter growth of F. rhynchophylla and F. mandshurica, however, did not increase those of P. koraiensis and A. holophylla. The order of QI was N > P > K > control for F. rhynchophylla, P≥N > Control≥P for F. mandshurica, P > Control≥K > N for P. koraiensis and A.
holophylla. In F. rhynchophylla, fertilization diluted N concentration in tissues by 5-25% because growth responses were higher than fertilization uptake. P. koraiensis and A. holophylla showed N excess showing
“toxic accumulation”. F. rhynchophylla and F. mandshurica showed P deficiency with P fertilization, however, P. koraiensis and A. holophylla showed “luxury accumulation”. Vector diagnosis indicated that more fertilization was applicable for F. rhynchophylla and F. mandshurica, and high fertilization rates were inefficient for P. koraiensis and A. holophylla. Both QI and vector diagnosis can be applied to verify seedling quality in the light of growth responses and nutrient status in fertilization trials.
Key words :Dickson’s quality index, fertilization, nursery culture, vector diagnosis
Introduction
Commercial fertilizer has been applied on tree seed- ling production in nursery culture (Timmer, 1996; Son et al., 1998; Shin et al., 1999; Jacobs and Timmer, 2005).
Fertilization is the tool to increase the crop productivity and to improve seedling quality for forest plantation.
The benefits of fertilization during nursery culture are 1) to increase nutrient storage, 2) to enhance seedling growth, 3) to increase resistance to drought stress, freezing temperature, and disease, 4) to reduce seedling transplant shock, and 5) to improve initial survival rate and seedling outplanting performance (Carlson, 1981; Imo and Timmer, 1999; Quoreshi and Timmer, 2000).
Morphological and physiological characteristics of
seedlings are related with high survival rate and growth performance and are important for successful plantation establishment. Seedling quality depends on several factors such as seedling dimensions (height, diameter), seedling weights (shoot, root, and whole seedling), indices (height to diameter ratio, root to shoot ratio, and Dickson’s quality index), and seedlings physiological characteristics (vigor, nutrient balance, and photosynthetic capacity) (Timmer, 1996; Davis and Jacobs, 2005; Bayala et al., 2009).
Although we know the improvement in the growth and nutrient status is evident after fertilization, we have only limited quantitative and statistical understood in both physical performances and nutrient responses. We used vector diagnosis, which is traditionally used to assess the relationship between plant growth and nutrient status to investigate the seedling responses to nutrient supply (Timmer and Stone, 1978; Imo and Timmer, 1999; Quoreshi and Timmer, 2000). This approach offers
*Corresponding author E-mail: [email protected]
a simplified interpretation of complex interactions between plant nutrient concentration, content, and mass. Dickson’s quality index, which is one of the most appropriate indicators to predict early field performance, was also used to verify seedling quality (Bayala et al., 2009). The index is a combination of seedling dry weight, shoot to root dry weight ratio, and sturdiness quotient.
The objective of this study was to measure the responses of Fraxinus rhynchophylla, F. mandshurica, Pinus koraiensis, and Abies holophylla seedlings, which are commercially planted species in Korea, to nitrogen, phosphorus, and potassium fertilization. We analyzed growth performances and nutrient status of tree seedlings after fertilization by using Dickson’s quality index and vector diagnosis.
Materials and Methods 1. Study sites and species
This study was conducted in the Forest Practice Research Center (37° 45' E and 127° 09' W) located in Pochoen, Gyeonggi Province. The average temperature is 11.3oC, and annual precipitation is 1,365 mm (Kang et al., 2007).
F. rhynchophylla and A. holophylla seedlings were raised in the Yongmoon National Nursery Station located in Yangpyeong county, Gyeonggi Province. F. mandshurica seedlings were raised in the Pyeongchang National Nursery Station located in Pyeongchang county and P.
koraiensis seedlings were raised in a commercial nursery located in Yanggu county, Gangwon Province. F. rhyn- chophylla and F. mandshurica were sown in spring 2006. P. koraiensis were sown in spring 2005 and A.
holophylla were sown in spring 2004 and 2 year-old seedlings were transplanted in 2006.
2. Experimental treatments
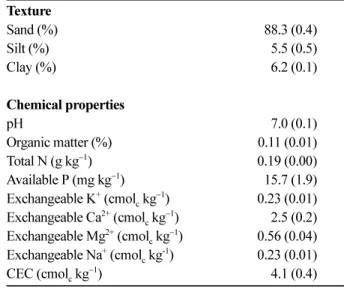
Similar height and root collar diameter (rcD) seedlings were planted at 30 L-plastic pots in April, 2007. Each pot had 5 cm depth gravels in the bottom and filled with soils. We randomly collected three samples to analyze soil chemical and physical properties. The soil analysis methods were the same as below. The soil was sandy and neutral in pH (Table 1). It had low organic matter and infertile in most nutrients.
We applied four treatments including no treatment as a control after four weeks planting (Table 2). We dug a gully with 3 cm in depth and 3 cm in width around the seedling and then the fertilizer was manually spread.
Nitrogen was applied as urea (CO(NH2)2) at 3.0 g tree−1, phosphorus as soluble superphosphate at 6.9 g tree−1, and potassium as potassium chloride (KCl) at 1.4 g tree−1. We randomly distributed all treatments with 15 repli-
cates. Total number of pots was 240 (4 species×4 treatments
×15 replicates).
One liter water was applied in each pot every two days. We removed all herbaceous plants in the pots dur- ing experiment. Initial height and rcD were measured on two weeks after planting. rcD were measured at 1 cm above the ground, which were marked with a white paint to measure the same position repeatedly.
3. Growth measurements
Height and rcD were measured on twenty weeks after the fertilization treatment. After measuring height and rcD, we randomly harvested six pots out of 15 ones for each treatment to measure biomass. Roots were cautiously exca- vated from the pots not to damage roots. Roots were washed with tap water several times to remove soil parti- cles from the root surface. We separated harvested seed- lings into foliage, stem, and roots. Unfortunately, we could not collect foliages of F. rhynchophylla and F. mandshu- rica because of abrupt freezing leaf fall. The divided tis- sues were oven dried at 65oC for one week and weighed.
4. Soil and plant analysis
Soil samples were collected before excavating seed- lings from the pots. One hundred g soil from each pot Table 1. Soil texture and chemical characteristics of the pot soil before fertilizer application. Total N is the sum of organic N and inorganicN. Available P and CEC represent H2PO4− and cation exchange capacity, respectively. Parenthesis is standard error (n = 3).
Texture
Sand (%) 88.3 (0.4)
Silt (%) 05.5 (0.5)
Clay (%) 06.2 (0.1)
Chemical properties
pH 07.0 (0.1)
Organic matter (%) 00.11 (0.01)
Total N (g kg−1) 00.19 (0.00)
Available P (mg kg−1) 15.7 (1.9) Exchangeable K+ (cmolc kg−1) 00.23 (0.01) Exchangeable Ca2+ (cmolc kg−1) 02.5 (0.2) Exchangeable Mg2+ (cmolc kg−1) 00.56 (0.04) Exchangeable Na+ (cmolc kg-1) 00.23 (0.01)
CEC (cmolc kg−1) 04.1 (0.4)
Table 2. Properties of applied fertilizer.
Treatments Applied amount (g tree−1)
Control 0
N N 1.4
P P 0.6
K K 0.7
was collected at 0-10 cm in depth and six samples per treatment were pooled to make one sample. All soil samples were kept in cool temperature until the anal- ysis.
Soil texture was measured by hydrometer method at 30oC and organic matter amount were measured by Tyurin method. Soil acidity (pH) was analyzed by 10 g soil mixing with distilled water with 1:5 ratio. Total nitrogen was analyzed by Micro – Kjeldahl method with 1 g soil. Available phosphorus (P2O5) was measured by Lancaster method. Exchangeable K+, Ca2+, and Mg2+
were determined in 1 N NH4OAc extracts with Atomic Absorption Spectrometer (AA280FS, USA). CEC was determined in 1 N HN4OAc and 1 N CH3COOH extracts by Brown method.
We pooled two seedlings by tissue to produce one sample per tissue. Oven-dried tissues were ground in a Wiley mill to pass 1 mm screen. Concentrations of N, P, and K were determined. Block digester (BD-46, Lachat Ins., USA) with combination of H2SO4 and HClO4 was used to digest organic matter. Total N and total P were determined by Automated Ion Analyzer (Quik Chem AE, Lachat Ins., USA) and K by Atomic Absorption Spec- trometer (AA280FS, USA).
5. Dickson’s quality index and vector analysis
Dickson’s quality index (Deans et al., 1989; Bayala et al., 2009) was calculated as follows: Quality index = SD/(HD+SR), where SD is seedling dry weight (g), HD is height (cm) to rcD ratio (mm), and SR is shoot dry weight (g) to root dry weight (g).
We used vector analysis (Haase and Rose, 1995;
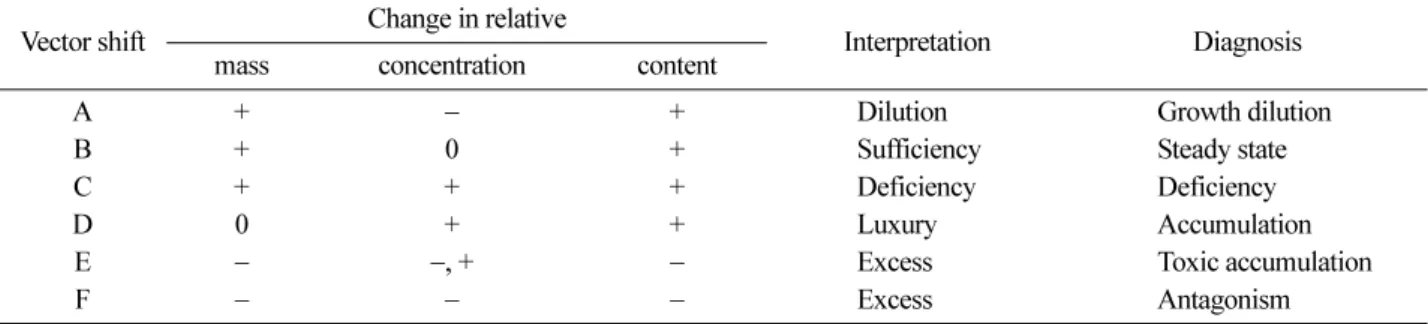
Timmer, 1996) to interpret changes in nutrient status in response to nutrient additions (N, P, and K) in the four species (Table 3, Figure 1). Nutrient deficiency is indi- cated when plant nutrient concentrations increase but not as much as mass and content (vector C). At optimal nutrition, concentrations remain constant while mass and content increase (vector B). Luxury consumption means that concentrations increase without changing mass (vec-
tor D). Toxicity is indicated if mass decreases (E, F). Dilu- tion (vector A) is most likely when growth limitation has been relieved by another element. Because we didn’t collect foliage samples from F. rhynchophylla and F. mandshurica, we used mass-weighted nutrient concentrations for relative concentrations.
6. Statistic analyses
We did not compare soil organic matter, pH, total N, available P, extractable K+, Ca2+, Mg2+, and CEC con- centrations among treatments because only one sample were collected from each treatment. Analysis of variance (ANOVA) with Duncan‘s multiple comparison tests was applied to test the effects of fertilization treatment and species on seedling height and rcD growth, biomass, and nutrient status. All probabilities were tested at the sig- nificant level at 0.05.
Table 3. The interpretation for vector analysis. The reference status (R) is usually normalized to 100. Vector shifts (A to F) indicate an increase (+), decrease (−) or no change (0) in dry mass and nutrient status relative to the reference status (Timmer, 1996).
Vector shift mass Change in relativeconcentration content Interpretation Diagnosis
A + − + Dilution Growth dilution
B + 0 + Sufficiency Steady state
C + + + Deficiency Deficiency
D 0 + + Luxury Accumulation
E − −, + − Excess Toxic accumulation
F − − − Excess Antagonism
Figure 1. Vector interpretations of directional changes in relative dry mass (m), nutrient content (t), and nutrient concentration (c) of plants grown at different fertilizer applications. Vector length reflects the magnitude of differences among individual plant parameters (modified from Timmer and Stone, 1978; Salifu and Timmer, 2003).
See table 3 for more vector interpretations.
Results and Discussion 1. Soil chemical properties
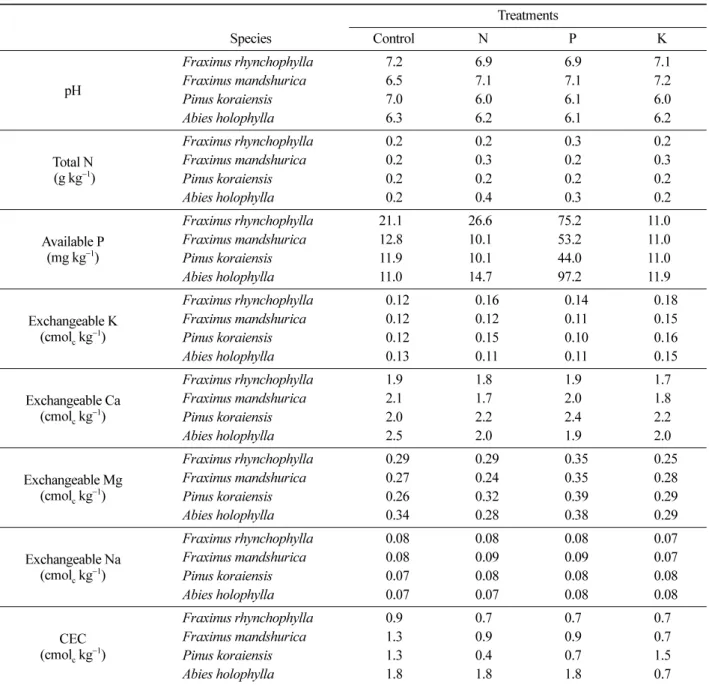
We could not analyze the change of soil properties before and after treatments and compare among treat- ments because of one sample per treatment, but cau- tiously say the patterns as below. Soil pH was not changed by treatments in F. rhynchophylla and F. mand- shurica, but fertilization treatment reduced pH in P.
koraiensis (Table 4). In A. holophylla, soil pH was reduced in all treatments including the reference after fertilization.
Total nitrogen and exchangeable Ca2+, Mg2+, Na+, and CEC in soil were not influenced by species and fertili- zation treatments. Available P was the highest in P treat- ment and exchangeable K+ was higher in K treated pots
than others.
Because nutrient uptake rate and amount depend on species and soil properties (Ingestad and Ågren, 1995;
Brady and Weil, 2002; Marschner, 2002), a understanding of the mechanisms by fertilization and species is needed to optimize seedling performances to fertilization (Jacobs and Timmer, 2005). Applied fertilizer is released into soil solution as ions, which are uptaken by roots or attached soil particles or leached out. Trees can uptake both NH4+ and NO3− forms for nitrogen source. If trees uptake NO3− over NH4+ and release of OH− from the root, soil pH is subsequently raised (Neumann and Romheld, 2001; Brady and Weil, 2002). In contrast, trees uptake NH4+ over NO3−, which leads to release H+ and results in soil acidification.
Table 4. Soil characteristics after fertilizer application and planting seedlings for 20 weeks.
Treatments
Species Control N P K
pH
Fraxinus rhynchophylla 07.2 06.9 06.9 07.1
Fraxinus mandshurica 06.5 07.1 07.1 07.2
Pinus koraiensis 07.0 06.0 06.1 06.0
Abies holophylla 06.3 06.2 06.1 06.2
Total N (g kg−1)
Fraxinus rhynchophylla 00.2 00.2 00.3 00.2
Fraxinus mandshurica 00.2 00.3 00.2 00.3
Pinus koraiensis 00.2 00.2 00.2 00.2
Abies holophylla 00.2 00.4 00.3 00.2
Available P (mg kg−1)
Fraxinus rhynchophylla 21.1 26.6 75.2 11.0
Fraxinus mandshurica 12.8 10.1 53.2 11.0
Pinus koraiensis 11.9 10.1 44.0 11.0
Abies holophylla 11.0 14.7 97.2 11.9
Exchangeable K (cmolc kg−1)
Fraxinus rhynchophylla 00.12 00.16 00.14 00.18
Fraxinus mandshurica 00.12 00.12 00.11 00.15
Pinus koraiensis 00.12 00.15 00.10 00.16
Abies holophylla 00.13 00.11 00.11 00.15
Exchangeable Ca (cmolc kg−1)
Fraxinus rhynchophylla 01.9 01.8 01.9 01.7
Fraxinus mandshurica 02.1 01.7 02.0 01.8
Pinus koraiensis 02.0 02.2 02.4 02.2
Abies holophylla 02.5 02.0 01.9 02.0
Exchangeable Mg (cmolc kg−1)
Fraxinus rhynchophylla 00.29 00.29 00.35 00.25
Fraxinus mandshurica 00.27 00.24 00.35 00.28
Pinus koraiensis 00.26 00.32 00.39 00.29
Abies holophylla 00.34 00.28 00.38 00.29
Exchangeable Na (cmolc kg−1)
Fraxinus rhynchophylla 00.08 00.08 00.08 00.07
Fraxinus mandshurica 00.08 00.09 00.09 00.07
Pinus koraiensis 00.07 00.08 00.08 00.08
Abies holophylla 00.07 00.07 00.08 00.08
(cmolCEC c kg−1)
Fraxinus rhynchophylla 00.9 00.7 00.7 00.7
Fraxinus mandshurica 01.3 00.9 00.9 00.7
Pinus koraiensis 01.3 00.4 00.7 01.5
Abies holophylla 01.8 01.8 01.8 00.7
2. Growth responses
Nitrogen treatment reduced the survival rate by 77%
only in P. koraiensis, but did not affect in other species.
N treatment increased height growth in F. rhynchophylla and F. mandshurica, however, did not in P. koraiensis and A. holophylla (Figure 2). The patterns of rcD growth after N fertilization were similar to those of height growth.
In F. rhynchophylla, stem and root biomass were the highest in N treatment (Figure 3). In F. mandshurica, P treatment increased stem and root biomass. However, N treatment significantly reduced total biomass of P.
koraiensis and A. holophylla (Figure 3). Nitrogen fertilization of 1.4 g per seedling seems to be excess for the seedlings of P. koraiensis and A. holophylla resulting in biomass reduction and N toxic accumulation (Table 5, Figure 4). Similar results were reported in coniferous species as the growth of white spruce (Picea glauca) seedlings fertilized with ammonium nitrate was decreased due to soil acidity and Al toxicity (Teng and Timmer, 1995) and fertilization with high levels of ammonium- based fertilizer decreased root biomass and root length of Douglas-fir (Pseudotsuga menziesii) seedlings (Olsthoorn et al., 1991; De Visser and Keltjens, 1993). Because P.
koraiensis and A. holophylla have fixed growth form, these may use nutrients inside the body (or tiny nutrients
Figure 2. Height, root collar diameter (rcD), and height to rcD ratio (HD ratio) after fertilizer application.
Figure 3. Foliage, stem, root dry weight, and root to shoot ratio after fertilizer application. (a) Fraxinus rhynchophylla, (b) Fraxinus mandshurica, (c) Pinus koraiensis, and (d) Abies holophylla.
Table 5. Mean dry weight, height to root collar diameter ratio, shoot to root ratio, and Dickson’s quality index of Fraxinus rhynchophylla, Fraxinus mandshurica, Pinus koraiensis, and Abies holophylla.
Species Treatments Total dry weight
(g tree−1) HT to rcD ratio
(cm mm−1) Shoot to root ratio
(g g−1) Quality index Fraxinus
rhynchophylla
Control 38.0 5.09 0.31 7.0
N 94.8 5.51 0.24 16.5
P 60.6 4.13 0.25 13.8
K 46.9 4.72 0.27 9.4
Fraxinus mandshurica
Control 15.8 1.68 0.55 7.1
N 27.2 2.40 0.31 10.0
P 33.9 2.69 0.27 11.5
K 14.8 1.81 0.59 6.2
Pinus koraiensis
Control 15.0 2.45 1.15 4.2
N 11.3 2.77 1.62 2.6
P 17.6 2.50 1.41 4.5
K 14.9 2.53 1.34 3.8
Abies holophylla
Control 17.4 1.86 2.21 4.3
N 11.5 1.92 1.31 3.6
P 17.0 1.65 1.63 5.2
K 17.8 1.90 2.23 4.3
Table 6. Tissue nutrient concentrations (g kg−1) after fertilizer application (n=3). Foliage nutrient concentrations of F.
rhynchophylla and F. mandshurica were not available because of abrupt freezing leaf fall. Different letters represent significant differences between treatments at P = 0.05.
Treatments
Elements Species Control N P K
Foliage
N Pinus koraiensis 6.50 (0.30) 6.69 (0.21) 7.47 (0.26) 6.52 (0.15)
Abies holophylla 8.10 (1.94) 8.62 (0.99) 13.03 (0.67) 8.69 (1.62) P Pinus koraiensis 0.93 (0.06) b 0.90 (0.06) b 1.52 (0.18) a 0.91 (0.00) b
Abies holophylla 0.98 (0.14) b 0.87 (0.09) b 2.20 (0.07) a 1.05 (0.32) b
K Pinus koraiensis 5.14 (0.06) 5.24 (0.75) 5.61 (0.28) 6.09 (0.82)
Abies holophylla 3.15 (0.59) 3.35 (0.24) 5.11 (0.14) 3.89 (0.72)
Branch
N Fraxinus rhynchophylla 5.79 (0.50) 5.93 (0.34) 5.33 (0.54) 4.98 (0.71) Fraxinus mandshurica 8.76 (0.28) ab 8.53 (0.45) ab 6.73 (0.71) b 9.68 (0.63) a
Pinus koraiensis 3.59 (0.68) 5.82 (2.01) 4.10 (0.29) 2.60 (1.14)
Abies holophylla 5.00 (0.89) 5.22 (0.41) 7.00 (0.20) 5.09 (0.55)
P Fraxinus rhynchophylla 0.59 (0.05) b 0.61 (0.02) b 0.82 (0.07) a 0.62 (0.03) b Fraxinus mandshurica 1.06 (0.09) 1.03 (0.03) 1.10 (0.08) 1.03 (0.07)
Pinus koraiensis 0.63 (0.06) 0.79 (0.21) 0.91 (0.08) 0.67 (0.06)
Abies holophylla 0.86 (0.15) b 0.71 (0.06) b 1.43 (0.05) a 0.82 (0.16) b K Fraxinus rhynchophylla 4.01 (0.11) 4.15 (0.35) 3.30 (0.36) 4.01 (0.50)
Fraxinus mandshurica 4.15 (0.44) 5.05 (0.23) 4.67 (0.59) 4.92 (0.16)
Pinus koraiensis 3.02 (0.33) 2.30 (0.64) 2.97 (0.17) 3.51 (0.40)
Abies holophylla 4.11 (0.42) ab 2.93 (0.20) b 5.17 (0.40) a 4.55 (0.53) ab Root
N Fraxinus rhynchophylla 6.52 (0.81) 6.03 (0.30) 4.54 (0.92) 6.10 (1.64) Fraxinus mandshurica 8.59 (0.52) 8.75 (0.25) 8.14 (0.71) 9.56 (0.62)
Pinus koraiensis 4.89 (0.06) 5.97 (1.04) 5.17 (0.21) 5.21 (0.21)
Abies holophylla 6.47 (1.49) 6.30 (0.55) 6.05 (0.32) 5.22 (0.28)
P Fraxinus rhynchophylla 0.77 (0.08) ab 0.70 (0.09) b 1.04 (0.07) a 0.90 (0.05) ab Fraxinus mandshurica 1.13 (0.22) 1.15 (0.04) 1.55 (0.07) 1.18 (0.18) Pinus koraiensis 0.84 (0.00) b 0.74 (0.05) b 1.42 (0.08) a 0.96 (0.08) b
Abies holophylla 1.11 (0.36) 0.84 (0.10) 1.63 (0.08) 1.02 (0.31)
K Fraxinus rhynchophylla 8.94 (0.89) 6.91 (0.73) 7.48 (0.93) 9.17 (0.54) Fraxinus mandshurica 12.26 (1.02) 11.18 (0.70) 12.30 (0.51) 11.26 (0.76)
Pinus koraiensis 3.75 (0.15) 2.58 (0.89) 4.01 (0.43) 3.77 (0.25)
Abies holophylla 4.48 (1.08) 4.44 (0.36) 5.50 (0.14) 5.34 (0.61)
from outside) rather than uptake from outside for the planting year. To identify source of nutrient is above the present study, but more researches to trace nutrient retranslocation are needed to profoundly understand seedlings performances to fertilization (Salifu and Timmer, 2003). However, N or P fertilization improves photosynthesis and hence tree growth of F. rhynchophylla and F. mand- shurica, which have free growth form (Ingestad and Ågren, 1992).
The order of seedling quality index (QI) was N > P >
K > control for F. rhynchophylla, P≥N > Control≥P for F. mandshurica, P > Control≥K > N for P. koraiensis and A. holophylla (Table 5). QI is one of the best indices to evaluate seedling quality, however, to predict future
seedling performance is difficult (Bayala et al., 2009). In the light of QI, N or P fertilization may improve outplanting performances of F. rhynchophylla and F. mandshurica, but N fertilization may decrease those of P. koraiensis and A. holophylla. QI has two weak points: one is a relatively complex formula and the other is that seedlings should be destructed for measuring dry weight. Simple non-destructive measures should be developed as a good predictor of future outplanting performance of seedlings.
3. Vector analysis and interpretation
Total dry weight of F. rhynchophylla seedlings were increased 149% by N treatment, 59% by P treatment, and 23% by K treatment (Table 6). Total dry weight of
Figure 4. The relationship between N concentration, N content, and dry weight of Fraxinus rhynchophylla, Fraxinus mandshurica, Pinus koraiensis, and Abies holophylla.
F. mandshurica were the highest at P treatment with 115% increase. However, N fertilization decreased total dry weight of P. koraiensis and A. holophylla by 25%
and 34%, respectively. The substantial response in growth rate to N fertilization suggests that N may be the most effective fertilizer for F. rhynchophylla and F.
mandshurica.
In F. rhynchophylla, growth responses were higher than fertilization uptake indicating that fertilization diluted N concentration of the tissue (Figure 4). The N dilution was the highest in P fertilization. In F. mandshurica, P fertilization diluted N concentration, but N fertilization was sufficient because of no increase in N concentration with biomass increase. In P. koraiensis and A. holophylla, N
fertilization increased N concentration by 20% and 10%, respectively (Figure 4). These trees showed N excess showing “toxic accumulation”. P fertilization increased N concentration without biomass increase showing N luxury consumption. K fertilization rarely influenced on vector movements.
P fertilization increased P concentration and P content in all species even though the biomass of P. koraiensis and A. holophylla was decreased (Figure 5). F. rhyncho- phylla and F. mandshurica responded to P supply imply- ing that they were under P deficiency, however, P.
koraiensis and A. holophylla showed luxury accumula- tion. N fertilization showed steady state in P concentra- tion for F. rhynchophylla and F. mandshurica, but made
Figure 5. The relationship between P concentration, P content, and dry weight of Fraxinus rhynchophylla, Fraxinus mandshurica, Pinus koraiensis, and Abies holophylla.
toxic accumulation with antagonism for P. koraiensis and A. holophylla.
In F. rhynchophylla, N and P fertilization diluted K concentration, but K deficiency occurred in K fertiliza- tion (Figure 6). In F. mandshurica, N and P fertilization made K deficiency because of higher biomass increase than K uptake. In P. koraiensis and A. holophylla, all fertilizations showed K excess or luxury accumulation (Table 3).
In F. rhynchophylla and F. mandshurica, growth rate is much higher than uptake rate, so nutrient concentration in the tissue was diluted. For these trees, more fertilization can be applied. Vector diagnosis of P. koraiensis and A.
holophylla indicated that high application rates of N, P, or K are inefficient for short-term growth and nutrient responses. Therefore, low-frequent dosages are better than a single heavy application for those seedlings.
Conclusion
We cannot recognize not only luxury consumption but also dilution by only concentration data. The vector diagnosis, a graphical technique, seems well suited for illustrating changes in nutrient concentration, nutrient content, and dry weight in a single graph. It reduces subjective interpretation, even though in huge experimental
Figure 6. The relationship between K concentration, K content, and dry weight of Fraxinus rhynchophylla, Fraxinus mandshurica, Pinus koraiensis, and Abies holophylla.
variability.
The effects of fertilization depend on species, which mask the effects of different nursery management prac- tices. It is not easy to generalize good indicators with only morphological traits. More integrated approaches and ecophysiological evaluations in correlating with field performance should be studied.
QI and vector diagnosis seem to be the most appropriate indicators to predict the outplanting performance of studied trees, but non-destructive, simple and reliable nursery grading system should be developed to increase economic gains for reforestation.
Acknowledgements
Dr. Myong Jong Yi and Dr. Yowhan Son helped us to design the pot experiment. We thanked Mr. Wonguk Kim, Mr. Sung Yoon Park, and Ms. Youngsun Kim, who managed the field work and irrigated hundred pots. This project was supported by Korea Forest Research Insti- tute.
Literature Cited
1. Bayala, J., Dianda, M., Wilson, J., Ouédraogo, S. and Sanon, K. 2009. Predicting field performance of five irrigated tree species using seedling quality assessment in Burkina Faso, West Africa. New Forests 38: 309- 2. Brady, N.C. and Weil, R.R. 2002. The nature and prop-322.
erties of soils. 13rd edition. Prentice Hall, New York, USA. pp 960.
3. Carlson, W.C. 1981. Effects of controlled-release fer- tilizers on the shot and root development of outplanted western hemlock (Tsuga heterophylla Raf. Sarg.) seed- lings. Canadian Journal of Forest Research 11: 752- 4. Davis, A.S. and Jacobs, D.F. 2005. Quantifying root757.
system quality of nursery seedlings and relationship to outplanting performance. New Forests 30: 295-311.
5. De Visser, P.H.B. and Keltjens, W.G. 1993. Growth and nutrient uptake of Douglas-fir seedlings at different rates of ammonium supply, with or without additional nitrate and other nutrients. Netherland Journal of Agri- cultural Science 41: 327-341.
6. Deans, J.D., Mason, W.L., Cannell, M.G.R., Sharpe, A.L. and Sheppard, L.J. 1989. Growing regimes for bare-root stock of Sitka spruce, Douglas fir and Scots pine. 1. Morphology at the end of the nursery phase.
Forestry Supplement 62: 53-60.
7. Haase, D.L. and Rose, R. 1995. Vector analysis and its use for interpreting plant nutrient shifts in response to silvicultural treatments. Forest Science 41: 54-66.
8. Imo, M. and Timmer, V.R. 1999. Vector competition analysis of black spruce seedling responses to nutrient loading and vegetation control. Canadian Journal of Forest Research 29: 474-486.
9. Ingestad T. and Ågren G.I. 1992. Theories and methods on plant nutrition and growth. Phsiologia Plantarum 84:
177-184.
10. Ingestad T. and Ågren G.I. 1995. Plant nutrition and growth: Basic principles. Plant and Soil 168-169: 15- 11. Jacobs, D.F. and Timmer, V.R. 2005. Fertilizer-induced20.
changes in rhizosphere electrical conductivity: relation to forest tree seedling root system growth and function.
New Forests 30: 147-166.
12. Kang, H.S., Lim, J.H., Chun, J.H., Lee, I.K., Kim, Y.K.
and Lee, J.H. 2007. Invasion of Korean pine seedlings originated from neighbor plantations into the natural mature deciduous broad-leaved forest in Gwangneung, Korea. Journal of Korean Forest Society 96(1): 107- 13. Marschner, H. 2002. Mineral nutrition of higher plants.114.
2nd edition. Academic Press, San Diego, USA. pp 889.
14. Neumann, G. and Romheld, V. 2001. Root induced changes in the availability of nutrients in the rhizo- sphere. In: Waisel, Y., Eshel, A. and Kafkafi, U. (eds), Plant Roots: The Hidden Half. 3rd edition. Marcel Dekker, New York, USA. pp 617-649.
15. Olsthoorn, A.F.M., Keltjens, W.G., Baren, B.V., Hop- man, M.C.G. and Van Baren, B. 1991. Influence of ammonium on fine root development and rhizosphere pH of Douglas-fir seedlings in sand. Plant Soil 133: 75- 16. Quoreshi, M. and Timmer, V.R. 2000. Early outplanting81.
performance of nutrient-loaded containerized black spruce seedlings inoculated with Laccaria bicolor: A bioassay study. Canadian Journal of Forest Research 30: 744-752.
17. Salifu, K.F. and Timmer, V.R. 2003. Nitrogen retrans- location response of young Picea marianna to nitro- gen-15 supply. Soil Science Society of America Journal 67: 309-317.
18. Shin, J.A., Son, Y., Hong, S.G. and Kim, Y.K. 1999.
Effect of N and P fertilization on nutrient use effi- ciency of Pinus densiflora, Larix leptolepis, and Betula platyphylla var. japonica seedlings. Korean Journal of Environmental Agriculture 18(4): 304-309.
19. Son, Y., Kim, Z.S., Hwang, J.H. and Park J.S. 1998.
Fertilization effects on growth, foliar nutrients and extract concentrations in ginkgo seedlings. Journal of Korean Forest Society 87(1): 98-105.
20. Teng, Y. and Timmer, V.R. 1995. Rhizosphere phos- phorus depletion induced by heavy nitrogen fertiliza- tion in forest nursery soils. Soil Science Society of America Journal 59: 227-233.
21. Timmer, V.R. 1996. Exponential nutrient loading: a new fertilization technique to improve seedling performance on competitive sites. New Forests 13: 275-295.
22. Timmer, V.R. and Stone, E.L. 1978. Comparative foliar analysis of young balsam fir fertilized with nitrogen,
phosphorus, potassium, and lime. Soil Science Society of America Journal 42: 125-130.
(Received December 17, 2009; Accepted January 15, 2010)