압력커플링 정유압 변속기를 이용한 에너지 절감 유압시스템에 관한 연구 A Study of Energy Saving Hydraulic System
by A Pressure Coupling Hydrostatic Transmission 도황팅․안경관
H. T. Do and K. K. Ahn
접수일: 2011년 10월 29일, 수정일: 2012년 2월 24일, 게재확정일: 2012년 2월 25일
Key Words :Secondary Control(2차 제어), Pressure Coupling(압력 커플링), Braking Energy(제동에너지) Regeneration(재생), Hydrostatic Transmissions(정유압 변속기), Accumulator(어큐뮬레이터)
Abstract: Nowadays, the demand of energy saving is increasing more and more while the natural resources have been exhausted. Besides, the emission gas caused by vehicles has been being a serious environment problem.
Therefore, many studies have been carried out, especially focusing on braking energy regeneration, in order to save energy as well as reduce emission of mobile vehicles. In this paper, we propose a closed-loop hydrostatic transmission for braking energy regeneration with two configurations to reduce the energy consumption by recovering the braking energy. The effectiveness of the proposed system was verified by simulation. The simulation results indicated that the pressure coupling configuration gave better performance in comparison to flow coupling configuration about 40.8%, 61.7% and 53.8% reduction of fuel consumption in 10 mode, 10 mode modified profile and highway schedules, respectively.
안경관(주저자): 울산대학교 기계공학부 E-mail: [email protected], Tel:052-259-2282 도황팅: 울산대학교 대학원 기계자동차공학과
Nomenclature
A r1,2 : valve throttling area C : viscous friction coefficient C d : discharge coefficient
D max : max. Displacement of hydraulic machine J : moment of inertia of flywheel
K sv : DC gain of the mechanism
,max
E
k: max. Kinetic energy during deceleration n : adiabatic coefficient
p 0 : pre-charged pressure
p g : pressure of gas in accumulator p i : pressure at port of accumulator
p pcv1,2 : setting pressure of pilot check valve PCV1,2 p r : return line pressure
p s : driving/supply line pressure Q b : boost flow rate
Q i ,: ideal flow rate of hydraulic machine
Q ha : flow rate into accumulator Q l : loss flow rate of hydraulic machine Q mi : flow rate into the inlet port of the motor Q mo : flow rate from motor outlet port
Q pm : actual flow rate of hydraulic machine Q po : output flow rate of the pump Q r1,2 : flow rate via relief valve RV1,2 T ex : external torque
T l : loss torque of hydraulic machine T m : torque of hydraulic motor u(t): electric signal control
u 2 : displacement ratio of pump/motor PM2 V 0 : volume of hydraulic accumulator V f : fluid volume in the accumulator V h : volume of fluid in the hose a : displacement ratio
D : pressure difference p τ : time constant of DCM w : flywheel speed
δ : valve throttling area proportionality coefficient
Subscripts u : upper
l : lower
1. Introduction
Reduction of energy consumption is one of the most important topics in vehicle research. Many researches about saving energy have been done. In hydraulic systems, hydrostatic transmissions(HST), constant pressure systems(CPS), electro-hydraulic actuators(EHA) and secondary control systems with common pressure rails(CPR) have been considered for energy-saving. In a HST system, the velocity of the motor is continuously controlled by adjusting the pump flow rate. Thus, it is suitable for earth moving machines such as wheel loaders, tractors and forklifts, etc 1) . However, the HST system cannot recover kinetic energy of the load, consequently, restricting its energy-saving potential. A CPS system employs a flywheel with an auxiliary hydraulic machine so that it is able to recover kinetic energy of the load and reuse recovered energy. The CPS system studies in 2) and 3) have shown that these systems are adequate for mobile applications, such as vehicles. However, the flywheel in CPS makes noise when operating and the kinetic energy of flywheel is gradually decreasing according to time. In an EHA system, batteries or super-capacitors are employed to store kinetic energy of the load 4),14),15),16)
. The EHA system has high recovery efficiency and good performance but its applicability is restricted due to its low specific power with batteries and high price with super-capacitors. In a CPR system, two common rails are employed: a high-pressure line connected with high-pressure accumulators and a low-pressure line connected directly to a tank. The CPR system is applied to vehicles and shows much reduction of energy consumption, according to 5) and 6). To utilize the advantage of the above hydraulic systems, a closed-loop hydrostatic transmission is proposed for braking energy regeneration with two hydraulic accumulators. The proposed system can be switched between two configurations: flow coupling configuration and pressure coupling configuration for the comparison of the effect
of each configuration. The high pressure accumulator (HPA) plays an important role in the system, as discussed in 7). It functions as power source as well as energy storage to absorb the braking energy from the hydraulic pump/motor in braking time.
This paper is organized as follows: section 2 describes the proposed system and its operation; section 3 presents the mathematical model of the system;
section 4 presents the simulation and analysis of the simulation results. Finally, conclusions are presented in the last section.
2. System description
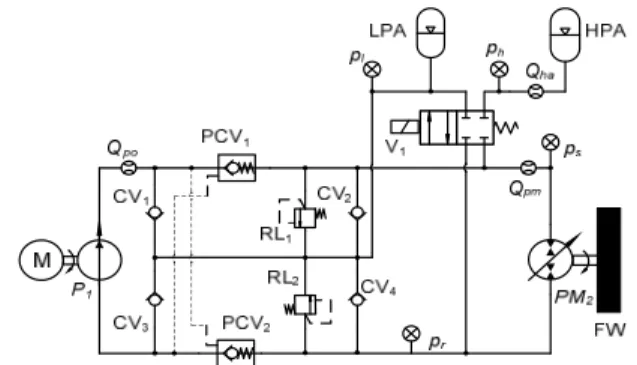
The proposed system is a hydrostatic drive which transmits the power from the electric motor to the load, the flywheel FW. In comparison with a traditional HST, a directional control valve and two hydraulic accumulators (HPA, LPA) are added (Fig. 1). The high-pressure accumulator HPA functions as a storage system or a power supply, while the low-pressure accumulator LPA functions as a low-pressure, high-flow source for the hydraulic machine pump/motor during decelerating, and boosts the system during accelerating.
The flywheel FW simulates external load. The secondary unit, the hydraulic pump/motor, could function as a hydraulic pump or a hydraulic motor depending on velocity, displacement and pressure difference between two ports of pump/motor.
Fig. 1 Schematic diagram of the proposed system
The proposed system can operate in two distinguished
configurations of hydraulic systems that are flow
coupling configuration and pressure coupling
configuration by controlling the directional control
valve.
2.1 Flow coupling configuration
Fig. 2 Flow coupling configuration
When V 1 is OFF, the system operates as a closed-loop flow coupling hydrostatic transmission with over-velocity protection mechanisms, as in Fig. 2. The velocity of the flywheel FW is controlled by adjusting the displacement of pump P 1 while the displacement of hydraulic machine PM 2 is fixed. When the velocity of the flywheel is greater than reference velocity, the pressure in return line pr becomes high, while the pressure in the driving/supply line ps becomes low.
Pilot check valve PCV 2 is then closed, and hydraulic energy in the form of high-pressure fluid is dissipated via the relief valve RL 2 . This function is similar to that of a hydraulic brake, which reduces the velocity of the flywheel FW under the reference velocity. As the velocity of the flywheel in an HST is reduced, the kinetic energy of the flywheel is dissipated by braking.
In the application of hydraulic vehicles, regenerative braking energy is substantial, so the recovery of regenerative energy may significantly reduce total energy consumption.
2.2 Pressure coupling configuration
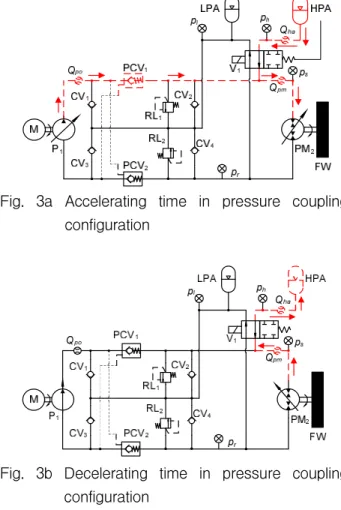
When V 1 is ON, the system operates as a closed-loop pressure coupling hydrostatic transmission, as shown in Fig. 3. In this configuration, pump P 1 is ON/OFF controlled to compensate the pressure of HPA. The velocity of the flywheel is controlled directly by adjusting the displacement of the hydraulic machine PM 2 .
In accelerating time, Fig. 3a, the driving line is connected to HPA while the return line is directly connected to LPA. The hydraulic machine PM 2
functions as a hydraulic motor that transfers the potential energy in the HPA into the kinetic energy of
the flywheel. To accelerate the flywheel, the displacement of PM 2 is increased, and vice versa. In decelerating time, Fig. 3b, the hydraulic machine PM 2
functions as a hydraulic pump that pumps fluid from LPA to HPA. The kinetic energy of the flywheel is transformed to hydraulic energy stored in HPA. When the displacement of the hydraulic machine PM 2
increases, the impeded torque in the shaft of PM 2 also increases, so that the velocity of the flywheel decreases rapidly.
Fig. 3a Accelerating time in pressure coupling configuration
Fig. 3b Decelerating time in pressure coupling configuration
3. Mathematical Model
3.1 Analysis of efficiency
The ideal flow rates, volumetric and mechanical efficiencies of the piston hydraulic pump are expressed in Eq. (1), (2) and (3), respectively:
max
Q
i= aw D (1)
i l
vP i
Q Q
h = Q -
(2)
max max
tPl
D p
D p T
h a a
= D
D + (3) The actual output flow rate and input torque of the pump are expressed in Eq. (4) and (5), respectively:
o i pV
Q = Q h (4)
max
i tPM
T = D a pD h (5)
3.1.1 Motor mode
The volumetric efficiency, mechanical efficiency, actual flow rate and actual output torque of the piston hydraulic motor are expressed by Eq. (6) ~ (9), respectively.
max max
vMloss
D
D Q
a w
h = a w + (6)
max
max loss tM
D p T D p h a
a
= D -
D (7)
i m
vM
Q Q
= h
(8)
max
m tM
T = D a pD h (9)
3.1.2 Electro-hydraulic displacement control mechanism (DCM)
An electro-hydraulic mechanism is employed to regulate the angle of the swash plate for control the displacement of the hydraulic pump/motor. A full order model of the system is a fifth-order system with voltage input and the angle of the swash plate or the displacement of the pump/motor. However, in practical application of hydraulic systems, a reduced first-order is often used instead of the full order model 9)-11) . In this study, a first-order model of the electro-hydraulic mechanism is used and expressed as:
( ) 1
sv sv
u t K K
t a a
= & +
(10)
3.2 Model of hydraulic accumulator
High pressure accumulator plays an important role in the switching closed loop HST. Its volume must be large enough to absorb the kinetic energy of vehicle during decelerating time but its size should be small because of the limit of space in vehicle. In such system, we employed bladder accumulator, which filled with nitrogen gas. According to 12), the nitrogen gas is
assumed to compress and expand based on the adiabatic gas law:
0 0 max min
n n n
pV = p V = p V (11) Then the fluid volume in the hydraulic accumulator HPA is derived as:
0 1 0 0
0,
(1 ) ,
i
f n
i
if p p
V p
V else
p ì £
= í ï ï -
î (12) The energy that can be absorbed by HPA is calculated as:
1 1 max 0
1
n n
p p
p V
E = n é ê l - l ù ú
- ë û (13) where,
max
pp l = p
(14) The optimal pre-charged pressure for maximum energy capacity of HPA is given by:
/(1 )
0 max
n n
p = n - p (15) And the maximum energy stored in HPA is given by:
/(1 )
max max 0
n n
E = p V n - (16) Then the volume of HPA is derived as:
,max
0 /(1 )
max
kn n
V E
p n -
= (17)
3.3 Model of connecting line 3.3.1 Flow coupling configuration
For simplicity, the pressure drop in the check valves is neglected, so the pressure before and after check valves is the same. Hydraulic accumulator LPA is large enough to make the pressure of accumulator constant.
The dynamic response of the valves can be ignored when compared with that of the flywheel or system pressures. In the driving line, pressure p s is expressed as:
( 1 )
s
po b r mi
h
dp Q Q Q Q
dt V
= b + - -
(18)
The return line is more sophisticated because the
pressures at motor outlet pr and pump inlet ppi may be
different depending on the state of the pilot check valve
PCV 2 . The pressure at the pump inlet port is expressed
as:
2
2
r s pcv
pi
l s pcv
p if p p
p p if p p
ì >
= í î £ (20)
Pressure p r plays an important role in the system dynamics, and is expressed by:
( 2 )
r
mo b r pi
h
dp Q Q Q Q
dt V
= b + - -
(21)
1,2
1,2 max
0,
( ) ,
rv r
rv rv
if p p
Q K p p p if p p p
ì D £
= í ï
D - D £ D £
ï î (22)
where
1,2 1,2
2
r d
K C A d k
= r
(23) The reference velocity of the flywheel at each instant is determined by the flow coupling principle expressed as:
p p vp vm
fl
m
D D w h h w =
(24) 3.3.2 Pressure coupling configuration
In the accelerating line pressure p s is expressed as:
( 1 )
s
po b ha r pm
h
dp Q Q Q Q Q
dt V
= b + - - -
(25) where,
Qpm is expressed by Eq. (8) in accelerating time and Eq. by (4) in decelerating time.
0 1
0
0 0
0,
(1 ) ,
i
ha k
i i
if p p
Q d p
V if p p
dt p
ì £
= ï í é ù
- £
ê ú
ï ë û
î (26)
s r
p p p
D = - (27) where p r is the returning line pressure, which is considered as the pressure in LPA in pressure coupling configuration.
3.3.3 Model of load
The dynamic equation of the flywheel FW is obtained by applying Newton’s second law, as:
(28)
where is external load torque.
4. Simulation and Results
To analyze the response of the proposed system for vehicle applications, this system was applied to a 2000kg vehicle. Final reduction gear ratio is 3.55 and the radius of wheel is 0.28m. We employed 10-mode profile schedule, one of the typical driving schedules for vehicle testing, as a velocity reference to evaluate the performance of the proposed system. Setting parameters of the system model for simulations are shown in Table 1.
Table 1 Setting parameters of the system
Components Capacity Unit
Hydraulic machine
displacement max pressure[-55 55]
250
cc/rev bar
Flywheel
inertial moment viscous friction coef.
4.5 0.01
kgm2 Nm/(RPM)
HPA
volume gas-pre-charge max pressure
20 120 280
liter bar bar
LPA
volume gas-pre-charge
50 2
liter bar
Electric motor
power speed
25 1160
HP rpm
The simulations have been carried out in the following two cases: flow coupling configuration and pressure coupling configuration, using a PID controller for velocity control in both cases.
Firstly, simulation was carried out in flow coupling configuration. Fig. 4 shows the velocity response, error and displacement ratio of pump P 1 , respectively in flow coupling configuration. This figure shows good performance in velocity response. The displacement a 1
of pump P 1 was regulated to achieve the reference
velocity while the displacement a 2 of motor PM 2 was
fixed at 0.9. The supply pressure and return pressure in
flow coupling configuration are shown in Fig. 5. The
supply pressure increases during the acceleration time
and decreases during the deceleration time. In the
contrary, return pressure increases during deceleration
time or braking time and decreases during acceleration
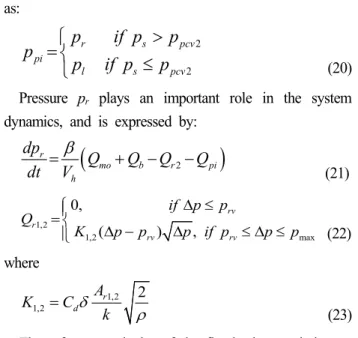
time. Fig. 6 shows the flow rate and fluid volume via
hydraulic machine PM 2 . In flow coupling configuration,
this flow rate proportional to the velocity of flywheel FW as shown in Eq.(24). The total fluid volume via PM 2 during 10 mode profile schedule is 61 liters. Fig.
7 indicates the supplied power and supplied energy by pump P 1 . The supplied power varies to meet the demand of hydraulic machine PM 2 in accelerating and decelerating time. The sum energy supplied to 10 mode profile is 307.8kJ.
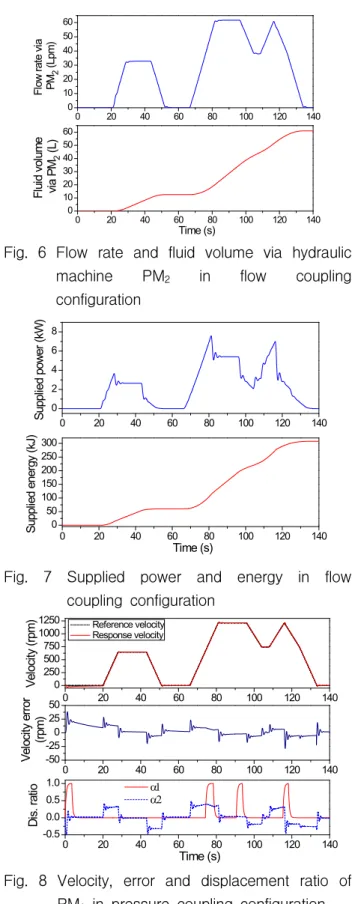
Secondly, simulation was carried out in pressure coupling configuration. Fig. 8 shows the velocity response, error and displacement ratio of hydraulic machine PM 2 , respectively. This figure shows that the velocity response is better in comparison with it in flow coupling configuration. The displacement of motor PM 2
is regulated to reach the required torque and velocity as the system pressure changes while the displacement ratio pump P 1 was ON/OFF controlled to maintain the pressure in the high pressure accumulator HPA in a specified interval.
0 20 40 60 80 100 120 140
0 200 400 600 800 1000 1200
0 20 40 60 80 100 120 140
-100 -50 0 50 100
0 20 40 60 80 100 120 140
-0.5 0.0 0.5 1.0
V e lo ci ty ( rp m )
Reference velocity Response velocityV e lo ci ty e rr o r (r p m )
a
1a
2D is . ra tio
Time (s)
Fig. 4 Velocity, error and displacement ratio of pump P 1 in flow coupling configuration
0 20 40 60 80 100 120 140
0 20 40 60 80
0 20 40 60 80 100 120 140
0 20 40 60 80 S u p p lie d p re ss u re (b a r) R e tu rn p re ss u re (b a r)
Time (s)
Fig. 5 Supplied pressure and return pressure in flow coupling configuration
0 20 40 60 80 100 120 140
0 10 20 30 40 50 60
0 20 40 60 80 100 120 140
0 10 20 30 40 50 60 F lo w r a te v ia P M
2( L p m )
Time (s) F lu id v o lu m e vi a P M
2( L )
Fig. 6 Flow rate and fluid volume via hydraulic
machine PM 2 in flow coupling
configuration
0 20 40 60 80 100 120 140
0 2 4 6 8
0 20 40 60 80 100 120 140
0 50 100 150 200 250 300
S u p p lie d p o w e r (k W ) S u p p lie d e n e rg y (k J)
Time (s)
Fig. 7 Supplied power and energy in flow coupling configuration
0 20 40 60 80 100 120 140
0 250 500 750 1000 1250
0 20 40 60 80 100 120 140
-50 -25 0 25 50
0 20 40 60 80 100 120 140
-0.5 0.0 0.5 1.0
V e lo ci ty ( rp m ) Reference velocity Response velocity
V e lo ci ty e rr o r (r p m )
a1 a2
D is . ra tio
Time (s)
Fig. 8 Velocity, error and displacement ratio of PM 2 in pressure coupling configuration
The flow rate into the high accumulator is maximum
until the pressure of HPA reaches to 160 bar and it is
zero until the pressure decreases to 135bar (Fig. 9 ~
10). The displacement of PM 2 is regulated to make
driving or braking torque as in Eq. (9). Therefore, its
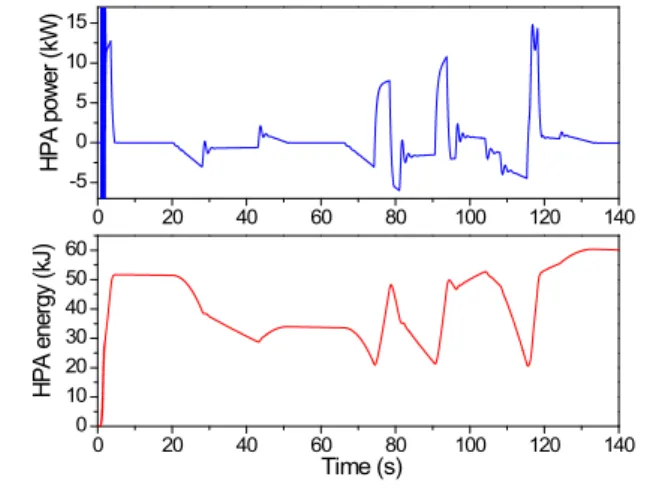
flow rate is positive in accelerating time and negative in decelerating time, and the sum of fluid via PM 2 is less than that of flow coupling configuration. The high pressure accumulator HPA stores energy from P 1 , supplies hydraulic energy to hydraulic machine PM 2 in accelerating time and absorbs it from PM 2 in decelerating time. The flow rate of HPA increases as the flow rate of P 1 increases or the flow rate of PM 2 is negative, and it decreases as the flow rate of PM 2
increases. HPA power and energy are shown in Fig. 11.
The supplied power and energy of pump P 1 are shown in Fig. 12. The supplied power is switched between zero and maximum value due to the displacement ratio of P 1 . The sum energy supplied to 10 mode profile schedule in this configuration is 182.2kJ. It means that 125.6kJ or 40.8% supplied energy was reduced compared to that of flow coupling configuration.
0 20 40 60 80 100 120 140
-20 -10 0 10 20 30 40 50 60
0 20 40 60 80 100 120 140
0 2 4 6 8 10 12 14
P
1PM
2F lo w r a te ( L p m )
P 1 PM 2
Time (s)
F lu id v o lu m e ( L )
Fig. 9 Flow rate and fluid volume of P1 and PM2 in pressure coupling configuration
0 20 40 60 80 100 120 140
-40 -20 0 20 40 60
0 20 40 60 80 100 120 140
0.0 0.5 1.0 1.5 2.0 2.5
0 20 40 60 80 100 120 140
0 50 100 150 H P A f lo w r a te (L p m )
H P A f lu id vo lu m e ( L ) H P A p re ss u re ( b a r)
Time (s)
Fig. 10 Input flowrate, fluid volume and pressure of HPA in pressure coupling configuration
0 20 40 60 80 100 120 140
-5 0 5 10 15
0 20 40 60 80 100 120 140
0 10 20 30 40 50 60
H P A p o w e r (k W )
Time (s)
H P A e n e rg y (k J)
Fig. 11 Power and energy of HPA in pressure coupling configuration
Besides 10 mode profile schedule, simulation was also carried out in case of modified 10 mode profile and highway schedule in the same way.
0 20 40 60 80 100 120 140
0 5 10 15
0 20 40 60 80 100 120 140
0 50 100 150 200
S u p p lie d p o w e r (k W ) S u p p lie d e n e rg y (k J)
Time (s)
Fig. 12 Supply power and energy in pressure coupling configuration
0 100 200 300 400 500 600 700 800 900
Highway 10 mode modified
S u p p lie d e n e rg y (k J)
Flow Coupling Pressure Coupling
10 mode