지
지상 상광 광학 학센 센서 서를 를 이 이용 용한 한 비 비파 파괴 괴 벼 벼 엽 엽 질 질소 소함 함량 량 추 추정 정
Estimation of Nondestructive Rice Leaf Nitrogen Content Using Ground Optical Sensors
김이현*·홍석영
Yi-Hyun Kim
*and Suk-Young Hong
농업과학기술원 토양관리과
National Institute of Agricultural Science and Technology(NIAST), Suwon 441-707, Korea
Ground-based optical sensing over the crop canopy provides information on the mass of plant body which reflects the light, as well as crop nitrogen content which is closely related to the greenness of plant leaves.
This method has the merits of being non-destructive real-time based, and thus can be conveniently used for decision making on application of nitrogen fertilizers for crops standing in fields. In the present study relationships among leaf nitrogen content of rice canopy, crop growth status, and Normalized Difference Vegetation Index (NDVI) values were investigated. We measured Green normalized difference vegetation index(gNDVI=(ρ ρ0.80㎛ ㎛-ρ ρ0.55㎛ ㎛)/(ρ ρ0.80㎛ ㎛+ρ ρ0.55㎛ ㎛)) and NDVI(ρ ρ0.80㎛ ㎛-ρ ρ0.68㎛ ㎛)/(ρ ρ0.80㎛ ㎛+ρ ρ0.68㎛ ㎛)) were measured by using two different active sensors (Greenseeker, NTech Inc. USA). The study was conducted in the years 2005-06 during the rice growing season at the experimental plots of National Institute of Agricultural Science and Technology located at Suwon, Korea. The experiments carried out with randomized complete block design with the application of four levels of nitrogen fertilizers (0, 70, 100, 130kg N/ha) and same amount of phosphorous and potassium content of the fertilizers. gNDVI and rNDVI increased as growth advanced and reached to maximum values at around early August, G(NDVI) were a decrease in values of observed with the crop maturation. gNDVI values and leaf nitrogen content were highly correlated at early July in 2005 and 2006. On the basis of this finding we attempted to estimate the leaf N contents using gNDVI data obtained in 2005 and 2006. The determination coefficients of the linear model by gNDVI in the years 2005 and 2006 were 0.88 and 0.94, respectively. The measured and estimated leaf N contents using gNDVI values showed good agreement (R
2=0.86
***). Results from this study show that gNDVI values represent a significant positive correlation with leaf N contents and can be used to estimate leaf N before the panicle formation stage. gNDVI appeared to be a very effective parameter to estimate leaf N content the rice canopy.
Key words : rNDVI, gNDVI, Leaf nitrogen, Correlation coefficients
서 언
식물조직과 상호작용하는 빛의 3가지 기작은 흡수율 (absorptance), 투 과 율 (transmittance), 반 사 율 (reflectance)로 구분되는데 빛의 일부분은 식물에 흡 수되어 광합성작용에 이용되고, 다른 일부분은 식물조 직을 그대로 통과하며, 나머지 일부분은 식물체에 의 해 표면에서 반사된다. 녹색식물의 잎은 광합성 색소 와 다른 식물색소에 의해 가시광선 영역(400~700 nm)의 복사선을 강하게 흡수하기 때문에 동일 영역
의 반 사 율 과 투 과 율 은 전 형 적 으 로 매 우 낮 은 (Christenen et al., 1993) 반면에 근적외선 영역 (700~1300 nm)의 복사선은 내부 세포질 입자들이나 색소들에 의한 흡수가 매우 낮기 때문에 반사율과 투 과율은 일반적으로 높다(Thomas et al., 1972).
질소는 작물의 생육과 수량을 결정하는 중요한 요소 로서 주어진 시기의 질소 영양상태는 다음 발육단계 의 생장량을 결정짓는데, 일반적으로 체내 질소농도가 높을 경우 건물생산량은 증가한다(Agren, 1985). 따라 서 질소 영양상태를 정확하게 진단하여 파악할 수 있 다면 다음 발육단계의 생육량을 예측할 수 있는 이점 이 있기 때문에 질소시비의 효율성을 높일 수 있고, 작물 상태의 정확한 진단은 질소의 시비관리에 중요 접 수 : 2007. 9. 18 수 리 : 2007. 10. 28
*연락저자 : Phone: +82312900281, E-mail: [email protected]
하다(Mae, 1986; Norman et al., 1992; Shoiji et al;
1986).
엽면적지수, 생체중, 건물중 등 작물의 생육상태를 직접 측정하거나 Kjeldahl 분석법에 의해 질소영양상 태를 분석하는 것이 정확하지만 많은 시간과 노력이 들고, 넓은 지역에 대한 생체정보를 얻는데 많은 한계 가 따른다(Ladha et al., 1998; Flowers et al; 2003).
따라서 최근에는 비접촉 및 비파괴적이고 신속하며, 원하는 시기에 측정할 수 있는 원격탐사 센서를 많이 이용하고 있다.
원격탐사 센서에서 얻어진 자료로부터 작물의 생물 리학적 특성을 나타내는 다양한 인자들을 밝혀내기 위해 군락의 파장별 반사율 평균치를 조합한 식생지 수 (Vegetation Indices)를 이용하는데 식생지수는 단 위가 없는 복사값으로 녹색식물의 상대적 분포량, 엽 면적지수, 엽록소함량 등과 관련된 지표로 사용된다.
지금은 20여종의 식생지수가 개발 되어 사용되어지고 있는데 그중에서 적색과 근적외선의 비를 이용한 정 규화 식생지수인 Normalized Difference Vegetation Index(NDVI)가 많이 이용되고 있고(Richardson et al; 1992), Gitelson et al. (1996)이 제안한 Green Difference Vegetation Index(gNDVI)의 경우 녹색작 물 생체량의 군락(Canopy) 변이를 평가하는데 NDVI 보다 유용하다고 확인되어지고 있다(Shanahan et al;
2001, Schepers, 2001). 군락반사측정 기술을 이용하여 군락반사율과 작물의 생육, 생체중, 식물체 피복도, 엽 질소함량 의 관계를 분석하고, 예측하는 시도가 꾸준 히 이루어져왔으며(Thomas et al., 1972; Best et al., 1985; Baret et al., 1991; Christenen et al., 1993;
Babara et al., 1995; Aparicio et al., 2000; Anna et al., 2001; Hong et al., 2002; Hong et al., 2004), 옥수 수와 밀의 경우, 질소 처리수준에 따른 군락의 분광반 사특성을 측정하였다(Walburg et al., 1982; Hinzman et al., 1986 Blackmer et al., 1996). Ryu et al. (2005) 은 높은 분광분해능으로 분광반사패턴을 연속적으로 측정하는 hyperspectral 센서를 이용하여 엽 질소함량 을 추정해 본 결과, 벼 출수기 때 GreenNDVI (585nm)와 엽 질소함량의 관계가 높게 나타났다.
우리나라의 경우 엽록소 측정 장치(SPAD-502, Minolta, JP)를 이용하여 엽록소 함량이나 질소 함량을
예측하는 시험 연구가 많이 이루어지고 있는데, 이는 질소영양 지표 중에서 엽 중 질소농도가 생육과 가장 밀접한 관련을 갖고 있고(Chapman et al., 1997), 엽 중 질소농도와 광합성량이 직선회귀관계가 있다는 보고 (Peng et al., 1993)에 기인한다. 하지만 엽의 두께나 측정 부위에 따라 엽록소함량이나 엽 질소함량이 차이 를 보여 SPAD값을 이용하여 엽 질소함량을 예측하기 에는 한계가 있는 것으로 생각된다(Piekielek et al., 1995). 따라서 센서와 엽 질소함량과의 관계에서 변이 차이를 줄이기 위해서 벼 군락에 대하여 광 흡수가 높 은 가시광선 영역과 광 반사 및 투과가 높은 근적외선 영역의 특성을 이용하여 엽 질소함량과의 관계를 비교 및 분석하는 것이 필요하다고 판단된다.
본 연구에서는 벼 군락의 분광반사율 지표를 측정 할 수 있는 인공광원을 사용하는 2종의 능동형 광학 센서(gNDVI, rNDVI)를 이용하여 질소처리 수준에 따른 벼 식생지수 변화를 알아보고, 시기별 식생지수 와 엽 질소함량의 관계를 구명하여 벼 군락의 엽 질 소함량을 추정하고자 하였다.
재료 및 방법
시험 포장 및 처리 내용 벼 생육시기별 식생지수 와 엽 질소함량의 관계를 구명하기 위해 지난 2년 동 안(2005년, 2006) 농업과학기술원 답작 포장에서 실험 을 수행하였으며 연도별 시험전 토양이화학성은 Table 1에서 보는 바와 같다. 본 실험포장의 공시토양 은 화동통으로 토성속은 식양질이며, 공시품종으로 추청벼를 사용하였고, 벼 이앙일은 5월 18일(2005년), 5월 17일(2006년)이었으며 수확일은 10월 11일(2005 년), 10월 13일(2006년)이었다. 질소수준별 시험구 면 적은 48 m2, 재식밀도는 30 x 15 cm 이었고, 난괴법 3반복으로 시험구 배치를 하였다. 시비처리는 질소의 경우 요소비료로 0, 70, 100, 130 kg ha-1 등 4수준 3반 복 처리하였고, 인산은 용과린, 칼륨은 염화칼륨으로 사용하여 토양검정 시비량에 따라 처리하였다.
시료채취 및 분석방법 토양화학성 분석은 농업과 학기술원 토양 및 식물체 분석법에 준하였고(NIAST, 2000), 채취한 토양은, 풍건 후 2 mm체로 통과된 것
Year
2005 2006
6.1 22 10.3 34 0.32 6.1 2.3 16.1 149
6.0 18 7 31 0.52 7.1 1.5 16.5 135
Available SiO2
Mg CEC Ca
K
Exchangeable cations Available
P2O5 NH4-N
OM pH
1:5 g kg-1 mg kg-1 mg kg-1 --- cmolckg-1--- mg kg-1 Table 1. Soil chemical properties of the experimental plot for fertilizer recommendation.
을 분석 시료로 사용하였다. 토양 pH는 토양과 증류 수의 비율을 1:5로 하여 측정하였으며, 유기물 함량은 Tyurin법으로 분석하였고, 유효인산은 Lancaster법을 이용하여 분석하였다. 치환성 양이온(K, Ca, Mg, Na) 은 pH 7.0 1N CH3COONH4로 치 환 후 ICP (Inductively Coupled Plasma)로 분 석 하 였 고 , C.E.C(Cation Exchange Capacity)는 pH 7.0 1N CH3COONH4로 추출한 후 kjeldahl 증류장치를 사용하 여 분석하였다.
식물체 분석은 시험구당 생육이 고른 벼 3주를 선 택하여 생체중, 초장, 경수를 측정한 다음, 70℃에서 건조하여 건물중을 측정한 후 분쇄하여 분석시료로 사용 하였다. 벼 잎을 HClO4+H2SO4로 분해하여 Micro-Kjeldahl 법으로 증류하여 엽 질소 분석을 하였 다 (NIAST, 2000). 엽면적지수는 LI-2000(LI-COR Inc., USA)을 이용해 측정하였다.
자료 분석 질소수준 및 생육시기별 식생지수와 엽 질소함량의 관계를 통계적으로 분석하기 위해 SAS 프로그램(Enterprise Guide 3.0)을 이용하여 상 관분석과 회귀분석을 수행하였다.
벼 군락의 분광반사 특성 벼 군락의 분광반사 특 성을 측정하기 위하여 능동형 광학센서인 Greenseeker (NTech Inc., USA) gNDVI(Green Normalized Difference Vegetation Index) 와 rNDVI(Normalized Difference Vegetation Index)을 이용하였다. 광학센서 는 센서 내에 탑재된 인공광으로부터 파장별로 빛을 조사하고, 조사된 빛에 대한 적색광/근적외광 또는 녹 색광/근적외광의 반사율을 조합하여 식생지수 값을 각각 얻었다. 광학센서와 작물과의 최적거리는 약 80 cm, 파장 검출 유효넓이는 약 60 cm이며 (Fig. 1), 센 서별 파장영역은 다음과 같다.
rNDVI=(NIR800nm-RED680nm)/(NIR800nm+RED680nm) gNDVI=(NIR800nm-GR550nm)/(NIR800nm+GR550nm)
결과 및 고찰
생육단계·질소수준에 따른 식생지수 변화 지난 2년 동안(2005, 2006년) 벼 생육시기에 따른 광학센서 의 반사율 지표인 식생지수 변화를 알아본 결과, 벼 이앙 후 gNDVI, rNDVI값 모두 증가하다가 수잉기 전후(8월 초순)를 정점으로 감소하는 추세를 보였다 (Fig. 2). 식생지수가 감소하기 시작하는 8월 초순의 경우 rNDVI값이 gNDVI값보다 높았지만, 9월 중순이 후 rNDVI값의 감소 폭이 크게 나타나 수확기에는 gNDVI값이 rNDVI값보다 높았다. 질소 수준에 따른 식생지수 변화는 무처리를 제외하고는 처리수준별 gNDVI값이 큰 변이는 나타나지 않았지만 처리수준에 따라 일정하게 식생지수 차이를 보였다.
질소시비수준과 식생지수의 관계 시계열 변화에 따른 질소시비수준의 관계를 통하여 질소처리 차이에 따른 식생지수의 변이정도를 알아보았다(Fig. 3). 벼 착근기(6월 5일), 유수형성기(7월 26일), 출수기(8월 16일), 수확기(10월 11일) 등 4시기에 G(NDVI)값 자 료와 시비수준의 관계를 분석한 결과, 벼 생육 초기인 착근기에는 질소처리수준에 따라 gNDVI와 rNDVI값 이 변이차이가 나타났지만 유수형성기 이후에는 변이 차이가 나타나지 않았다. 따라서 유수형성기 이후에 는 광학센서 반사율 지표가 질소시비수준과 밀접한 관계를 보여 시비수준 예측이 가능할 것으로 판단되 었다. 생육시기 초기에는 식생지수와 질소시비 수준 간에 변이차이가 나타났는데, 그 이유는 군락반사로 써 벼의 생육, 질소영양상태 등을 예측하고자 하는 경 우에는 군락이 어느 정도 형성되어야만 정확도를 높 일 수 있는데 군락의 피복도가 낮은 경우에 측정된 반사특성은 작물보다는 토양과 물표면 등 background 의 특성을 나타내기 때문이다(Dicker and Bausch, 2003).
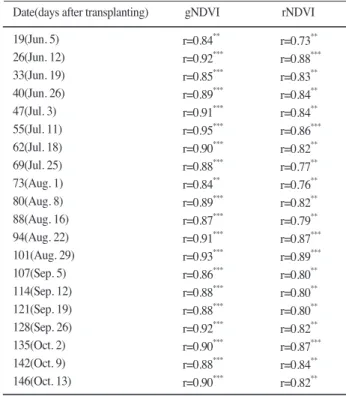
식생지수와 엽 질소함량의 관계 벼 생육시기별 센서로부터 얻어진 식생지수인gNDVI, rNDVI값과 단 위면적당 엽 질소함량과의 관계를 지난 2년 동안 (2005, 2006년) 분석하였다(Table 2, 3). 2005년은 벼 생육시기동안 9시기에서 얻어진 식생지수와 그 당시 시료를 샘플링하여 분석한 엽 질소함량과의 관계를 벼 출수전과 출수후로 구분하여 분석해 본 결과 gNDVI값은 출수전 보다 출수후가 엽 질소함량과의 상관관계가 높았고, 이앙 후 40일(6월28일)을 제외하 고는 gNDVI값이 rNDVI값보다 엽 질소함량과의 상관 Fig. 1. Greenseeker Optical Geometry (produced by
Oklahoma State University Precision Sensing Team).
계수가 높게 나타났다. 수확기에는 gNDVI와 엽 질소 함량의 상관계수가 0.93, rNDVI와 엽 질소함량의 상 관계수는 0.81로 나타나 두 센서 식생지수의 상관계수 차이가 크게 나타났다. 2006년은 20시기동안 생육시기 별 식생지수와 엽 질소함량의 상관분석을 수행하였는 데 그 결과 gNDVI값과의 상관이 rNDVI값과의 상관 보다 더 높게 나타났다. gNDVI와 엽 질소함량의 시 기별 상관계수를 살펴보면 착근기(6월 5일) 0.84**, 유 수형성기(7월 11일) 0.95***, 출수기(8월 16일) 0.87***, 수확기(10월 13일) 0.90*** 로 출수전의 경우 7월 11일 이 상관계수가 가장 높았고, 이 결과는 2005년 시험에 서도 7월 11일이 식생지수와 엽 질소함량의 상관계수 가 가장 높았던 (r=0.91***) 것과 일치하였다.
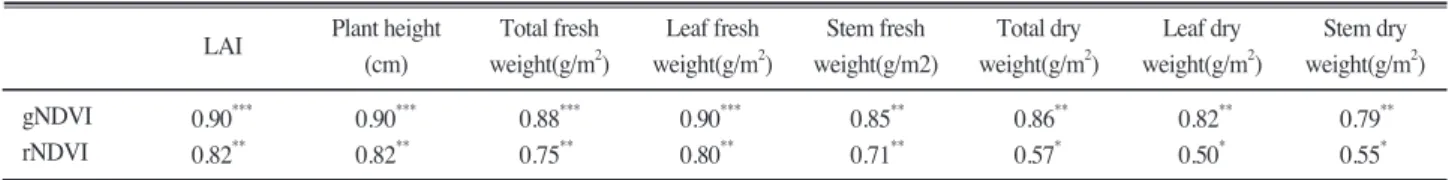
유수형성기 약 2주전(7월 11일)에 식생지수와 다른 작물생육인자와의 관계를 분석하였으며 그 결과는 Table 4와 같다. gNDVI값이 rNDVI값보다 엽면적지 수(Leaf Area Index), 초장(Plant height), 총생체중 (Total fresh weight), 엽생체중(Leaf fresh weight), 경생체중(Stem fresh weight), 총건물중(Total dry weight), 엽건물중(Leaf dry weight), 경건물중(Stem dry weight) 등 생육인자들과의 상관계수가 높았고, 벼 생육인자들의 상호관계의 경우, 엽면적지수와 생
체중, 건물중 등 다른 생육인자와 상관관계가 높게 나 타났다.
식생지수를 이용한 엽 질소함량 추정 유수형성기 이후의 질소영양상태는 수확기 쌀 단백질함량과 밥 맛 등에 영향을 끼치므로 유수형성기 전에 엽 질소함 량을 예측하고 수비량을 조정할 수 있다면 수확기 고 품질 쌀 생산에 기여할 것으로 생각된다. 이를 바탕으 로 gNDVI, rNDVI와 엽 질소함량의 상관관계가 높았 던 유수형성기 약 2주전 시기 (7월 11)에 측정한 2005년과 2006년의 식생지수 데이터를 이용하여 엽 질소함량의 관계를 추정식으로 작성하였다(Fig. 4).
2005년과 2006년에 실측한 엽 질소함량 값과 gNDVI 를 이용하여 추정값을 비교해 본 결과, 2005년과 2006 년의 결정계수가 각각 0.88, 0.94로 2006년이 더 예측 률이 높게 나타났다. rNDVI를 이용하여 엽 질소함량 을 추 정 한 결 정 계 수 가 2005년 0.75(2005년 )와 0.58(2006년)로 gNDVI보다 결정계수가 낮게 나타났 다. gNDVI값을 이용하여 엽 질소함량 추정값과 실측 값을 비교해 본 결과, 결정계수가 0.86으로 추정값과 실측값이 1:1선상에 근접하게 분포하였다(Fig. 5). 따 라서 gNDVI가 엽 질소함량 추정에 효과적으로 이용 Fig. 2. Temporal changes in gNDVI and rNDVI values of canopy during the growing season under different nitrogen levels in year 2005 and 2006.
할 수 있는 한 방법으로 판단되었다. 벼 유수형성기의 생육 및 질소영양상태는 생장, 수량 및 쌀의 품질에 큰 영향을 미친다.
유수형성기 이후 질소상태는 수량 sink형성 뿐 만 아니라 쌀 단백질함량, 맛 등 품질을 좌우하기 때문에 질소영양진단과 이에 따른 적정수비 처방 기술이 확 립되어야한다. 따라서 이삭거름 처리 전에 엽 질소함 량 및 생육인자와 상관관계가 높은 gNDVI를 이용하 여 단백질함량, 수량, 엽면적지수, 생체중, 건물중 등
Fig. 3. Relationship between gNDVI and rNDVI and nitrogen treatment levels with growth stages.
Date(days after transplanting) 40(Jun. 28)
53(Jul. 11) 64(Jul. 22) 83(Aug. 10) 89(Aug. 16) 98(Aug. 25) 105(Sep. 1) 125(Sep. 20) 146(Oct. 11)
r=0.70* r=0.91***
r=0.89***
r=0.88***
r=0.92***
r=0.92***
r=0.95***
r=0.96***
r=0.93***
r=0.86***
r=0.71* r=0.82**
r=0.85**
r=0.91***
r=0.91***
r=0.85**
r=0.93***
r=0.81**
rNDVI gNDVI
Table 2. Correlation coefficients between gNDVI and rNDVI and leaf nitrogen content in the rice canopy at different dates in year 2005.
Date(days after transplanting) 19(Jun. 5)
26(Jun. 12) 33(Jun. 19) 40(Jun. 26) 47(Jul. 3) 55(Jul. 11) 62(Jul. 18) 69(Jul. 25) 73(Aug. 1) 80(Aug. 8) 88(Aug. 16) 94(Aug. 22) 101(Aug. 29) 107(Sep. 5) 114(Sep. 12) 121(Sep. 19) 128(Sep. 26) 135(Oct. 2) 142(Oct. 9) 146(Oct. 13)
r=0.84**
r=0.92***
r=0.85***
r=0.89***
r=0.91***
r=0.95***
r=0.90***
r=0.88***
r=0.84**
r=0.89***
r=0.87***
r=0.91***
r=0.93***
r=0.86***
r=0.88***
r=0.88***
r=0.92***
r=0.90***
r=0.88***
r=0.90***
r=0.73**
r=0.88***
r=0.83**
r=0.84**
r=0.84**
r=0.86***
r=0.82**
r=0.77**
r=0.76**
r=0.82**
r=0.79**
r=0.87***
r=0.89***
r=0.80**
r=0.80**
r=0.80**
r=0.82**
r=0.87***
r=0.84**
r=0.82**
rNDVI gNDVI
Table 3. Correlation coefficients between gNDVI and rNDVI and leaf nitrogen content in the rice canopy at different dates in year 2006.
생육인자와 관계분석을 통하여 유수형성기 질소영양 상태의 비 파괴적 진단에 의한 수비 시용량을 제안하 고자하는 연구로의 발전이 필요하다.
적 요
본 연구에서는 인공광원을 사용하는 능동형 지상광 학센서(gNDVI, rNDVI)를 이용하여 질소수준 및 생 육단계별 벼 식생지수변화를 알아보고, 식생지수와 벼 엽 질소함량과의 관계를 구명하여 벼 군락의 엽 질소함량을 추정하고자 하였다.
생육단계에 따른 식생지수 변화는 2005년, 2006년 모두 gNDVI, rNDVI값은 이앙기 이후 급속히 증가하 다가 수잉기를 전후로 수확기에 이르기까지 감소하는 경향을 보였다.
gNDVI값은 rNDVI값보다 엽 질소함량과의 상관계 수가 높게 나타났고, 특히 벼 유수형성기 약 2주전에 상관계수가 높게 나타났으며, 엽 질소흡수량, 엽면적 지수, 생체중, 건물중 등 다른 생육인자의 상관관계에 서도 동일한 결과를 얻었다. 따라서 gNDVI와 엽 질 소함량의 상호관계에서 결정계수는, 2005년과 2006년 결정계수에 각각 0.88, 0.94였고, 2년간의 전체자료에 대한 관계에서도 엽 질소함량 실측값은 추정값과 비 교한 경향을 보이며 밀접한 관계를 보였다(R2=0.86).
이상의 결과로부터 gNDVI 식생지수는 이삭거름을 처리하기 전에 질소영양상태를 효과적으로 예측 할 수 있을 것으로 판단된다.
인 용 문 헌
Agren, G. I. 1985. Theory for growth of plants derived from the nitrogen productivity concept. Physiologia Plantarum. 64:17-28.
Anna, P., and B. Abdou. 2001. Application of hyperspectral remote sensing for LAI estimation in precision farming. Canadian Remote Sensing Symposium.
Aparicio, N., Villegas, D., Casadesus, J., Araus, J. L, and C. Royo.
2000. Spectral vegetation indices as non-destructive tools for determining durum wheat yield. Agronomy. J. 92:83-91.
Fig. 5. Relationship between leaf nitrogen measured by analysis and estimated by gNDVI on day after transplanting (July, 11) in year 2005 and 2006.
gNDVI rNDVI
0.90*** 0.90*** 0.88*** 0.90*** 0.85** 0.86** 0.82** 0.79**
0.82** 0.82** 0.75** 0.80** 0.71** 0.57* 0.50* 0.55*
Stem dry weight(g/m2) Leaf dry
weight(g/m2) Total dry
weight(g/m2) Stem fresh
weight(g/m2) Leaf fresh
weight(g/m2) Total fresh
weight(g/m2) Plant height
LAI (cm)
Table 4. Correlation coefficients between gNDVI and rNDVI and crop growth on July 11 in year 2005 and 2006.
Fig. 4. Relationship between gNDVI and rNDVI and leaf nitrogen contents on day after transplanting(July, 11) in year 2005 and 2006.
Barbara, J. Y., and R. E. Pettigrew-Crosby. 1995. Predicting nitrogen and chlorophyll content and concentrations from reflectance spectra at leaf and canopy scales. Remote Sensing of Environment. 53:199-211.
Baret, F., and G. Guyot. 1991. Potentials and limits of vegetation indices for LAI and APAR assessment. Remote Sensing of Environment. 35:161-173.
Best, R. G., and J. C. Harlan. 1985. Spectral estimation of green leaf area index of oats. Remote Sensing of Environment. 17:27-36.
Blackner, T. M., Schepers, J. S., Varvel, G. E, and E. A. Walter- shea. 1996. Nitrogen deficiency detection using shortwave radiation from irrigated corn canopies. Agronomy. J. 88:1-5.
Chapman, S. C., and H. J. Barreto. 1997. Using a chlorophyll meter to estimate specific leaf nitrogen of tropical maize during vegetative growth. Agronomy. J. 89:557-562.
Christensen, S., and J. Goudriaan. 1993. Deriving light interception and biomass from spectral reflectance ratio. Remote Sensing of Environment. 43:87-95.
Diker, K., and W. C. Bausch. 2003. Radiometric field measurements of maize for estimating soil and plant nitrogen. Biosystems Engineering. 86:411-420.
Flowers, M., R. Weisz, and R. Heiniger. 2003. Quantitative approaches for using color infrared photography for assessing in- season nitrogen status in winter wheat. Agronomy. J. 95:1189- 1200.
Gitelson, A, A., M. N. Merzlyak, and H. K. Lichtenthaler. 1996.
Detection of red edge position and chlorophyll content by reflectance measurements near 700nm. J. Plant Physiol. 148:501- 508
Hinzman, L, D., Bauer, M. E, and C. S. T. Daughtry. 1986. Effects of nitrogen fertilization on growth and reflectance characteristics of winter wheat. Remote Sensing of Environment. 19:47-61.
Hong, S, Y., K. A. Sudduth., N. A. Kitchen., S. T. Drummond., H.
L. Palm, and W. J. Wiebold. 2002. Estimating within-field variations in soil properties from airborne hyperspectral images. In Proc. Integrating Remote Sensing at the Global, Regional, and Local Scale (CD-ROM). November 10-15, 2002, Denver, CO.
Hong, S. Y., K. A. Sudduth., N. A. Kitchen., C. W. Fraisse., H. L.
Palm, and W. J. Wiebold. 2004. Comparison of remote sensing and crop growth models for estimating within-field LAI variability. Korean Journal of Remote Sensing. 20:175-188.
Ladha, J. K., A. Tirol-Padre., G. C. Punzalan., E. Castillo., U. Singh, and C. K. Reddy. 1998. Nondestructive estimation of shoot nitrogen in different rice genotypes. Agronomy. J. 90:33-40.
Mae, T. 1986. Partitioning and utilization of nitrogen in rice plants.
Japan Research Quality. 20:115-120.
National Institute of Agricultural Science and Technology. 2000.
Methods of soil and crop plant analysis. National Institute of Agricultural Science and Technology, RDA, Suwon, Korea.
Norman, R. J., D. Guindo., B. R. Wells, and C. E. Wilson. 1992.
Seasonal accumulation and partitioning of N_15 in rice. Soil Soc.
Am. J. 56:1251-1527.
Peng, S., F. V. Garcia., R. C. Laza, and K. G. Cassman. 1993.
Adjustment for specific leaf weight improves chlorophyll meter's estimate of rice leaf nitrogen concentration. Agronomy. J. 85:987- 990.
Piekielek, W. P., R. H. Fox., J. D. Toth and K. E. Macneal. 1995.
Use of a chlorophyll meter at the early dent stage of corn to evaluate nitrogen sufficiency. Agronomy. J. 87:403-408.
Richardson, A. J., and C. L. Weigand. 1992. Using Spectral Vegetation Indices to Estimate Rangeland Productivity. Geocarto International. 1:63-77.
Ryu, C. S., M. Suguri, and M. Umeda. 2005. Estimation the nitrogen contents and the rice quality using hyperspectral remote sensing technology. European Conference of Precision Agriculture 2005, 325-330.
Schepers, James. S. 2001. Practical applications of remote sensing.
Conference procedings of InforAg. August 7-9, Indianopolis.
Shanahan, J. F., J. S. Schepers., D. D. Francis., G. E. Varvel., W. W.
Wilhelm., J. M. Tringe., M. K. Schlemmer, and D. J. Major. 2001.
Use of remote-sensing imagery to estimate corn grain yield.
Agron. J. 93:583-589.
Shoiji, S. H., H. Ando, and G. Wada. 1986. Fate of nitrogen in paddy fields and nitrogen absorption by rice plants. Japan Research Quality. 20:127-134.
Thomas, J. R., and H. W. Gausman. 1977. Leaf reflectance versus leaf chlorophyll and carotenoid concentrations for eight crops.
Agronomy. J. 69:799-802.
Walburg, G., Bauer, M. E., Daughtry, C. S. T, and T. L. Iiousley.
1982. Effects of nitrogen nutrition on the growth, yield, and reflectance characteristics of corn canopies. Agronomy. J. 74:677- 683.