Effects of Exercise and Nutrition on Male Body Composition and Obesity
Man Kyu Huh*
Department of Food Science & Technology, Dong-eui University, Busan 47340, Korea Received July 10, 2018 /Revised September 23, 2018 /Accepted October 2, 2018
This study is to investigate the effects of the physical activity and intake of improved food levels on male body compositions. Forty men were assigned to a percentage of body fat (PBF) group (20 men with physical exercise and food) and CONTROL group (20 men with exercise, food intake is free) for this six-month study. An aerobic capacity test to measure maximum oxygen consumption (VO2 max) was performed to precisely determine the exercise intensities during the experimental conditions.
After exercise and food control, the body weight of 20s with exercise and food (A) and only exercise (B) decreased about 2.3 kg and 0.4 kg after 6 months, respectively. If the p-values were 0.697(between baseline and 3 months), 0.535(between 3 months and 6 months), and 0.617(between baseline and 6 months), respectively, then 20s men had evidence of that a significant main effect does not exist amongst the observations of the outcome or within-weights. Their skeletal muscle mass (SMM) of both groups increased slightly through exercise. Although the decrease in total body weight of 30s was cor- related with the increase in SMM, there was not shown significant. While total body water decreased in 20s, 40s, and 50s except 30s men, all other values did not shown significant differences. The phys- ical activity and intake of improved food levels were contributed with lost a lot of weight, decrease of SMM and body fat.
Key words : Body weight, improved food, physical activity, skeletal muscle mass
*Corresponding author
*Tel : +82-51-890-1529, Fax : +82-0505-182-6870
*E-mail : [email protected]
This is an Open-Access article distributed under the terms of the Creative Commons Attribution Non-Commercial License (http://creativecommons.org/licenses/by-nc/3.0) which permits unrestricted non-commercial use, distribution, and reproduction in any medium, provided the original work is properly cited.
Journal of Life Science 2019 Vol. 29. No. 1. 45~51 DOI : https://doi.org/10.5352/JLS.2019.29.1.45
Introduction
Exercise is a type of physical activity consisting of plan- ned, structured, and repetitive bodily movement done to im- prove and/or maintain one or more components of physical fitness [10]. Health practitioners universally agree that too much body fat is a serious health risk. Problems such as hypertension, elevated blood lipids, diabetes mellitus, car- diovascular disease, respiratory dysfunction, and some joint diseases are all related to obesity. Information related to body composition and balance of food calories between in- put and output is accumulating rapidly and is extending our knowledge of human biology. In order to stay at the same body weight, people must balance the amount of calories in the foods and drinks they consume with the amount of calories the body uses. An energy balance is the balance of calories consumed through eating and drinking compared to calories burned through physical activity. Physical activity
is an important way to use extra food energy. Most people spend much of their working day in activities that require little energy. In addition, many adults of all ages now spend a lot of leisure time each day being inactive, for example, watching television or working at a computer.
Measuring body composition in humans is usually in re- sponse to the need to describe either deficiencies or excesses of a components of the human body closely relate to the status of our health. Body composition is of interest to nu- tritionists because of the impact that nutritional status, spe- cific diet, exercise, disease, and genetics can have on the ma- jor components of the human body [3]. Body composition and growth are key components of health in both individ- uals and populations.
Age-dependent loss of muscle mass and strength is grow- ing to be a major cause of disability and morbidity among older adults [13]. These alternations impair physical func- tional status, quality of life and increase the risk of co- morbidities [1]. While exercise and nutritional interventions have been proved to be effective to offset these alternations [2], an accurate estimation of body composition is essential to assess the changes that happen along with the inter- ventions [9].
Recent developments include three-dimensional photonic scanning and quantitative magnetic resonance. Collectively,
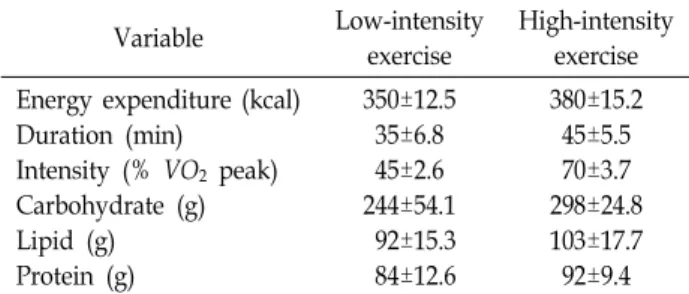
Table 1. Energy expenditure and duration of the low- and high- intensity exercise sessions and daily macronutrient intake
Variable Low-intensity
exercise
High-intensity exercise Energy expenditure (kcal)
Duration (min) Intensity (% VO2 peak) Carbohydrate (g) Lipid (g) Protein (g)
350±12.5 35±6.8 45±2.6 244±54.1 92±15.3 84±12.6
380±15.2 45±5.5 70±3.7 298±24.8 103±17.7 92±9.4 All value are mean ± SD. The main effects of the model were assessed with repeated-measures ANOVA (p<0.05). Post hoc testing was followed by paired t tests (Bonferonni corrections were applied for multiple comparisons). Means in a row with different superscript letters are significantly different (p<0.05).
these techniques allow for the measurement of fat, fat-free mass, bone mineral content, total body water, extracellular water, total adipose tissue and its subdepots (visceral, sub- cutaneous, and intermuscular), skeletal muscle, select or- gans, and ectopic fat depots. InBody measures body compo- sition and displays it on an organized. InBody with excep- tional precision and convenience of use widely recognized by experts worldwide.
The purpose of this study is to investigate the effects of the physical activity and improved food levels of adolescents on their body compositions.
Materials and Methods
Exercise training program
Forty men, with no resistance training experience or clin- ical problems, were randomly assigned to a percentage of body fat (PBF) group (20 men with physical exercise and food: marked as A) and control group (20 men with exercise, food intake is free: marked as B) for this six-month study.
All volunteers did a pre-exercise screening to make sure they could complete the exercise interventions of the study. A 30-minute rest period was provided between the aerobic fit- ness assessment and the muscular fitness assessment. All volunteers programmed to perform as uniform motion as possible. There are two basic physiological considerations that need to be addressed in designing any conditioning program. First, the major source of energy utilized to per- form the given activity must be identified. The second con- sideration involved in program design is developing a pro- gressive overload system that will develop that particular energy source. Resting energy expenditure was measured for the purpose of estimating daily energy requirements [16].
The energy expended during the exercise and resting ses- sions (t = 0-60 min) was calculated using the Weir equation [17]. An aerobic capacity test to measure maximum oxygen consumption (VO2 max) [12] was performed to precisely de- termine the exercise intensities during the experimental con- ditions [11] (Table 1). Energy and macronutrient contents were assessed by using Canadian Nutrient File software [6].
Participants undertook combined physical exercise and improved food. The physical exercises included the chest press, seated row, shoulder press, triceps extension, leg press, leg extension and leg curl, with abdominal crunches also performed [4]. Sessions commenced and concluded with general flexibility exercises. The aerobic component of the
training program conducted 30 minutes twice a week for six months.
Direct segmental multi-frequency bioelectrical im- pedance analysis (DSM-BIA)
DSM-BIA was performed using the In-Body (720) body composition analyzer. This equipment has previously been shown to have high test-pretest reliability and accuracy [4, 5].
Random assignment
Control participants could undergo the training after the assessment period had been completed. After completion of the baseline assessment, participants were randomly se- lected using a computer random assignment program. Forty men in their 20s, 30s, 40s, and 50s were randomly selected.
Statistical analyses
The measurements were prepared in triplicate for each analysis. Data were analyzed using the SPSS version 21 (SPSS Inc, Chicago, IL) statistical software package. The Greenhouse-Geisser is used to assess the change in a con- tinuous outcome with three observations across time or within-subjects. Means and standard deviations should be reported for each observation of the outcome with Green- house-Geisser corrections.
Results
Muscle-fat analysis
Characteristics of muscle-fat analysis and change over six months are reported in Table 2. PBF (group A) is the result
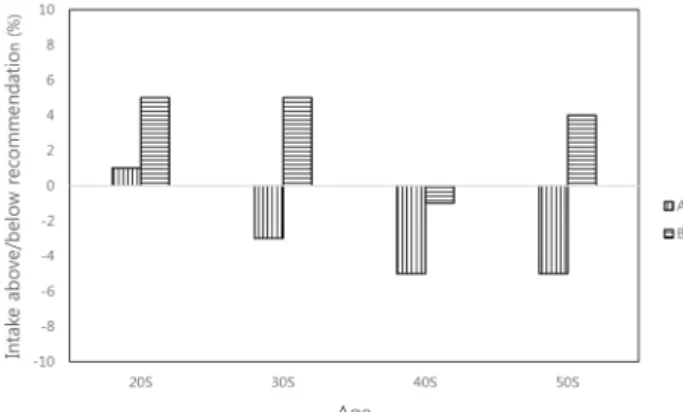
Fig. 1. Percentages of intake food during six months above/be- low recommended dietary allowances according to ages.
Table 2. Muscle-fat analysis and change over six months exercise training
Gender (Age) Measure Baseline 3 months 6 months F, p
Male (20s) A Total Weight, kg SMM, kg
PBF, %
71.0±4.44 28.4±3.05 14.8±1.51
70.1±4.81 29.1±3.40 13.9±1.39
68.7±4.40 29.8±3.35 13.9±1.75
0.753, NS 0.236, NS 0.546, NS
Male (20s) B Weight
SMM PBF
73.9±3.40 30.8±1.30 13.5±0.46
73.6±2.73 31.2±1.77 13.4±0.42
73.5±2.30 31.3±2.21 13.3±0.33
0.036, NS 1.455, NS 0.144, NS
Male (30s) A Weight
SMM PBF
81.4±4.96 35.6±4.25 15.1±1.07
80.6±5.20 35.2±4.31 14.6±1.31
77.4±3.44 35.2±3.05 13.6±1.37
1.052, NS 0.142, NS 2.201, NS
Male (30s) B Weight
SMM PBT
76.4±6.50 30.5±3.18 13.4±2.00
75.5±6.54 30.1±2.98 13.2±1.30
75.1±6.39 30.2±2.99 13.1±1.32
0.052, NS 0.042, NS 0.050, NS
Male (40s) A Weight
SMM PBF
75.4±2.88 30.3±1.91 11.4±1.59
74.4±3.02 30.3±2.21 11.2±1.45
71.8±3.59 31.0±1.83 10.9±1.44
1.708, NS 0.218, NS 0.122, NS
Male (40s) B Weight
SMM PBF
78.5±3.31 30.3±4.04 15.1±3.37
74.8±2.95 29.7±3.51 15.2±3.27
73.1±2.99 29.9±3.54 15.1±2.94
3.954, * 0.038, NS 0.002, NS
Male (50s) A Weight
SMM PBF
77.6±1.34 29.2±3.18 19.4±3.40
75.0±2.30 29.1±1.64 18.9±3.43
74.2±1.61 30.0±2.02 19.6±2.67
4.856, * 0.233, NS 0.057, NS
Male (50s) B Weight
SMM PBF
73.8±2.42 29.1±3.96 16.8±5.06
71.9±3.32 28.6±4.04 17.2±4.09
71.1±3.06 29.9±3.54 14.7±1.62
1.088, NS 0.146, NS 0.625, NS SMM: Skeletal Muscle Mass, PBF: Percentage of body fat. Results are from three experiments and are expressed as mean ± SD.
NS: Non-significant, p>0.05. *: Significant, p<0.05.
of a survey of five 71-kg men in their 20s. After exercise and food control, the body weight of 20s with exercise and food (A) and with only exercise (B) decreased about 2.3 kg and 0.4 kg after 6 months, respectively. If the p-values were 0.697(between baseline and 3 months), 0.535(between 3 months and 6 months), and 0.617(between baseline and 6 months), respectively, then 20s men had evidence of that a significant main effect does not exist amongst the ob- servations of the outcome or within-weights. Their skeletal muscle mass (SMM) of both groups increased slightly through exercise. On the other hand, their percentage of body fat (PBF) decreased by 0.9%. Although the decrease in total body weight of 30s was correlated with the increase in SMM, there was not shown significant. However, differ- ence between total weight change measurements was asso- ciated with fat loss PBF. They performed exercise and food control very well (Fig. 1). 30s PBF (group 30s A) is the result of a survey of mean 81.4 kg. The body weight of 30s with exercise and food (30s A) and only exercise (30s B) decreased
about 4.0 kg and 1.3 kg after 6 months, respectively.
Although they performed exercise, food control very well, loss of body weight, SMM did not increase through exercise.
30s A performed exercise and food control very well and 30s B did not do them (Fig. 1). The body weight of 40s with exercise and food (A) and only exercise (B) decreased about
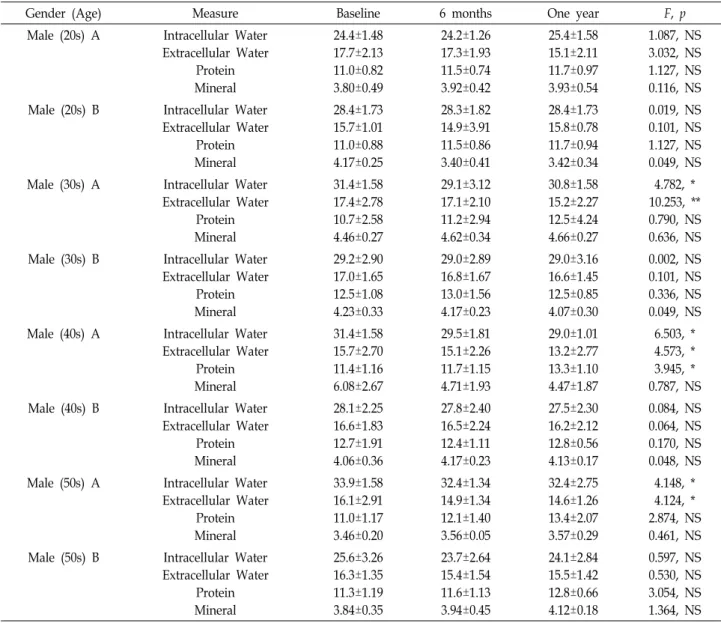
Table 3. Body composition analysis and change over one year exercise training
Gender (Age) Measure Baseline 6 months One year F, p
Male (20s) A Intracellular Water Extracellular Water
Protein Mineral
24.4±1.48 17.7±2.13 11.0±0.82 3.80±0.49
24.2±1.26 17.3±1.93 11.5±0.74 3.92±0.42
25.4±1.58 15.1±2.11 11.7±0.97 3.93±0.54
1.087, NS 3.032, NS 1.127, NS 0.116, NS Male (20s) B Intracellular Water
Extracellular Water Protein Mineral
28.4±1.73 15.7±1.01 11.0±0.88 4.17±0.25
28.3±1.82 14.9±3.91 11.5±0.86 3.40±0.41
28.4±1.73 15.8±0.78 11.7±0.94 3.42±0.34
0.019, NS 0.101, NS 1.127, NS 0.049, NS Male (30s) A Intracellular Water
Extracellular Water Protein Mineral
31.4±1.58 17.4±2.78 10.7±2.58 4.46±0.27
29.1±3.12 17.1±2.10 11.2±2.94 4.62±0.34
30.8±1.58 15.2±2.27 12.5±4.24 4.66±0.27
4.782, * 10.253, **
0.790, NS 0.636, NS Male (30s) B Intracellular Water
Extracellular Water Protein Mineral
29.2±2.90 17.0±1.65 12.5±1.08 4.23±0.33
29.0±2.89 16.8±1.67 13.0±1.56 4.17±0.23
29.0±3.16 16.6±1.45 12.5±0.85 4.07±0.30
0.002, NS 0.101, NS 0.336, NS 0.049, NS Male (40s) A Intracellular Water
Extracellular Water Protein Mineral
31.4±1.58 15.7±2.70 11.4±1.16 6.08±2.67
29.5±1.81 15.1±2.26 11.7±1.15 4.71±1.93
29.0±1.01 13.2±2.77 13.3±1.10 4.47±1.87
6.503, * 4.573, * 3.945, * 0.787, NS Male (40s) B Intracellular Water
Extracellular Water Protein Mineral
28.1±2.25 16.6±1.83 12.7±1.91 4.06±0.36
27.8±2.40 16.5±2.24 12.4±1.11 4.17±0.23
27.5±2.30 16.2±2.12 12.8±0.56 4.13±0.17
0.084, NS 0.064, NS 0.170, NS 0.048, NS Male (50s) A Intracellular Water
Extracellular Water Protein Mineral
33.9±1.58 16.1±2.91 11.0±1.17 3.46±0.20
32.4±1.34 14.9±1.34 12.1±1.40 3.56±0.05
32.4±2.75 14.6±1.26 13.4±2.07 3.57±0.29
4.148, * 4.124, * 2.874, NS 0.461, NS Male (50s) B Intracellular Water
Extracellular Water Protein Mineral
25.6±3.26 16.3±1.35 11.3±1.19 3.84±0.35
23.7±2.64 15.4±1.54 11.6±1.13 3.94±0.45
24.1±2.84 15.5±1.42 12.8±0.66 4.12±0.18
0.597, NS 0.530, NS 3.054, NS 1.364, NS NS: Non-significant, p>0.05. *: Significant, p<0.05. **: Significant, p<0.01.
3.6 kg and 1.0 kg, respectively. The significance of F for 40s with exercise (A) was 3.954, which was significant because it was less than the criterion value of 0.05. There was a sig- nificant difference in the time (six months) taken exercise after eating controlled foods. They lost a lot of weight and body fat. Though they were not a food control group, they performed exercise and food control very well (Fig. 1).
Because of obesity, each person exercised diet and exercise.
Thus, the divergent results for % fat change may be attribut- able to the marked fat loss coupled with changes in lean mass from the exercise. The body weight of 50s with exercise and food (A) and only exercise (B) decreased about 4.5 kg and 2.7 kg, respectively. F of 50s with exercise and food was 4.856 and there was significant difference. The 50s A per-
formed exercise and food control very well, but the group 50s B did not do food control very well (Fig. 1). The 50s man is deemed to be decreasing-weight due to the increased weight of their skeletal muscle.The three men of the group 50s B-participants were sometimes absent from the exercise session or were eating irregular meals. Decrease of SMM and body fat were contributed with lost a lot of weight.
Body composition analysis
Table 3 shows body composition analysis and change over six months exercise training. While total body water decreased in 20s (groups A and B), 30s (group B), 40s (group B), and 50s (group B), all other values did not shown sig- nificant differences. Difference between total body water
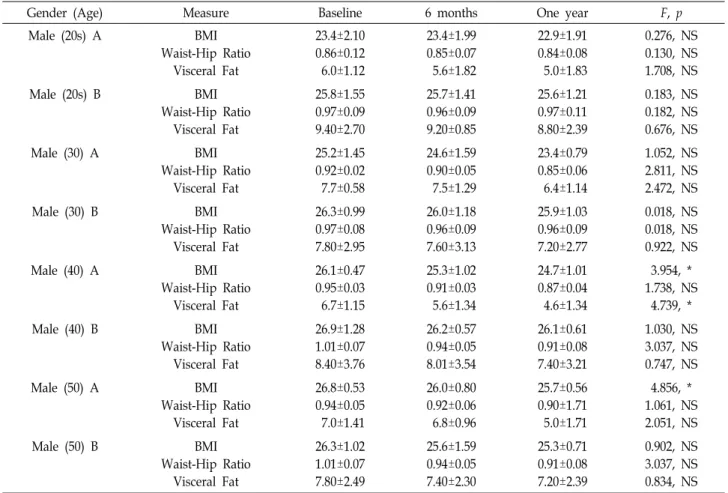
Table 4. Obesity analysis and change over one year exercise training
Gender (Age) Measure Baseline 6 months One year F, p
Male (20s) A BMI
Waist-Hip Ratio Visceral Fat
23.4±2.10 0.86±0.12 6.0±1.12
23.4±1.99 0.85±0.07 5.6±1.82
22.9±1.91 0.84±0.08 5.0±1.83
0.276, NS 0.130, NS 1.708, NS
Male (20s) B BMI
Waist-Hip Ratio Visceral Fat
25.8±1.55 0.97±0.09 9.40±2.70
25.7±1.41 0.96±0.09 9.20±0.85
25.6±1.21 0.97±0.11 8.80±2.39
0.183, NS 0.182, NS 0.676, NS
Male (30) A BMI
Waist-Hip Ratio Visceral Fat
25.2±1.45 0.92±0.02 7.7±0.58
24.6±1.59 0.90±0.05 7.5±1.29
23.4±0.79 0.85±0.06 6.4±1.14
1.052, NS 2.811, NS 2.472, NS
Male (30) B BMI
Waist-Hip Ratio Visceral Fat
26.3±0.99 0.97±0.08 7.80±2.95
26.0±1.18 0.96±0.09 7.60±3.13
25.9±1.03 0.96±0.09 7.20±2.77
0.018, NS 0.018, NS 0.922, NS
Male (40) A BMI
Waist-Hip Ratio Visceral Fat
26.1±0.47 0.95±0.03 6.7±1.15
25.3±1.02 0.91±0.03 5.6±1.34
24.7±1.01 0.87±0.04 4.6±1.34
3.954, * 1.738, NS
4.739, *
Male (40) B BMI
Waist-Hip Ratio Visceral Fat
26.9±1.28 1.01±0.07 8.40±3.76
26.2±0.57 0.94±0.05 8.01±3.54
26.1±0.61 0.91±0.08 7.40±3.21
1.030, NS 3.037, NS 0.747, NS
Male (50) A BMI
Waist-Hip Ratio Visceral Fat
26.8±0.53 0.94±0.05 7.0±1.41
26.0±0.80 0.92±0.06 6.8±0.96
25.7±0.56 0.90±1.71 5.0±1.71
4.856, * 1.061, NS 2.051, NS
Male (50) B BMI
Waist-Hip Ratio Visceral Fat
26.3±1.02 1.01±0.07 7.80±2.49
25.6±1.59 0.94±0.05 7.40±2.30
25.3±0.71 0.91±0.08 7.20±2.39
0.902, NS 3.037, NS 0.834, NS BMI: Body mass index. *: Significant, p<0.05.
was related to body fat loss. Three groups (30s A, 40s A, and 50s A) were shown significant differences. Weight alone does not correctly reflect the effects of exercise. Loss of weight reflected the combined effects of exercise and im- proved diet. Mineral help the body preserve and play a care role in the human body. Mineral mass was closely related to protein and soft lean mass. Protein and minerals increased in the 20s A, 30s A, and 50s men (A and B). Some men in 20s B and 40s B have lost her protein and minerals.
Table 4 shows men obesity analysis and change, through- out six months of exercise and/or controlled food, had mini- mal change. Overall, the BMI index improved significantly through exercise. There was a significant decrease in BMI in the 40s A and 50s A. Waist-Hip ratio (WHR) is determined by dividing the waist circumference from the navel line by the hip’s maximum circumference. It is a useful indicator for comprehending the distribution of body fat. There was no significance, but the WHR index improved except 20s B.Visceral fat area is defined here as the cross-sectional area of visceral fat found in the abdomen. Indices of visceral fat
were not significantly different among groups, but was much lowered.
Discussion
Understanding the effects of exercise on food intake is complicated by limitations of methodology [15]. Several in- dependent variables also affect the results of exercise-food intake studies, even with laboratory rats where food intake measurements can be quite accurate. These variables include exercise protocols, subject characteristics, types and amounts of food available for consumption, environmental con- ditions, and sociocultural factors. Participants were asked to maintain their normal dietary and physical activity pro- grams throughout the duration of the study. Physical activ- ity is often considered a futile form of weight control be- cause of the possible concomitant compensation of food intake. However, it should be noted that some studies have shown that exercise induces a brief suppression of appetite (hunger) [8], even if this does not necessarily translate into
a decrease in subsequent food intake. Men who detrain after 6 months of training regain bodyweight and body fat lost during training despite a reduction of energy intake and the percentage of calories from dietary fat.
Most participants who fall into this body type have an excessive amount of body weight and are diagnosed as be- ing chronically obese. In these individuals, it is common to see the measured SMM over the average range [7]. While body weight decreased for 40s and 50s with exercise and food, all other values did not shown significant differences.
However, difference between % fat change measurements was related to fat loss. Participants exposed to exercise com- mercials reduced their caloric intake by 1-7% relative to the control condition.
Fitness was correlated with self-reported total caloric in- take in males. There was no weight change in either control or trained subjects. Research results range from increased carbohydrate, fat, or protein consumption to no change in significant body composition (20s A, 20s B, 30s B, 50s B).
Men who detrain after 6 months of training regain body- weight and body fat lost during training despite a reduction of food energy intake and the percentage of calories from dietary fat. Because regular exercise can lead to energy in- take, weight or fat loss may not be significantly reduced.
Therefore, care must be taken not to supplement the energy consumed by the regular exercise with food, which can re- duce weight and fat content. Regularly performed strenuous exercise decreased the amount of food consumed by male rats, resulting in decreased body weight and fat caused by the caloric cost of exercise and the decreased food intake [14].
This study has several limitations. There is certainly a need for more comprehensive studies to better understand the relationship between the intensity of exercise and foods.
References
1. Baumgartner, R. N. 2000. Body composition in healthy aging. Ann. N. Y. Acad. Sci. 904, 437-448.
2. Benton, M. J. 2011. Sarcopenic obesity: strategies for man- agement. Am. J. Nurs. 111, 38-44.
3. Brodie, D, Moscrip, V. and Hutcheon, R. 1998. Body compo- sition measurement: A review of hydrodensitometry, an- thropometry, and impedance methods. Nutrition 14, 296-310.
4. Galvão, D. A., Taaffe, D. R., Spry, N., Joseph, D. and Newton, R. U. 2010. Combined resistance and aerobic ex- ercise program reverses muscle loss in men undergoing an- drogen suppression therapy for prostate cancer without bone metastases: a randomized controlled trial. J. Clin.
Oncol. 28, 340-347.
5. Gibson, A. L., Holmes, J. C., Desautels, R. L., Edmonds, L.
B. and Nuudi, L. 2008. Ability of new octapolar bioimpe- dance spectroscopy analyzers to predict 4-component-mod- el percentage body fat in hispanic, black, and white adults.
Am. J. Clin. Nutr. 87, 332-338.
6. InBody. 2014. InBody720 - The Precision Body Composition Anayzer - USER’S MANUAL. InBody CO., LTD. Cerritos, CA.
7. Government of Canada. 2015. The Canadian Nutrient File (CNF). Canada.
8. King, N. A. 1999. What processes are involved in the appe- tite response to moderate increases in exercise-induced en- ergy expenditure? Proc. Nutr. Soc. 58, 107-113.
9. Li, Y. 2012. Validity of non-invasive methods for body com- position measurements in older adults. Graduate Theses and Dissertations, Iowa State University, Ames, Iowa.
10. Pescatello, L. S., Arena, R., Riebe, D., Thomson, D., Kluwer, W. and Willians & Wilkins, L. 2014. ACSM’s Guidelines for Exercise Testing and Prescription, pp. 456, 9th ed., American College of Sports Medicine, Philadelpia, PA.
11. Pomerleau, M., Imbeault, P., Parker, T. and Doucet, E. 2004.
Effects of exercise intensity on food intake and appetite in women. Am. J. Clin. Nutr. 80, 1230-1236.
12. Prudhomme, D., Bouchard, C., Leblanc, C., Landry, F., Lortie, G. and Boulay, M. R. 1984. Reliability of assessments of ventilatory thresholds. J. Sports Sci. 2, 13-24.
13. Roubenoff, R. and Hughes, V. A. 2000. Sarcopenia: current concepts. J. Gerontol. A Biol. Sci. Med. Sci. 55, 716-724.
14. Staten, M. A. 1991. The effect of exercise on food intake in men and women. Am. J. Clin. Nutr. 53, 27-31.
15. Titcheal, C. A. 1988. Exercise and food intake. What is the relationship? Sports Med. 6, 135-145.
16. Vatansever-Ozen, S., Tiryki-Sonmez, G., Bugdayci, G. and Ozen, G. 2011. The effects of exercise on food intake and hunger: relationship with acylated ghrelin and leptin. J.
Sports Sci. Med. 10, 283-291.
17. Weir, J. B. 1990. New methods for calculating metabolic rate with special reference to protein metabolism. Nutrition 6, 213-221.
초록:운동과 영양 조절이 남성 연령별 체조성 및 비만에 미치는 영향
허만규*
(동의대학교 식품공학과)
본 연구는 운동과 영양 조절을 통한 남성 체 구성을 조사하였다. 훈련을 수행하는데 문제가 없는 건강한 40명을 임의로 선정하여 20명에게는 운동과 영양조절 그룹으로 선정하였고, 나머지 20명에게는 운동만 6개월간 수행하도
록 하였다. 실험조건 동안 운동강도를 정확하게 측정하기 위해 최대산소 소모량(VO2 max)을 측정하였다. 운동과
영양조절일 실시한 20대 남자와 운동만 수행한 남자는 6개월 후 체중이 2.3 kg과 0.4 kg이 감소하였다. 0~3개월 간 실시한 결과에서 체중 측정값에 p값은 0.697이였으며, 3~6개월 측정값의 p값은 0.535로 나타났고, 0~6개월 측정 값의 p값은 0.617로 나타났다. 20대의 골격근은 약간 증가하였다. 30대의 체중은 6개월 후 운동과 영양조절 그룹이 4.0 kg, 운동만 수행한 그룹에서 1.3 kg이 감소하였다. 비록 체중의 감소는 골격근의 증가와 연관성이 있지만 유의 성은 없었다. 체중의 변화는 지질 감소와 수분(세포 내 및 세포 간 수분) 감소와 연관이 있었다. 30대를 제외한 20대, 40대, 50대의 체중 감소는 있었지만 유의성은 없었다.