Fast Outlier Removal for Image Registration based on Modified K-means Clustering
Young-Sung Soh*, Mudasar Qadir*, and In-Taek Kim*
ABSTRACT
Outlier detection and removal is a crucial step needed for various image processing applications such as image registration. Random Sample Consensus (RANSAC) is known to be the best algorithm so far for the outlier detection and removal. However RANSAC requires a cosiderable computation time. To drastically reduce the computation time while preserving the comparable quality, a outlier detection and removal method based on modified K-means is proposed. The original K-means was conducted first for matching point pairs and then cluster merging and member exclusion step are performed in the modification step. We applied the methods to various images with highly repetitive patterns under several geometric distortions and obtained successful results. We compared the proposed method with RANSAC and showed that the proposed method runs 3~10 times faster than RANSAC.
Keywords : Outlier removal, K-means clustering, Random Sample Consensus (RANSAC), image registration
I. Introduction
Outlier detection and removal are a critical task in many fields such as fault diagnosis, detecting novelties in images, motion segmentation, and image registration. In image registration, outliers arise due to mismatch of features or areas especially when dealing with images with many repetitive patterns. Outlier indicates the abnormal observations in data which affects the accuracy of image registration. Hodge[1] gave a good review of outlier detection techniques. In [1], outlier detection techniques are classified into three fundamental approaches. They are supervised, semi-supervised, and unsupervised approaches. In supervised classification based methods, training data is given which is pre-labeled as normal or abnormal classes. The classification system is trained using that data and is used for classifying unlabeled data. In semi-supervised approaches, only training data for the normal classes are provided and algorithm learns to recognize abnormality. In unsupervised clustering methods, no training data is given and the method has to organize the data without any prior knowledge. Hodge[1] also described that outlier detection
* 명지대학교 정보통신공학과
투고 일자 : 2014. 12. 29 수정완료일자 : 2015. 1 .26 게재확정일자 : 2015. 2 .2
methods are derived from three computing fields. They are statistics, neural networks, and machine learning.
Statistical methods are the earliest algorithms of outlier detection. These models are usually suited to very small quantitative ordinal data distributions or to quantitative real valued data sets. Statistical methods can be further decomposed into proximity-based, parametric[5], semi-parametric, and non-parametric methods[6]. Neural network methods[7][8] are generally model-based and non-parametric. They perform well for the classification of unseen patterns and are capable of learning difficult class boundaries. Neural network methods are further decomposed into supervised and unsupervised neural network methods. Machine learning methods focus on categorical data, while many outlier detection techniques works well for continuous real valued data and little focus on categorical data.
Soh[2] proposed the novel area-based image registration algorithm. In contrary to conventional area-based methods they select only those areas with rich features and use them for matching by sum of squared distance (SSD).
Many image registration techniques, including [2] may produce mismatches (outliers) if input has highly repetitive patterns. RANSAC[3] has been used successfully for the detection and removal of outliers and is known to be the best outlier detection method in the literature. However it is very time-consuming.
In this paper we propose the outlier detection and removal method based on modified K-means clustering algorithm which runs a lot faster than RANSAC[3] while producing a comparable outlier removal results. K-means is an unsupervised clustering algorithm that tries to partition the (multi dimensional) data points into K sets (clusters) such that points having similar properties tend to gather near the same other. It is unsupervised because the points are not labeled. We modify the original K-means and use it for outlier detection and removal.
This paper is organized as follows. In section II, related works for outlier removal technique is discussed. The proposed method is explained in section III. Results are described in section IV and section V concludes the paper.
II. Related Works
In this section, we describe well-known conventional techniques for outlier detection, known as Random Sample Consensus (RANSAC).
Fishcler[3] proposed RANSAC technique. Random sample consensus is an iterative method to estimate the parameters of a specific mathematical model from the observed dataset which contains outliers and inliers. It is also used to remove the outliers from dataset. It is a non-deterministic algorithm. The probability of producing a reasonable result with RANSAC increases with the increment of the number of iterations. In RANSAC, first hypothetical inliers are randomly selected from data set, a model is fitted to them, and model parameters are estimated. All other data are checked for possible inclusion in the model. If the estimated model contains sufficient number of data, then it is considered good.
Otherwise random hypothetical inlier selection is performed again and the above procedure is repeated.
The process stops when the model contains sufficient number of data and total fitting error is below some threshold. RANSAC was successfully utilized for applications where matching is required for selected point pairs.
Ⅲ. The Proposed Method
The proposed method assumes that the matching point pairs of reference image denoted as R and distorted image denoted as D are provided.
The proposed method consists of two parts: original K-means and the modification parts. In original K-means part, usual K-means clustering is performed where K
cluster centers are randomly generated, points are clustered into appropriate cluster based on some distance measure, cluster centers are recalculated with point members, and this process is repeated until convergence.
After getting K clusters, modification step is applied.
Clusters that are close enough are merged into a single cluster and points in the cluster having maximum members are investigated to check if they are far enough from the cluster center. If they are, they are excluded from that cluster. The reason why we investigate members of the cluster having maximum members is that inliers tend to gather into a single cluster and outliers tend to disperse in the pattern space. Thus members of some cluster that is merged into the cluster with maximum members become inliers. On the contrary, some members in the cluster with maximum members become outliers if they are far from the cluster center.
Pseudo code for the proposed method based on modified K-means is given in Algorithm 1. Here steps 1 and 2 belong to the original K-means algorithm and steps 3 and 4 are modifications. In modification part, we use threshold. This threshold is set as two times the standard deviation of data points in the cluster with maximum members.
Algorithm 1. Pseudo code of the proposed method based on modified K-means
1. Initialize cluster centers µ1, µ2, …, µk randomly.
2. Repeat until convergence
For every data point xi, put xi into cluster ci
ci := minj || xi -µj||2
For each cluster ci = j, compute cluster center
µj :=
3. For each cluster j, merge with neighboring cluster k if
|| µj -µk ||2 < threshold
4. For cluster j having maximum number of points, remove points xi in cluster j if
|| xi - µj||2 > threshold
-|| x – y || : Euclidean distance between vector x and y.
-ci : cluster label
-m : total number of data points in each cluster
Ⅳ. Experimental Results
In this section, we compare the proposed with conventional method as in Fig. 1. Given a reference image R, we geometrically transform it using MATLAB function with a known affine parameter set to get the distorted image D as in (1).
′
′
(1), where [x, y] and [x`, y`] represent a reference point in R and a distorted point in```````````````````````````````````````` D respectively. A’s and T’s are affine parameters.
Fig. 1. Performance comparison procedure
Next we apply featured area based matching method[2]
to do feature selection and matching to produce matching point pairs. Then these pairs are fed into the proposed method and RANSAC to detect the outliers. These detected outliers are compared with ground truth that we manually obtained earlier. The outlier removal accuracy is computed using (2).
× (2)
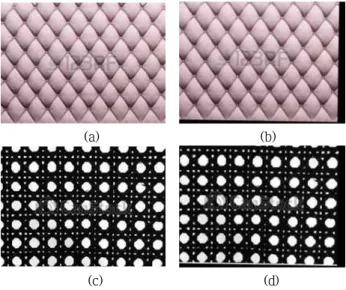
where E and B represent actual number of outliers and the number of detected outliers respectively. The images used for the experiment are from Google image database[4] and are shown in Fig. 2. We put name to each image such that Fig. 2(a) is Cushion, 2(b) Fabric,
2(c) Fence, and 2(d) Orange. They all have highly repetitive patterns.
(a) (b)
(c) (d)
Fig. 2. Test images (a) Cushion, (b) Fabric, (c) Fence, and (d) Orange
We test several affine parameter sets having translation, rotation, and scale components to produce distorted images and then produce outliers. The affine parameter sets we tested are as follows.
Test set 1
′
′
Test set 2
′
′
Test set 3
′
′
Test set 4
′
′
Test sets 1 and 2 are designed to have small rotation, small scale, and moderate translation, whereas Test sets 3 and 4 have greater translation to perturb the input image more. Fig. 3 shows the reference and the distorted
Test Image Cushion Fabric Fence Orange
Ground Truth
Inlier (A) 16 146 99 213
Outlier
(B) 4 49 14 32
Total 20 195 113 245
The Proposed
Inlier 16 146 99 213
Outlier
(C) 4 49 14 32
Accuracy
C/B*100 100% 100% 100% 100%
Time
(msec) 30.4 8.2 10.7 10.2
RANSAC
Inlier 16 146 99 213
Outlier
(D) 4 49 14 32
Accuracy
D/B*100 100% 100% 100% 100%
Time
(msec) 104.8 37.0 34.4 35.8
Test Image Cushion Fabric Fence Orange
Ground Truth
Inlier (A) 14 138 95 194
Outlier
(B) 6 57 18 51
Total 20 195 113 245
The Proposed
Inlier 14 138 95 194
Outlier
(C) 6 57 18 51
Accuracy
C/B*100 100% 100% 100% 100%
Time 3.6 7.4 6.2 11.6
generated by Test set 3 for Cusion and Fence images.
Fig. 4 depicts some of mismatches (outliers) obtained from refernce-distorted pair in Fig. 3. Blocks (areas) used for matching is indicated in blue. Black arrows for Cusion and orange arrows for Fence indicate mismatched block pairs.
If these outliers are not removed and used in image registration process, registration quality will decrease.
(a) (b)
(c) (d)
Fig. 3. Reference and distorted images for Test set 3 (a) Cushion reference, (b) Cusion distorted, (c) Fence
reference, and (d) Fence distorted
Fig. 4. Some of mismatches (outliers) detected (a) Cushion reference, (b) Cusion distorted, (c) Fence
reference, and (d) Fence distorted
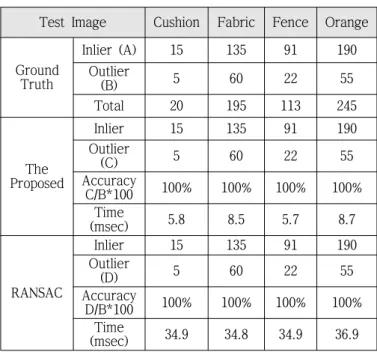
Tables 1, 2, 3, and 4 show the outlier removal accuracy results for Test sets 1, 2, 3, and 4 respectively. For each Table, the second row, marked as ‘A’, displays the total number of actual inliers, the third row, marked as
‘B’, represents the number of actual outliers, and the fourth row demonstrates the total number of actual inliers plus outliers. These three rows are served as a ground truth for inliers, outliers and total number of featured points respectively. The number of removed outliers by the proposed is shown in row marked as‘C’ and by RANSAC in row marked as‘D’ along with removal accuracies. Accuracy of outlier removal is computed as the ratio of number of outliers removed by designated technique to total number of actual outliers in percentage.
Execution time for the proposed method and RANSAC is shown in ‘Time’ row in milisecond. It can be seen that both the proposed method and RANSAC achieve the
“PERFECT” performance by removing all outliers for all Test sets. But the proposed method took far less time than RANSAC. The proposed runs more than three to ten times faster than RANSAC depending on Test sets and images.
Table 1 Accuracy of outlier removal for Test set 1 (UNIT: %, msec)
Table 2. Accuracy of outlier removal for Test set 2 (UNIT: %, msec)
(msec)
RANSAC
Inlier 14 138 95 194
Outlier
(D) 6 57 18 51
Accuracy
D/B*100 100% 100% 100% 100%
Time
(msec) 37.6 36.5 37.8 36.0
Test Image Cushion Fabric Fence Orange
Ground Truth
Inlier (A) 15 135 91 190
Outlier
(B) 5 60 22 55
Total 20 195 113 245
The Proposed
Inlier 15 135 91 190
Outlier
(C) 5 60 22 55
Accuracy
C/B*100 100% 100% 100% 100%
Time
(msec) 5.8 8.5 5.7 8.7
RANSAC
Inlier 15 135 91 190
Outlier
(D) 5 60 22 55
Accuracy
D/B*100 100% 100% 100% 100%
Time
(msec) 34.9 34.8 34.9 36.9
Test Image Cushion Fabric Fence Orange
Ground Truth
Inlier (A) 16 130 82 173
Outlier
(B) 4 65 31 72
Total 20 195 113 245
The Proposed
Inlier 16 130 82 173
Outlier
(C) 4 65 31 72
Accuracy
C/B*100 100% 100% 100% 100%
Time
(msec) 3.6 7.9 9.2 5.6
RANSAC
Inlier 16 130 82 173
Outlier
(D) 4 65 31 72
Accuracy
D/B*100 100% 100% 100% 100%
Time
(msec) 34.1 35.5 36.5 37.9
Table 3. Accuracy of outlier removal for Test set 3 (UNIT: %, msec)
Table 4. Accuracy of outlier removal for Test set 4 (UNIT: %, msec)
Ⅴ. Conclusion
Outlier detection and removal is a crucial step needed for various image processing applications such as image registration. Fischler proposed RANSAC and it is by far the best algorithm for outlier detection and removal.
However RANSAC requires much computation time. To drastically reduce the computation time while preserving the comparable quality, we proposed to use modified K-means based outlier detection and removal algorithm.
We applied the methods to various images with highly repetitive patterns under several geometric distortions and obtained successful results. We found that the proposed runs three to ten times faster than the conventional while maintaining the same quality.
Reference
[1] V. J. Hodge and J. Austin, “A survey of outlier detection methodologies”, Artificial Intelligence Review, vol. 22, issue 2, pp. 85-126, Oct. 2004 [2] Y. Soh, M. Qadir, A. Mehmood, Y. Hae, H. Ashraf,
and I. Kim, “ A Featured Area-Based Image Registration ”, International Journal of Computer Theory and Engineering, vol. 6, no. 5, Oct. 2014 [3] M. A. Fischler and R. C. Bolles, “Random sample
consensus: A paradigm for model fitting with applications to image analysis and automated cartography”, Comm. of the ACM, pp. 381-395, 1981
[4] https://www.google.com
[5] P. Wayne Power, Johann A. Schoonees,
“Understanding Background Mixture Models for Foreground Segmentation,” Proc. Image and Vision Computing New Zealand, 2002.
[6] W. Zucchini, Applied smoothing techniques, Part 1 Kernel Density Estimation., 2003
[7] R. Forgac and R. Krakovsky,“Neural network model for multidimensional data classification via clustering with data filtering support”, IEEE International Symposium on Intelligent Systems and Informatics, pp.79-84, 2012
[8] Y. Zhu,“An efficient supervised clustering algorithm based on neural networks”, International Conference on Advance Computer Theory and Engineering, vol.
4, pp.265-268, 2010
Young-Sung Soh (Regular member)
received BS in electrical engineering in 1978 from Seoul National University and MS and PhD in computer science from the University of South Carolina in 1986 and 1989, respectively.
He is currently a professor in the Dept. of Information and Communication Engineering, Myongji University, Korea. His current interest of research includes object tracking, stereo vision, and parallel algorithms for image processing.
Mudasar Qadir
received BS in computer science in 2011 from FAST-NU University in Peshawar, Pakistan. He entered a Master course in information and communication engineering in Myongji University in 2013.
His current interest of research includes object tracking, stereo vision and parallel algorithms for image processing.
In-Taek Kim
received BS and MS in electronics engineering from Seoul National University in 1980 and 1984 respectively, and PhD in electrical engineering from Georgia Institute of Technology in 1992.
He is now a professor in the Dept. of Information and Communication Engineering, Myongji University. His research interest includes pattern recognition, image processing and smart grid area.