Print ISSN: 2288-4637 / Online ISSN 2288-4645 doi:10.13106/jafeb.2020.vol7.no3.87
Do Board Traits Influence Firms’ Dividend Payout Policy? Evidence from Malaysia*
Hussain TAHIR**, Mahfuzur RAHMAN***, Ridzuan MASRI****
Received: December 19, 2019 Revised: February 02, 2020 Accepted: February 06, 2020.
Abstract
The study aims to investigate factors that determine dividend payout policy using 336 non-financial firm year observations covering the period 2005 to 2016 in Malaysia. We found a significant positive relationship between corporate board size, board members average age, board tenure and dividend payout policy. We also found a strong negative effect and statistically insignificant relationship of board diversity, board independence, CEO duality and dividend payout policy. Additional, financial leverage has a negative effect on dividend payout policy. It is also noticed that firms with diverse boards are more likely to pay dividends and tend to pay larger dividends than those with non-diverse boards. Our results suggest that board diversity has a significant impact on dividend payout policy. Impact of board diversity on dividend payout policy is particularly conspicuous for firms with potentially greater agency problems. Our findings are consistent with the argument that corporate board traits enhancement positively affect the dividend payout policy which is beneficial for shareholders. This study offers useful insights into the current global debate on board traits and its implications for firms. The dividend payout policy signals good news to investors. Corporate board traits and firm‟s financial decision are the factors that disrupt the dividend decision.
Keywords : Dividend Pay-out, Board Traits, Board Diversity, Board Size, Board Tenure, Financial Leverage JEL Classification Code: G30, G34, G35
1.Introduction 1516
Dividend policy is remaining an integral part of financial policy. Ranti (2013) noted that dividend policy is a very complex financial management topic which falls among the top ten puzzles in finance literature. The dividend policy has several implications from both the firms'
*We gratefully acknowledge the funding from the IUMW Business School International University Malaya-Wales Malaysia Kuala Lumpur, Grant # IUMW/INT GRANT/COMMITTEE/2019(1).
**First Author. PhD Student, IUMW Business School, International University Malaya-Wales, Kuala Lumpur, Malaysia.
Email: [email protected]
***Corresponding Author. Senior Lecturer, Faculty of Business and Accountancy, University of Malaya (UM), Malaysia [Postal Address:
50603 Kuala Lumpur, Malaysia] Tel: +603 7967 3988 Email: [email protected]
****Senior Lecturer, IUMW Business School, International University Malaya-Wales, Kuala Lumpur, Malaysia.
Email: [email protected]
© Copyright: The Author(s)
This is an Open Access article distributed under the terms of the Creative Commons Attribution Non- Commercial License (https://creativecommons.org/licenses/by-nc/4.0/) which permits unrestricted non- commercial use, distribution, and reproduction in any medium, provided the original work is properly cited.
perspective and the shareholders' viewpoint. From the firm's perspective, dividend policy is vital because it determines the total amount of funds to be paid to investors in the form of cash dividends which can help to safeguard its investments as well as to maximize the shareholders' wealth (Abdullah, Ismail, & Saique, 2005).
There are many problems exists in financial management, but dividend payout policy is the main problem for both management and stockholders (Abor &
Bokpin, 2010). These are the concerns which arise the agency conflicts between owners and management.
Fleming, Heaney, and McCosker (2005) reveal that the firms' agency conflict always zeroes where single ownership concept. The main concern of the firm starts from the bottom, the stockholders prefer to take more from the profits in the form of a dividend. Abdulkadir (2015) indicates that the main features of shareholders assets increasing and a return of continues justifiable gain on share payout. Daily, the impact of the board's observation is not easy, it is natural people asked about the high role of corporate boards. It is obvious when there is a problem arises in a firm the position of an organizational board is shown toward the public attention, same as the example of
Enron, and WorldCom, Parma at misconduct (Adams, Hermalin, & Weisbach, 2010). With the proof on the significance of board heterogeneity measure over the past many years and the law made regarding corporate governance and the impotence of boardroom administrator has highly familiar.
A few studies have checked the reasons for dividend payout policy and finds different unmatched results. Some studies identify the corporate attributes impact the dividend payout policy and some reveal the administrative compensation (Tahir & Mushtaq, 2016; Ghasemi, Madrakian, & Keivani, 2013; Tahir, Masri, & Rahman, 2020). Tahir et al. (2020) reveal firm‟s financial leverage and corporate board attributes influence the dividend payout policy. On the other side, Vijayakumaran and Vijayakumaran (2019) reveal corporate traits didn‟t influence the financial leverage which negatively impact the dividend payout policy. PLCs normally charted good results backed by strong fundamentals, allowing for delivery of legitimate value. During the year, Malaysian securities market capitalization increases to RM 1.9 trillion from RM 1.7 trillion in 2016, with over 850 PLCs at Stock Exchange. The highest number of PLCs in ASEAN markets, allowing hankering to put Bursa Malaysia at the center of the region to continue intact (Annual Report 2017).
In Malaysia, a very small scale of these kinds of studies held by the researcher; a very low scale of investment opportunities to the individual investor. Investor avoids investing because of Lake of information the profit gains and the firm's decision for dividend payout policy. In this research, the researcher provided maximum information to investors, based on an evaluation of firms' board traits, innovation investment financial leverage influence on dividend payout policy. Malaysia motive is to attain innovation goals and becoming a developed country over 2020. Nevertheless, a transformational degree in Malaysia among companies remains comparatively very small and insufficient for Malaysia to get its distance of the 11th Malaysia program (2016-2020) that must stabilize organizational transformation by 2020. The 11th Malaysia plan builds a way to increase modernization or transformation in an organizational level that is through buildup governance tools.
The board traits (board gender diversity, board independence, board tenure, board size, board members average age, CEO duality) and conventional financial aspects such as innovation investment, financial leverage impact the dividend ration. In response to this problem, study suggests investigating the impact of board traits and financial aspects on dividend pay-out policy. The key query is whether there is an association between corporate board traits and dividend Pay-out policy. This paper also
investigates whether corporate board traits like board diversity, board size, board independence, board tenure, board members age, board duality influence the dividend pay-out policy. It also examines whether financial management like financial leverage, research and development decision influence the dividend pay-out policy. Finally, this paper explores whether corporate board diversity contributes to the dividend payout decisions.
2. Literature Review
There are many studies identifies the relationship between corporate board traits and dividend payout.
Therefore, female directors provide their skills and knowledge tend to increase novel activities for firm betterment (Horbach & Jacob, 2018). Therefore, showed that female directors avoid risks in policy-making, are more traditional than men, and are more humble in their decision-making (Dowling & Aribi, 2013). A significant positive relationship between board compositions payout ratio (Abdelfattah & Hussainey, 2019; Abor & Fiador, 2013). However, board traits and the dividend have an insignificant relationship identified (Mansourinia, Emamgholipour, Rekabdarkolaei, & Hozoori, 2013).
While a study by Ghabayen (2012) shows a negative relationship between board traits and dividend payout ratio.
The female directors provide their skills and knowledge tend to increase novel activities for firm betterment Horbach and Jacob (2018) and deliver alternative viewpoints and sentiments that improve independent policymaking (Nielsen & Huse, 2010). Ajanthan (2013) examined the impact of board member independence on dividend payout ratios in the Sri Lankan hotel industry and found no significant relationship between board independence and dividend payout ratios. Similarly, Adjaoud and Ben‐Amar (2010) studied the effect of qualitative corporate governance attributes on the dividends of 714 Canadian firms and found that strong corporate governance mechanisms increased dividends payments.
There is a major and positive association between board size and dividend payout policy according to Mansourinia et al. (2013), who studied 140 firms on the TSE between 2006-2010. Likewise, a positive association was established between board size and dividend payout policy by Uwuigbe (2013) using regression analysis. The board Age diversity affects firm performance (Carter, D‟Souza, Simkins, & Simpson, 2010). Earlier researches have examined how board attributes such as board size Van Pelt (2013) average age, and skill (Custódio & Metzger, 2014) influence dividend payout policy. Extensive administrative tenure in a company is linked with passive conclusions
creation move toward and confrontation to changes to the company's plan, the companies spirited position may turn into risky in high-speed industries, somewhere appropriate adaptation and taking proactive choice necessary (Boeker, 1997). Arshad, Akram, Amjad, and Usman, (2013) identify the CEO duality has a remarkable relation to firms' dividend payout ratio, contrary to findings by Ajanthan (2013).
This investigation attempts to investigate the association between corporate board traits an innovation investment, financial leverage and dividend pay-oy policy. Many studies held in all over the world but lacking in Malaysia.
The finding from a few numbers of research (Byoun, Chang, & Kim, 2016; Lee & Lee, 2019; Li & Zhang, 2019).
Some researches identify that board diversity can improve the networking between age fallows connections, resources, creativity, and innovation. In a representation of 1,939 companies of IRRC and Execu Comp covering years 1996- 2003, Adams and Ferreira (2009) introduced that WOCB has a remarkable effect on dividend pay-out. Next disparity, Carter et al. (2010) have not got any proof of a remarkable relationship connecting board diversity and companies‟
achievement and accomplishment during S & P 500 companies with the time from 1998 to 2002 and 326 organizations in 2003, gradually. Each separation of experimental outcomes is further recognized in the EU circumstances.
For instance; Rose (2007) maintain any remarkable association within board sexuality heterogeneity and Tobin's Q as a representation of Danish registered companies covering the span of 1998 to 2001. Campbell and Mínguez-Vera (2008) show a positive conclusion of board sexuality heterogeneity of company‟s worth for a representation of Spanish organizations from 1995 to 2000.
Ultimately Ahern and Dittmar (2012) document, a contradictory relationship following the favor of the legislation on women's quotas in Norway. Prior research suggests that the monitoring efficiency of the board of directors relies on factors such as independence, experience, CEO duality, size and increasing experimentation attention and understanding the role of corporate board gender composition in board effectiveness (Li & Zhang, 2019). A few decades ago, the sentiment of investor affect the stock prices, there was a very difficult to measure the investor sentiment. Now a day, there is a technological era everyone needs fast-track information.
There is a significant positive association among board compositions and dividend payout ratio (Abor & Fiador, 2013). However, some of the other research confirms insignificant relationship (Mansourinia et al., 2013;
Subramaniam et al., 2011). While a study by Ghabayen (2012) shows a negative association between board compositions payout ratio. In this way, the study
complements efforts of Byoun et al. (2016) who examine the board diversity affect the corporate dividend policy.
In addition, Adhikari and Agrawal (2018) who examine the peer effect on dividend payout policy, corporate board traits and return policy of listed deposit money banks in Nigeria. The corporate board influence the dividend payout policy (Sani & Musa, 2017). Because of the above discussion and specific references, the study proposes the following hypothesis.
H1: There is a relationship between corporate board diversity and dividend payout policy.
H2: There is a relationship between corporate board independence and dividend payout policy.
H3: There is a relationship between corporate board size and dividend payout policy.
H4: There is a relationship between corporate board members tenure and dividend payout policy.
H5: There is a relationship between corporate board members age and dividend payout policy.
H6: There is a relationship between corporate CEO duality and dividend payout policy.
H7: There is a relationship between corporate financial leverage and dividend payout policy.
H8: There is a relationship between corporate R&D and dividend payout policy.
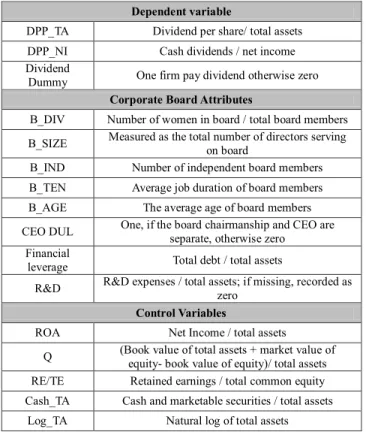
Table 1: Variables Definitions
Dependent variable
DPP_TA Dividend per share/ total assets DPP_NI Cash dividends / net income Dividend
Dummy One firm pay dividend otherwise zero Corporate Board Attributes
B_DIV Number of women in board / total board members B_SIZE Measured as the total number of directors serving
on board
B_IND Number of independent board members B_TEN Average job duration of board members B_AGE The average age of board members CEO DUL One, if the board chairmanship and CEO are
separate, otherwise zero Financial
leverage Total debt / total assets
R&D R&D expenses / total assets; if missing, recorded as zero
Control Variables
ROA Net Income / total assets
Q (Book value of total assets + market value of equity- book value of equity)/ total assets RE/TE Retained earnings / total common equity Cash_TA Cash and marketable securities / total assets
Log_TA Natural log of total assets
3. Data and Methods
This study sample is drawn from all 796 firms listed on the Malaysian stock exchanges (Bursa Malaysia) throughout the period from 2005 to 2016. Firms included in this study final sample need to meet three criteria: (i) availability of a firm's annual report throughout the period from 2005-2016; (ii) availability of a firm's corporate board attributes and innovation investment and financial leverage data from 2005 to 2016; and (iii) availability of dividend payout date from 2005 to 2016. These criteria will be used for numerous reasons, mainly to be consistent with past studies (Mansourinia et al., 2013).
Table 2: Summary Statistics
Variables Mean Std-Div MIN Max
DPR 0 .2803245 0 .3936668 0 4.5652 R&D 0 .0020623 0.0109617 0 0.1022592 LEVERAG
E 0 .180067 0 .1622342 9 1.0878
B_DIV 0.6845238 0.9597256 0 5
B_size 7.247024 1.769136 4 15
B_ten 8.272574 5.324424 0.6 28.44
B-ind 43.99735 12.70675 0 80
B_age 55.56839 7.030765 39.75 74
CEO_dul 0.4910714 0.5006659 0 1
Table 2 describes the summery statistics of non-financial firms from 2005 to 2016. The standard deviation (SD) and mean of board diversity is respectively 0.685 and 0.959, and some firms have no diversity at all in Malaysian context and a maximum of female directors on the board is 5. S.D and mean of board size are approximately 7.24 and 1.76, respectively. The board size in Malaysia looks much smaller than the board size in the developed economies (the US mean board size is 11.45 in Bhagat and Black, (2002), but is close to the size of boards in Australia (e.g., mean size of 6.6 in (Kiel & Nicholson, 2003).
However, Chinese firms have better board size than Malaysia (China board size mean is 9.033, minimum is 7 and maximum is 15 (Pang, Zhang, & Zhou, 2018). The minimum board members are 4 and maximum board members are 15. The board independence means, and the standard deviation is 43.99(12.70) respectively, which is higher than china but less than USA (an independent director on the boards of the USA banks in sample varies between 50 and 94 % with a mean of 81 %). These finding are comparable with Pathan and Skully (2010), reveals from 1997-2004, the proportion of independent directors on the boards of US bank holding companies ranged from
10 (96.55 %) with a mean of 64% (Jizi, Salama, Dixon, &
Stratling, 2013).
Average board members tenure mean is 8.27 and S.D is 5.32 and maximum tenure is 28.44, which is very high because most of Malaysian firms are family-owned (Credit Suisse Research Institute (CSRI)). The average age of board of director mean is 55.56 and S.D 7.03 per cent with a range of 39.75 to 76, which identifies the most firms are family-owned and directors received directorship inherently. The mean of dividend pay-out (DPR_TA) is 0.28, with S.D 0.39, minimum 0 to 4.56. R&D is mean and SD 0.002(0.01) and financial leverage mean and SD is 0.18(0.16).
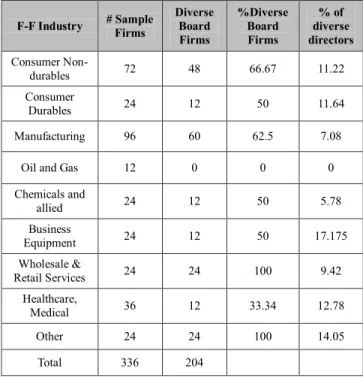
Table 3: Panel B (Sample Distribution Fama and French Industry Classification)
F-F Industry # Sample Firms
Diverse Board Firms
%Diverse Board Firms
% of diverse directors Consumer Non-
durables 72 48 66.67 11.22
Consumer
Durables 24 12 50 11.64
Manufacturing 96 60 62.5 7.08
Oil and Gas 12 0 0 0
Chemicals and
allied 24 12 50 5.78
Business
Equipment 24 12 50 17.175
Wholesale &
Retail Services 24 24 100 9.42
Healthcare,
Medical 36 12 33.34 12.78
Other 24 24 100 14.05
Total 336 204
Study reports the sample distribution across the Fama and French 12 industries (available at French‟s website) excluding financial industries in Panel B manufacturing and consumer non-durable and health care are associated with the largest proportions of firms with diverse boards and the highest percentages of diverse directors in the board, whereas Oil, gas, and coal extraction and products have the lowest percentages of diverse-board firms and diverse board members. Given the substantial variation in board diversity across industries, study incorporate industry effects as well as year effects in multivariate regressions.
4. Results and Discussion 4.1. Sample Distribution
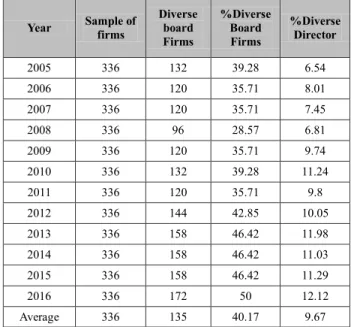
Table 4: Panel A. Sample Distribution by year (Board Diversity) Year Sample of
firms
Diverse board Firms
%Diverse Board Firms
%Diverse Director
2005 336 132 39.28 6.54
2006 336 120 35.71 8.01
2007 336 120 35.71 7.45
2008 336 96 28.57 6.81
2009 336 120 35.71 9.74
2010 336 132 39.28 11.24
2011 336 120 35.71 9.8
2012 336 144 42.85 10.05
2013 336 158 46.42 11.98
2014 336 158 46.42 11.03
2015 336 158 46.42 11.29
2016 336 172 50 12.12
Average 336 135 40.17 9.67
Table 4 shows that the sample consists of 336 firm-year
observations that are directly collected from respective annual reports of companies available at BURSA Malaysia website. The financial variables data is collected from Thomson Reuters DataStream from the year 2005 to 2016.
Panel A shows the number of sample firms. The number of firm‟s with diverse boards, the percentage of firms with diverse boards, and the percentage of woman in board of each year. Highest divers‟ board in Malaysian context was in 2016 which shows 172 almost 12.12% members were female; almost 50% firms have diverse board members in board. However lowest diverse year was 2008 only 96 observations out of 336 was ladies board members; these are almost 6.81% female in board.
Table 5: Multicollinearity Test
Variables VIF
Board diversity 1.85
Board size 1.74
Board independence 1.64
Board tenure 1.51
Board members age 1.43
Leverage 1.32
R&D 1.28
Table 6: Pearson Correlation Matrix
Variable 1 2 3 4 5 6 7 8 9
1 DPR 1.0000
2 R&D 0.0307 1.0000
3 LEV -0.278* 0.0505 1.0000
4 B_DIV -0.148* -0.1168 -0.0166 1.0000
5 B_SIZE 0.2536* -0.136* -0.1070 -0.0014 1.0000
6 B_TEN 0.2556* -0.1182 -0.0969 -0.0729 0.173* 1.0000
7 B_IND -0.0220 0.1597* 0.0675 0.0171 -0.1304 -0.0610 1.0000
8 B_AGE 0.2276* 0.0330 -0.081* -0.146* 0.3069* 0.583* 0.0994 1.0000
9 B_DUL -0.1001 -0.0629 0.1676* -0.0742 0.1087 0.0683 -0.251 -0.0807 1.0000
OBS 336 336 336 336 336 336 336 336 336
* p<0.05
4.2. Results of Correlation
Researcher study also investigates the Pearson correlation coefficients among the variables. There is positive and low degree of correlation identified between dividend payout policy and R&D, but statistically insignificant. Same as R&D and financial leverage are positive and statistically significant and low degree correlation is identified. Dividend payout policy correlation
with financial leverage is negative and degree of correlation is low. There is negative and low degree correlation between DPR and B_div. The R&D and financial leverage have same negative and low degree correlation with board diversity. There are moderator and positive correlations between board diversity measures and board size (34 to 44 per cent), and the positive and low degree correlation between DPR with board size and board tenure is identified. However, the correlation between
CEO_dual and B_ind with DPR is negative and low-level correlation is identified.
The correlation between board members age and DPR is positive and statistically significant. At the finally the relationship between DPR is statistically significant except board independence. Financial leverage correlation with all variables is negative and except B_age and CEO duality.
R&D correlations with all results are mixed in term of significant level. The financial leverage correlations between other variables are negative without b_ind and CEO duality and statistically mixed results are identified.
The correlation between board size and board independence is negative but statistically significant and remaining all variable have positive and significant correlation is identified. Correlation between board tenure and board independence is negative and statistically insignificant, remaining all variable are statistically significant and positive correlation with board tenure.
Board members average age and CEO duality have negative and statistically insignificant correlation in correlation matrix of the Malaysian non-financial firms.
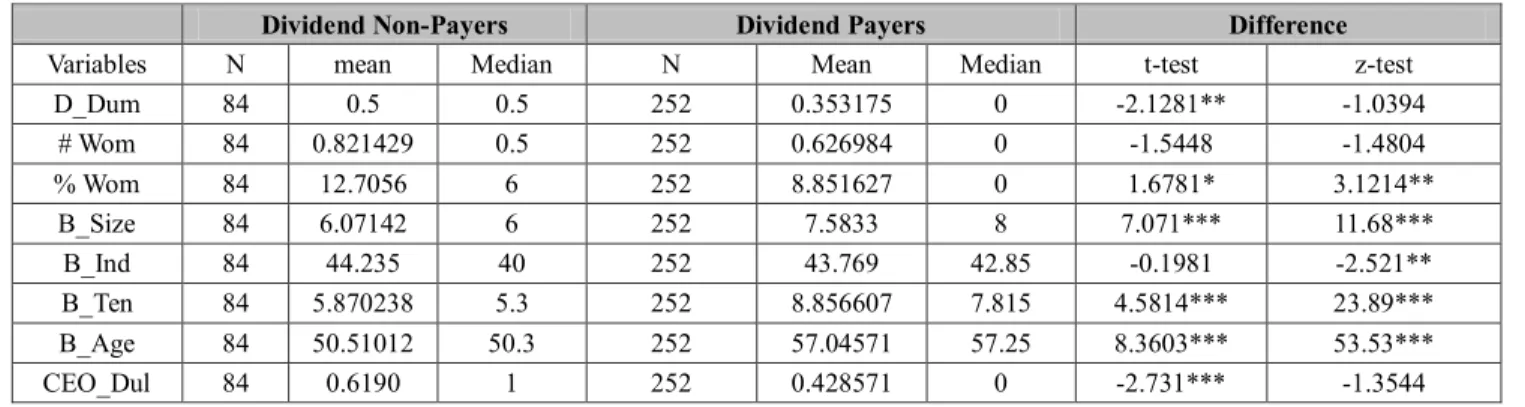
Table 7: Difference between t-test and z-test Dividend Payers and Non-Payers
Dividend Non-Payers Dividend Payers Difference
Variables N mean Median N Mean Median t-test z-test
D_Dum 84 0.5 0.5 252 0.353175 0 -2.1281** -1.0394
# Wom 84 0.821429 0.5 252 0.626984 0 -1.5448 -1.4804
% Wom 84 12.7056 6 252 8.851627 0 1.6781* 3.1214**
B_Size 84 6.07142 6 252 7.5833 8 7.071*** 11.68***
B_Ind 84 44.235 40 252 43.769 42.85 -0.1981 -2.521**
B_Ten 84 5.870238 5.3 252 8.856607 7.815 4.5814*** 23.89***
B_Age 84 50.51012 50.3 252 57.04571 57.25 8.3603*** 53.53***
CEO_Dul 84 0.6190 1 252 0.428571 0 -2.731*** -1.3544
*** p<0.01, ** p<0.05, * p<0.1.
4.3. Difference between T-test and Z-test, Dividend Payers and Non-Payers
Table 7 identifies the difference-in-difference t-test and z-test. The t-test a state to a type of parametric test that is implied to find a way of means of two sets of data fluctuates from one to another when variance is not given. Z-test employees a hypothesis test which ascertains if the means of two datasets are different from each other when variance is given. To check how additional diverse directors in the board affect payout policies. Study contrast payout measures across the number of diverse directors on the board in Table 6.
Table 7 the board diversity uses three proxies that are identified in Table 1 with their definitions. Diverse dummy has negative effects on dividend payers and non-payer firm.
There is a statistically significant relationship between board diversity dummy variable and dividend payout policy in t-test and in z-test the relationship is insignificant.
The number of women effects on dividend payout policy is negative and statistically insignificant in both tests. The 3rd proxy of board diversity is the percentage of women has a positive relationship with dividend payout policy.
Therefore, in t-test and z-test the relationship between corporate board diversity percentages of women has statistically significant. These all discussion identifies that
there is a difference in dividend payout policy between the diver‟s board firms and non-divers board firms, payer firms and non-payer firms (Horbach & Jacob, 2018).
The relationship between board size and dividend payout policy is positive and statistically significant in both t-test and z-test. This means the large board size effect in both forms of dividend payers and non-payers (Ghasemi et al., 2013). The relationship between board independence and dividend payout policy in both tests has negative and statistically significant, which means the board independence affect the dividend payout policy negatively in both forms dividend payers and non-payer firm, that is already revealed by Mansourinia et al. (2013).
The relationship between board tenure and dividend payout policy is positive and statistically significant in both t-test and z-test. The relationship looks highly powerful to explain its importance in the relationship between board tenure and dividend payout policy. The relationship between board members age and dividend payout policy is positive and statistically significant in both t-test and z-test.
The younger board members always announce healthy computable dividend payout policy (Serfling, 2014). This means the old board members affect positively on dividend payout policy in forms, dividend payers and non-payer firm.
CEO duality has a negative and statistically significant outcome that means CEO duality affect the dividend
payout policy negatively (Chen, Leung, & Goergen, 2017).
However, the relationship CEO duality and dividend payout policy are statistically significant in t-test and statistically insignificant in z-test. There is a negative
relationship between R&D and dividend payout policy in both models. However, the relationship between R&D and dividend payout policy is statistically significant in t-test and statistically insignificant in z-test
Table 8: Difference between t-test and z-test, Dividend Payers and Non-payers and Divers board and Non-diverse board Non-Diverse Board
(Diverse Dum= 0) Diverse Board
(Diverse Dum= 1) Difference-in-Difference
Variables N Mean Median N Mean Median t-test z-test
Dividend payers
DIV_TA 144 0.024178 0.015217 108 0.064287 0.006502 1.0959 0.3937
DIV_P 144 0.105847 0.046133 108 0.146757 0.039996 1.7929* 1.1369
DIV_NI 144 0.431431 0.333056 108 0.228189 0.180477 -0.4666 -0.6511
LogTA 144 5.496455 5.331887 108 5.803212 5.724414 5.6695*** 4.1476***
Leverage 144 0.191372 0.1632 108 0.150999 0.128234 -2.1775** -0.3098
Q 144 1831572 525326.5 108 7048158 662133.9 4.9318*** 5.5e+0***
ROA 144 0.012091 0.012073 108 0.023271 0.008644 1.2234 0.1310
RE_TE 144 0.209475 0.322876 108 0.126008 0.09695 0.0361 0.0352
Cash_TA 144 0.151288 0.113059 108 0.125788 0.09695 -2.654*** -0.3151
R&D 144 0.233298 0.222092 108 0.276029 0.299802 1.9776** 0.0055
Dividend Non-payers
LogTA 36 5.06844 4.723554 48 0.000686 0 0.8718 0.3943
Leverage 36 0.219144 0.04369 48 0.000718 0 0.2251 0.0464
Q 36 278414.1 10.2303 48 0.008686 0 1.4506 4.3e+0***
ROA 36 0.001705 0.000144 48 -0.00543 0.002153 2.1224** 0.0670
RE_TE 36 0.053007 0.162908 48 0.200436 0.1536 -3.050*** -3.185***
Cash_TA 36 0.310584 0.360198 48 292618.9 176170.5 -2.9280 -0.5776
*** p<0.01, ** p<0.05, * p<0.1.
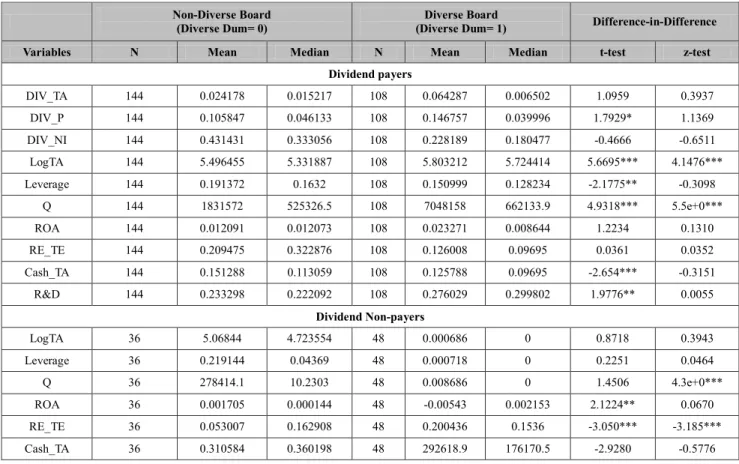
4.4. Difference between t-Test and z-Test, Dividend Payers, Non-Payers and Divers Board, Non-Diverse Board Analysis
Table 8 shows the four demission of financial data effect on board diverse verses board non-diverse firm and dividend payers and dividend non-payer firm. The board diversity is introduced a dummy variable which is identifies the 0 for non-diverse board and 1 for diverse board. Study more focus is on dividend payers and dividend not payer firm.
First, in Table 8 explain that the dividend payers and non-divers board and diverse board firm‟s difference-in- difference. Table 8; used three proxies for dividend payout policy that are already explained in Table 1. There is positive relationship identified however, statistically insignificant effect on DIV_TA in dividend payers and non-payer firm in both t-test and z-test. The DIV_P have
positive and statistically significant relationship in t-test.
However, there is positive and statistically insignificant relationship is identified in z-test. The 3rd proxy of dividend payout policy DIV_NI shows negative and statistically insignificant relationship in dividend payers, diverse and non-diverse firms. Based on results there are very less effect of Malaysian firm diverse board and non- divers board firms on the policy of dividend payout.
The Log_ta regression shows positive and statistically significant relationship in dividend payers, diverse and non-diverse firms in both t-test and z-test. Based on results there is very high effect of Malaysian firm of Log_ta on the diverse firms‟ board and non-divers board firms on the policy of dividend payout. The financial leverage shows negative and statistically significant relationship in dividend payers, diverse and non-diverse firms in t-test.
However, the financial leverage shows negative and statistically insignificant relationship in dividend payers, diverse and non-diverse firms in z-test. Based on results
there is very high effect of Malaysian firm financial leverage on the diverse firms‟ board and non-divers board firms on the policy of dividend payout.
Table 8 part 2nd is about dividend non-pares group of divers and non-diverse firms. The Log_ta regression shows positive and statistically insignificant relationship in dividend non-payers, diverse and non-diverse firms in both t-test and z-test. Based on results there is very less and insignificant effect of Malaysian firm in Log_ta regression
on the diverse firms‟ board and non-divers board firms on the policy of non-dividend payer firms. The financial leverage shows positive and statistically insignificant relationship in non-dividend payers, diverse and non- diverse firms in both t-test and z-test. Based on results there is very less effect of Malaysian firm financial leverage on the diverse firms‟ board and non-divers board firms on the policy of non-dividend payer firms.
Table 9: The Likelihood of Dividend Payout with Logistic Regression
Variables D_Dummy
(1)
D_Dummy (2)
D_Dummy (3)
D_Dummy (4)
D_Dummy (5)
B_div -0.74947
***
B_size 0.296666
***
B_ten 0.09719
***
B_ind -0.00556
(0.5742)
B_age 0.09202
***
LOGTA 1.349725
***
0.833623
***
1.049898
***
1.040430
***
0.979624
**
LEVERAGE -3.461812
***
-2.802885
***
-2.481392
***
-2.769789
***
-2.800860
***
R_D -140.7733
* -86.30864
(0.2052) -73.82816
(0.2200) -110.5079
(0.1251) -87.03756
(0.1329)
Q 8.45E-08
(0.3046)
9.30E-08 (0.2820)
1.29E-07 (0.2288)
1.33E-07 (0.2474)
9.54E-08 (0.2343)
ROA 0.167625
(0.8913)
-0.541885 (0.6561)
-0.666203 (0.5830)
-0.427946 (0.7353)
-0.512508 (0.6731)
RE_TE -0.115882
(0.5054)
-0.044643 (0.7969)
-0.126812 (0.4514)
-0.065529 (0.7004)
0.009564 (0.9571)
CASH_TA 0.233084
(0.8366)
0.229821 (0.8347)
0.727582 (0.5002)
0.687455 (0.5226)
0.380787 (0.7254)
Year YES YES YES YES YES
Industry YES YES YES YES YES
Constant -5.644791
***
-5.652320
***
-5.677379
***
-4.530705 (0.299)
-9.417882
***
McFadden R2 0.225720 0.190024 0.190397 0.160165 0.205972
Observations 336 336 336 336 336
*** p<0.01, ** p<0.05, * p<0.1.
4.5. Results of Dividend Payout with Logistic Regression
Table 9 shows that dividend payout policy, the dividend dummy is used as a proxy of dividend payout relationships with corporate board traits are significant except board independence. The research paper used dividend payout as
a dummy variable, 1 for dividend payer firms and 0 for non-dividend payer firms. The study uses the logistic regression model because the depended variable is dichotomous. The logistic regression is the techniques which allow the dichotomous variable to assess the variation in independent variables. Study table 9; shows all variable one by one in the support of control variables and
identifies the board diversity relationship with dividend payout policy is negatively and statistically significant with a large coefficient which means board diversity increase negatively affect the dividend payout policy. The negative relationship between board diversity and dividend payout policy already identify from different researches, unfortunately, these results contradict with (Gyapong, Ahmed, Ntim, & Nadeem, 2019).
Table 9 shows board size relationship with dividend payout policy is positive and statistically significant with large coefficient, which means an increase in corporate board size positively affect the dividend payout policy. The positive relationship between board size and dividend payout policy already identify from different researches (Uwalomwa, Olamide, & Francis, 2015). The board tenure relationship with dividend payout policy is positive and statistically significant with small coefficient, which means
an increase in corporate board member‟s tenure positively affect the dividend payout policy. The positive relationship between board members job tenure and dividend payout policy already identify from different researches (Finkelstein & Hamhrick, 1997).
The relationship between corporate board independence and dividend payout policy is negative and statistically insignificant, that there is very small level and negative relationship with board independence and dividend payout policy in this ample which is already supported by the previous researches (Batool & Javid, 2014). The relationship between corporate board members average age and dividend payout policy is positive and statistically significant that there is moderator coefficient that means a small relationship of board members average age and dividend payout policy in this ample which is already supported by the previous researches (Badu, 2013).
Table 10: Dividend Payout Ratio Regression
Variables DIV_TA
(1)
DIV_TA (2)
DIV_TA (3)
DIV_TA (4)
DIV_TA (5)
B_div 0.00544
(0.5171)
B_size -0.0018
(0.7169)
B_ten -0.000657
**
B_ind 0.00038
(0.5417)
B_age 0.0007
(0.5351)
LOGTA -0.042385
**
-0.041280
**
-0.042826
**
-0.043276
**
-0.045618
***
LEVERAGE 0.032410
(0.5491)
0.031629 (0.5597)
0.029806 (0.5849)
0.029428 (0.5885)
0.036172 (0.5057)
R_D 0.071388
(0.9209) -0.025802
(0.9713) -0.023089
(0.9742) -0.060644
(0.9329) -0.020783
(0.9767)
Q 2.15E-09
**
2.29E-09
**
2.25E-09
**
2.29E-09
**
2.39E-09
**
ROA 2.951961
***
2.957707
***
2.959521
***
2.952269
***
2.957039
***
RE_TE 0.002031
(0.8081)
0.001870 (0.8233)
0.002252 (0.7883)
0.002373 (0.7773)
0.002361 (0.7783)
CASH_TA -0.040443
(0.5164)
-0.042944 (0.4901)
-0.046211 (0.4560)
-0.048197 (0.4379)
-0.045037 (0.4670)
Year YES YES YES YES YES
Industry YES YES YES YES YES
Constant 0.220702
**
0.231266
**
0.233342
**
0.214023
**
0.202702
**
McFadden R2 0.800468 0.800292 0.800331 0.800440 0.800447
Observations 336 336 336 336 336
*** p<0.01, ** p<0.05, * p<0.1.
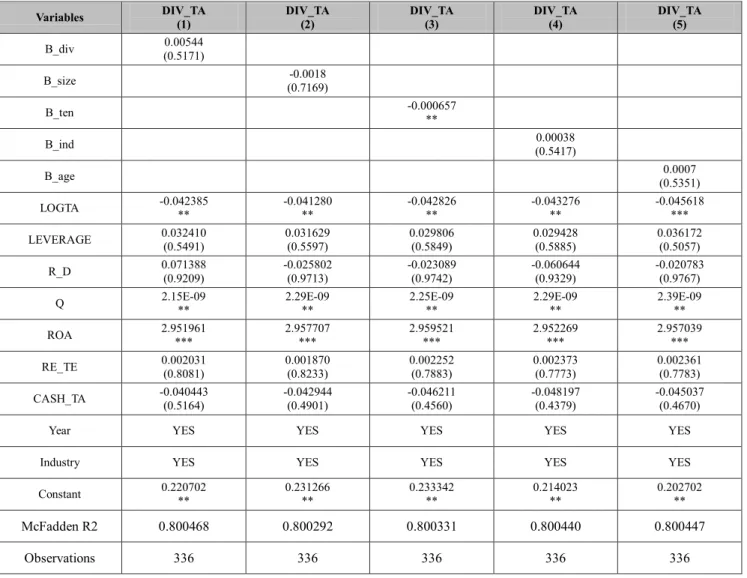
4.6. Results of Dividend Payout Ratio with Regression
Table 10 shows the dividend payout policy (DIV_TA) relationships with corporate board traits are insignificant except board independence. DIV_TA results are opposing the previous Table 8 analysis with the dependent variable was dividend dummy. The research paper used dividend payout as a DIV_TA, explanation of DIV_TA is available in Table 1. The research paper uses the logistic regression model because the depended variable is dichotomous. The OLS regression techniques are used to identify the variation in variables. Study table 10 shows all variable one by one in the support of control variables and identifies the board diversity relationship with dividend payout policy (DIV_TA) is positively and statistically insignificant with a small coefficient which means board diversity increase or decrease, affects in miner on dividend payout
policy. The positive relationship between board diversity and dividend payout policy already identify from different researches (Gyapong et al., 2019).
Table 10 shows board size relationship with dividend payout policy is negative and statistically insignificant with very small coefficient, which means an increase in corporate board size negatively and miner effect on DIV_TA. The negative relationship between board size and dividend payout policy already identify from different researches Grullon (2009). The board tenure relationship with dividend payout policy is negative and statistically significant with very small coefficient, which means an increase in corporate board member‟s tenure negatively affect the dividend payout policy. The negative relationship between board members job tenure and dividend payout policy contradict with already identified from different researches (Finkelstein & Hamhrick, 1997).
Table 11: The Effect of Additional Diverse Director on Dividend Payout Policy Variables D_Dummy
(1) D_Dummy
(2) D_Dummy
(3) DIV_TA (4) DIV_TA
(5) DIV_TA
(6)
All sample Div_CEO
=1
Div_CEO
=0 All sample Div_CEO
=1
Div_CEO
=0
DIV_CEO -0.28140
(0.3273)
0.0029 (0.855)
DIV_DUM -1.5908
***
-1.521492
***
-2.62575
***
0.0118 (0.472)
-0.006002 (0.5541)
0.013475 (0.7661)
LOGTA 1.22720
*** 1.84038
*** -3.78602
** -0.041
*** -0.019920
(0.0974) -0.025060
(0.5824)
LEVE -3.5798
***
-5.339305
***
0.770054 (0.8053)
0.03271 (0.5483)
0.088001
***
-0.177362 (0.2467)
R_D -162.59
*
-256.9160 (0.1556)
-71.1980 (0.8626)
0.08604 (0.9051)
0.018956 (0.9570)
-1.064961 (0.8912)
Q 1.09E-0
(0.2336)
-3.77E-09 (0.9542)
1.00E-05 (0.0164)
2.19E-09
*
1.43E-09 (0.0657)
-2.22E-12 (0.9995)
ROA 0.318295
(0.7956)
-0.174794 (0.8898)
5.767290 (0.4419)
2.951133
***
3.077704
***
0.120575 (0.8322)
RE_TE -0.1116
(0.5690) -0.0867
(0.7433) 0.2261
(0.5058) 0.001825
(0.8310) 0.001848
(0.7069) 0.022394
(0.3045)
CASH_TA 0.217801
(0.8496)
0.824143 (0.5332)
-10.0828
**
-0.03659 (0.5625)
0.017915 (0.6208)
-0.117148 (0.5361)
Year YES YES YES YES YES YES
Industry YES YES YES YES YES YES
Constant -4.62566
**
-8.062119
***
19.9854 (0.0338)
0.21510 (0.0283)
0.083411 (0.1986)
0.216932 (0.4055)
McFadden R2 0.234725 0.225235 0.474413 0.800535 0.966586 0.764592
Obs 336 216 120 336 216 120
*** p<0.01, ** p<0.05, * p<0.1.
The relationship between corporate board independence and dividend payout policy is positive and statistically
insignificant, that there is a very less and positive relationship with board independence and dividend payout