서 론
기후변화에 따른 지구온난화 현상은 전 지구적으로 매 우 중요한 문제로 인식되고 있으며, 이산화탄소, 메탄, 아 산화질소 등이 많은 영향을 미치는 것으로 알려져 있다
(Scheutz and Kjeldsen, 2004). 이탄습지는 온실가스의 주 원천으로 기후 변화에 따라 습지 토양의 온도 상승은 이 산화탄소와 메탄 같은 온실가스의 배출을 증가시키는 것 으로 알려져 있다(Pannikov and Dedysh, 2000). 국내에 는 고위도 지역의 툰드라에 존재하는 이탄지대 만큼의
─
─ 409 ──
온도 변화에 따른 산지습지 토양의 N2O 배출 양상
김 상 훈∙임 성 환∙추 연 식*
(경북대학교 생명과학부)
N2O Emissions on the Soil of Alpine Wetland by Temperature Change. Kim, Sang-Hun, Sung- Hwan Lim and Yeon-Sik Choo* (Department of Life Science, Kyungpook National University, Daegu 702-701, Korea)
Global warming due to climate change is a problem facing the entire world. Several factors, such as CO2concentration, level of warming, soil temperature, precipitation, water content of soil and denitrification by denitrifying bacteria influence the emission of nitrous oxide (N2O) from soil. In this study, we investigated nitrous oxide emissions from the soil of two wetlands, Jilmoineup in Mt. Odae and Moojechineup in Mt. Jungjok, according to temperature change. Soil collected in Jilmoineup in July showed increasing N2O emissions as temperature increases, but did not show any significant differences at 10��C (p⁄⁄0.05). Soil of 15��C and 20��C showed increasing pattern of N2O emissions until 24 h. After that, however, there was no difference in temperature. Overall, N2O emissions showed significant differences according to temperature (p⁄⁄0.05). Soil collected from Moojechineup in July showed increasing N2O emissions according to temperature increase, but did not show any significant differences at 10��C (p⁄⁄0.05) as was the case for Jilmoineup soil. On the other hand, two wetland soils showed a slight increase of N2O emissions by additional nitrogen supply, but did not show any significant differences in the presence of nitrogen or between nitrogen sources. In conclusion, increasing temperature the wetland soil increased the emission of N2O, which is a known greenhouse gas. In order to more clearly identify N2O emissions, various subsequent studies such as the influence and correlation of several factors are required.
Key words : N2O emissions, wetland, Jilmoineup, Moojechineup, climate change
* Corresponding author: Tel: +82-53-950-5346, Fax: +82-53-953-3066, E-mail: yschoo@knu.ac.kr
ⓒ The Korean Society of Limnology. All rights reserved.
This is an open-access article distributed under the terms of the Creative Commons Attribution Non-Commercial License (http://creativecommons.org/licenses/by-nc/3.0/), which permits unrestricted non-commercial use, distribution, and reproduction in any medium, provide the original work is properly cited.
라의 대표적인 중층이상의 이탄습지는 강원도 대암산 용 늪, 울산 정족산 무제치늪, 강원도 오대산국립공원 질뫼 늪과 소황병산늪, 조개동늪, 경북 천축산 박달습지, 경남 지리산국립공원 왕등재늪, 외고개늪, 정령치늪을 포함하 여 많은 이탄습지들이 존재한다. 지금까지 우리나라 이탄 습지에 대한 연구는 특이한 식생이 나타나는 지역으로 인식하여, 현존식생, 고식생 등에 관한 연구가 주를 이루 고 있으며, 습지 생성 지형이나 수리수문에 관한 연구가 일부 이루어져 왔다(Kim, 2009).
한편, 국외에서는 2000년대 이후 지구온난화와 연계하 여 이탄토양으로부터 탄소 배출이 지구온난화를 가속화 시킬 것이라는 연구 결과들이 보고되면서 이탄토양에서 이산화탄소 및 메탄의 배출에 대한 연구가 지속적으로 이루어지고 있으며(Wu et al., 2010), 더불어 온실 기체인 아산화질소의 배출에 대한 연구 또한 이루어지고 있는 상황이다(Maag and Vinther, 1996).
이탄토양으로부터 이산화탄소 및 메탄가스 배출에 영 향을 주는 요인으로는 토양온도(Crill et al., 1988: Morri- ssey and Livingston, 1992; Dunfield et al., 1993; Valen- tine et al., 1994; Fechner-Levy and Hemond, 1996; Groβe, 1996), 지하수위(Dise, 1993; Moore et al., 1994; Bubier, 1995; Kettunen et al., 1996; Bellisario, 1999; Pelletier et al., 2007; Treat et al., 2007), 이탄의 질(Segers, 1998;
Coles and Yavitt, 2002), 식생형(Dise, 1993; Bubier, 1995;
Waddington et al., 1996; Joabsson et al., 1999; Treat et al. 2007), 토양의 산도(Dunfield et al., 1993; Valentine et al., 1994; Hanson and Hanson, 1996; Garcia et al., 2000;
Dedysh, 2002; Kamal and Varma, 2008), 미네랄 함량
아산화질소(N2O)는 대표적인 온실가스인 이산화탄소 에 비하여 298배에 온실효과를 유발하는 것으로 알려져 있으며(IPCC, 2007), 이러한 이유로 토양에서 배출되는 아산화질소에 대한 여러 연구가 진행되고 있다. 토양으로 부터 N2O 배출에 영향을 미치는 요인으로는 CO2농도와 온난화정도(Ineson et al., 1998; Kang et al., 2001; Kaner- va et al., 2007; Carter et al., 2011), 토양온도와 강우량 (Kanerva et al., 2007; Cantarel et al., 2011), 토양의 수분 함량(Kanerva et al., 2007; Dijkstra, 2010), 질화세균의 탈질소작용(Wrage et al., 2001), 다른 식물재배를 통한 배 출(Hyvoenen et al., 2009) 등이 연구되어져 있으나, 국내 에서는 이탄습지가 많음에도 불구하고 N2O 가스배출에 대한 연구가 이루어져 있지 않은 상태이다.
본 연구에서는 강원도 오대산국립공원 내 질뫼늪과 울 산 정족산 무제치늪에서 토양을 채취하여 토양 온도 변 화와 부가적인 질소원의 공급이 산지습지 토양의 아산화 질소의 배출에 어떠한 영향을 미치는지를 규명하고자 하 였다.
재료 및 방법
1. 연구지역 개관
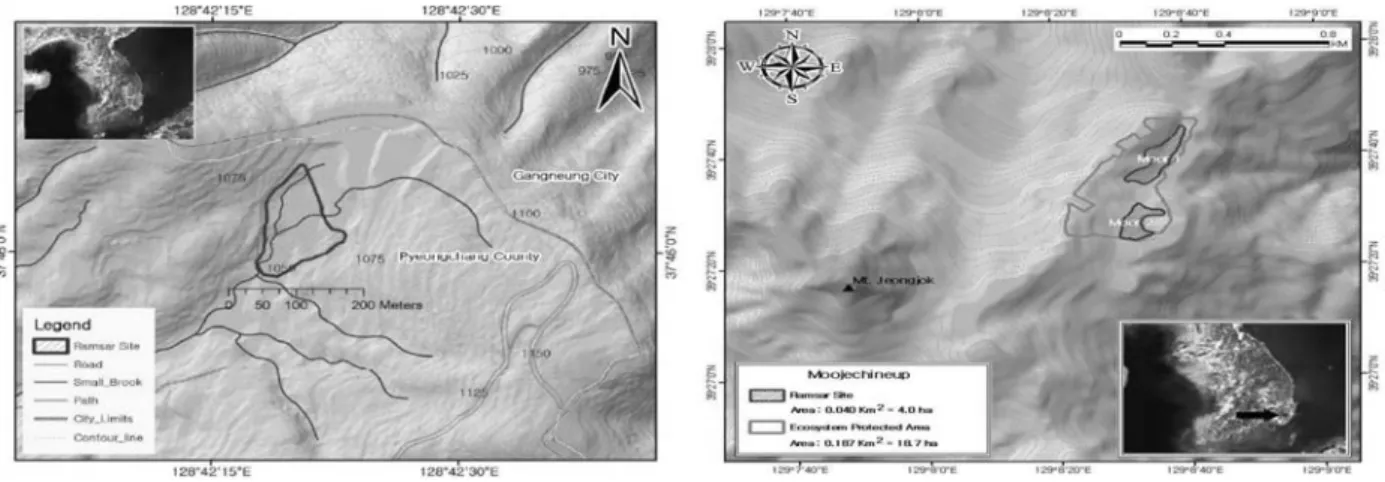
람사르 지정 습지 가운데 이탄의 발달 정도가 우수하 고 접근성이 떨어져 보존상태가 양호한 오대산 국립공원 내 질뫼늪과 대암산 용늪과 더불어 국내 최대 이탄습지 로 알려진 울산 정족산 무제치늪을 조사지로 선정하였으 며, 조사지 개황은Fig. 1과 같다.
Fig. 1. The survey areas of two wetlands (Left: Jilmoineup, Right: Mujechineup). The source of the picture was as follow:
http://www.ramsar.org).
갖는 장소를 선정하여 토양을 채취하였다. 채취한 토양을 실험실로 이동하는 동안에는 0~4�C의 아이스박스를 이 용하여 냉장상태를 유지하였다. 채취한 토양의 일부는 토 양 온도변화에 따른 아산화질소(N2O) 가스측정에 이용하 였으며, 측정 후 토양은 상온(20~25�C)에서 풍건하여,
직경 2 mm 체로 체질하여 토양의 이화학적 특성 분석에
이용하였다.
2) 토양가스 분석
N2O 가스의 포집은 Static chamber method를 이용하 였다(Smith et al., 2012). 동일량의 토양시료를 10 cm× 10 cm×20 cm (H)의 고무마개가 달린 알루미늄 챔버에 넣어 밀봉한 다음 저온장치에 넣고 10분간 안정화시킨 후 1 mL 주사기(gas-tight syringer)를 이용하여 초기 가 스 시료(control)를 포집하였다. 온도변화에 따라 배출되 는 N2O 가스는10�C, 15�C 그리고20�C에서 4시간 간격 으로36시간 동안 배출되는 가스를 각3반복으로 포집하 였다. 또한 질소원 부가에 따른 N2O 가스 배출을 비교하 기 위하여 1 N KNO3용액과1 N NH4용액200 mL을 각 각 토양시료 챔버에 주입한 후 위와 동일한 방법으로 가 스를 포집하였다.
N2O 가스의 정량은 HP-PLOT/Q 19095P-Q04 column 을 사용하여 Gas Chromatograph (7890A GC, Agilent)를 이용하여 분석하였다(Detector, Electrion capture detec- tor (ECD); Injection temperature, 250�C; Detector tem- perature, 320�C; Split ratio, 10 : 1; Column flow rate, 6 mL min-1). N2O 배출량은 표준 N2O 가스를 이용하여 100 ppb에서 5 ppm까지 5단계로 희석하여 검량선 작성 후 사용하였다.
3) 토양의 pH, 유기물함량 및 질소함량
토양 pH는 2 mm체를 통과한 음건 토양 5 g을 50 mL 삼각플라스크에 취하여 증류수 25 mL를 가한 다음 한 시간 동안 진탕한 후 방치한 다음 pH meter (Orion 710) 를 이용하여 측정하였다. 토양 내 유기물함량과 질소함량
량은 원소분석기로 측정한 유기탄소로부터 유기물함량을 환산하였다.
토양의 유기물함량(%)==C (%)×1.724
4) 총 이온함량의 측정
가용성 토양 총 이온함량은100 mL 삼각플라스크에 토 양5 g을 넣고25 mL의 증류수를 가하여30분간 진탕, 여 과한 후 여과된 시료를Mettler Toledo MX 300을 이용하 여 전기전도도(EC)를 측정하여NaCl 등가로 환산하였다.
5) 결과분석
통계처리는SPSS 12.0을 이용하여 각 온도 처리구에서 3개씩 채취한 토양가스 시료의N2O 누적발생량의 평균값 을 구하였으며, 평균값의 유의한 차이는Oneway ANOVA (Duncan test)를 이용하였으며, 계절별, 장소별, 질소원별 의 평균값의 차이는t-test를 이용하여 처리하였다.
결 과
1. 토양 이화학적 특성
1) 질뫼늪
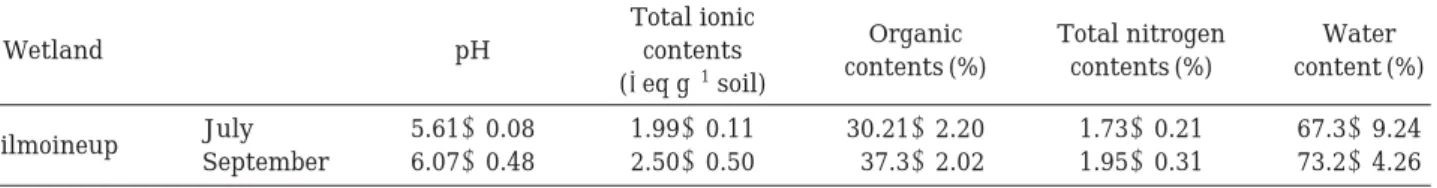
가스를 채취한 토양으로부터 분석한 질뫼늪 토양의 이 화학적 특성을 분석한 결과는Table 1과 같다.
7월 질뫼늪 토양에서 산도는 평균pH 5.61로 조사되었 으며, 총 이온함량은 평균1.99μeq g-1soil, 유기물 함량은 30.20%, 총 질소함량은 평균 1.73%, 수분함량은 67.32%
로 조사되었다.
9월 질뫼늪 토양에서 산도는 평균pH 6.07, 총 이온함 량은 평균2.5μeq g-1soil, 유기물함량은37.25%, 총 질소 함량은1.95%, 수분함량은73.16%로 조사되었다.
계절에 따른 토양의 산도와 유기물함량 간에는 유의적 인 차이가 나타났으나(P⁄0.05), 총 이온함량, 총 질소함 량, 수분함량에서는 큰 차이를 보이지 않았다.
Table 1. Physicochemical characteristics of Jilmoineup soil collected in July and September, 2011.
Total ionic
Organic Total nitrogen Water
Wetland pH contents
contents (%) contents (%) content (%) (μeq g-1soil)
Jilmoineup July 5.61±0.08 1.99±0.11 30.21±2.20 1.73±0.21 67.3±9.24 September 6.07±0.48 2.50±0.50 37.3±2.02 1.95±0.31 73.2±4.26
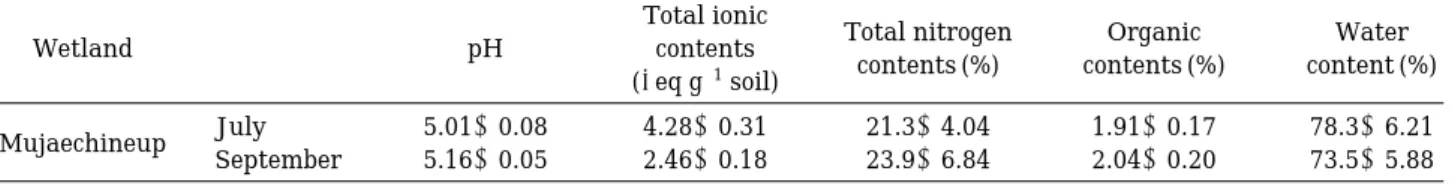
2) 무제치늪
가스를 채취한 토양으로부터 분석한 무제치늪 토양의 이화학적 성질을 분석한 결과는Table 2와 같다. 7월 무제 치늪 토양에서 산도는 평균 pH 5.01로 조사되었으며, 총 이온함량은 평균 4.28μeq g-1soil, 유기물함량은 21.33%, 총 질소함량은 평균1.91%, 수분함량은78.29%로 조사되 었다. 9월 질뫼늪 토양에서 산도는 평균pH 5.16, 총 이온 함량은 평균 2.46μeq g-1soil, 유기물 함량은 23.86%, 총 질소함량은2.04%, 수분함량은73.54%로 조사되었다.
질뫼늪 토양과 달리 무제치늪에서는7월과 9월 채취한 토양 사이에 총 이온함량과 총 질소함량에서 유의적인 차이가 나타났으나(P⁄0.05), 산도, 유기물함량 그리고 수분함량에서는 큰 차이를 보이지 않았다.
2. 아산화질소(N2O) 가스양
1) 질뫼늪 토양의 N2O 배출량
7월 질뫼늪에서 채취한 토양을 챔버에서 10�C, 15�C 그리고 20�C로 조절한 후 4시간 간격으로 36시간 동안
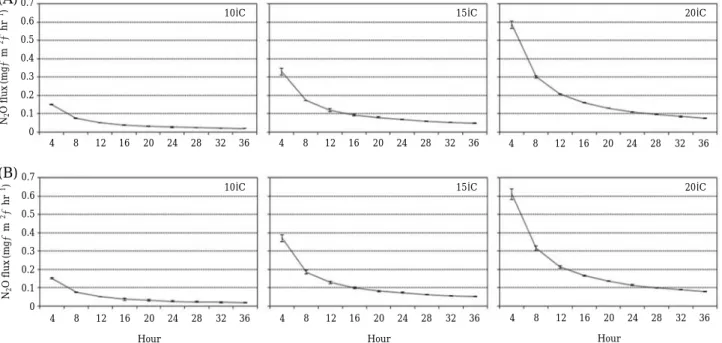
측정한 결과, 모든 온도 처리구에서 처음 4시간 동안에 가장 많은 N2O가 발생되었으며, 시간이 흐름에 따라 발 생량이 현저히 감소하는 양상을 보였다. 36시간 동안 발 생량은10�C에서는0.016~0.019 mg∙m-2∙hr-1, 15�C에 서는 0.040~0.044 mg∙m-2∙hr-1그리고 20�C에서는 0.069~0.072 mg∙m-2∙hr-1의 N2O가 배출되었으며(Fig.
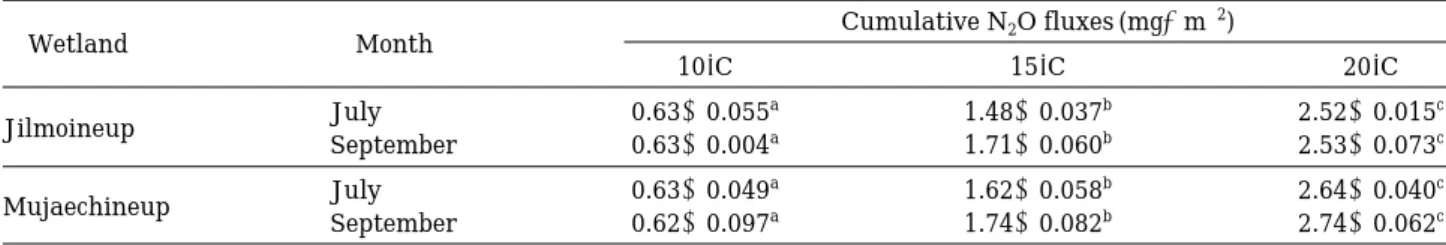
2A), 24시간 동안 누적 발생량은10�C에서는 0.63±0.055 mg∙m-2, 15�C에서는 1.48±0.037 mg∙m-2그리고 20�C 에서는2.52±0.015 mg∙m-2의 값을 보였다(Table 3). 전 반적으로 온도가 증가함에 따라 아산화질소의 배출량이 점차 증가하였으며, 10�C에서는 시간에 따른 큰 차이를 보이지 않았다. 15�C 토양과 20�C 토양은 24시간 동안은 증가하는 양상을 보이나 그 이후는 N2O 발생량의 차이 를 보이지 않았다. 전반적으로 온도에 따른N2O 배출량의 뚜렷한 차이를 보였다(P⁄0.05). 같은 방법으로 9월에 채 취한 토양을 측정한 결과, 10�C에서는 0.017~0.018 mg∙ m-2∙hr-1, 15�C에서는 0.050~0.053 mg∙m-2∙hr-1그리 고20�C에서는 0.073~0.076 mg∙m-2∙hr-1의 N2O가 배 출되었으며, 7월에 비해 다소 높은 N2O 배출량을 보였다
Wetland pH contents
contents (%) contents (%) content (%) (μeq g-1soil)
Mujaechineup July 5.01±0.08 4.28±0.31 21.3±4.04 1.91±0.17 78.3±6.21
September 5.16±0.05 2.46±0.18 23.9±6.84 2.04±0.20 73.5±5.88
Fig. 2. N2O emissions according to the temperature change of Jilmoineup soil collected in July and September (A: July, B:
September).
0.7 0.6 0.5 0.4 0.3 0.2 0.1 0
10�C 15�C 20�C
10�C 15�C 20�C
4 8 12 16 20 24 28 32 36
4 8 12 16 20 24 28 32 36 Hour
4 8 12 16 20 24 28 32 36 Hour
4 8 12 16 20 24 28 32 36 Hour
4 8 12 16 20 24 28 32 36 4 8 12 16 20 24 28 32 36
0.7 0.6 0.5 0.4 0.3 0.2 0.1 0 N2O flux(mg∙m-2∙hr-1)N2O flux(mg∙m-2∙hr-1)
(A)
(B)
(Fig. 2B). 10�C 토양에서 배출된N2O 함량은7월 토양과 거의 유사한 배출양상을 나타내었다.
2) 무제치늪 토양의 N2O 배출량
7월 무제치늪에서 채취한 토양의 온도 처리36시간 동 안N2O 가스 배출량은 질뫼늪 토양과 마찬가지로 처음 4 시간 동안에 가장 많은N2O가 발생되었으며, 시간이 흐름 에 따라 발생량이 현저히 감소하는 양상을 보였다. 36시 간 후10�C에서는0.019 mg∙m-2∙hr-1, 15�C에서는0.047
~0.049 mg∙m-2∙hr-1그리고20�C에서는0.073~0.078 mg∙m-2∙hr-1의 N2O 가스가 배출되었다(Fig. 3A). 온도 가 증가함에 따라N2O 배출량이 점차 증가하였으며, 질뫼 늪과 마찬가지로 10�C에서는 시간에 따른 큰 차이를 보 이지 않았다(P¤0.05). 15�C 토양과20�C 토양은 처음 12 시간까지는 유의적인 차이를 보이지 않았으나, 12시간 이 후부터는 아산화질소 가스양에 있어20�C에서 현저히 많 은 양이 배출되었다(P⁄0.05). 전반적으로 7월 무제치늪
토양은 질뫼늪에 비해15�C 이상의 온도에서 더 많은 아 산화질소 배출량을 보였으며, 24시간 누적발생량에서 유 의한 차이를 보였다(Table 3). 동일한 방법으로9월에 채 취한 토양을 측정한 결과, 10�C에서는 0.016~0.019 mg∙ m-2∙hr-1, 15�C에서는 0.049~0.053 mg∙m-2∙hr-1그리 고 20�C에서는 0.077~0.081 mg∙m-2∙hr-1의 N2O 가스 가 배출되었다(Fig. 3B). 9월 채집한15�C와20�C 처리 토 양의24시간 누적N2O 발생량은 각각1.74±0.082와2.74
±0.062 mg∙m-2로 7월의 1.62±0.058과 2.64±0.040 mg
∙m-2에 비해 많은 양의N2O 가스가 배출되었으며, 7월과 9월간의 누적배출량에서 유의한 차이를 보였다(Table 3).
3. 질소원 투입에 따른N2O 가스 배출량
1) 질뫼늪 토양
9월 채취한 토양에 1 N KNO3용액 200 mL과 1 N NH4Cl 용액200 mL 첨가하여 온도에 따른N2O 배출량을
Jilmoineup July 0.63±0.055 1.48±0.037 2.52±0.015
September 0.63±0.004a 1.71±0.060b 2.53±0.073c
Mujaechineup July 0.63±0.049a 1.62±0.058b 2.64±0.040c
September 0.62±0.097a 1.74±0.082b 2.74±0.062c
The different letters indicate significant differences among temperature treatments, according to Duncan’s test (P⁄0.05, n==3).
Fig. 3. N2O emissions according to the temperature change of Mujaechineup soil collected in July and September (A: July, B: September).
0.7 0.6 0.5 0.4 0.3 0.2 0.1 0
(A)
(B)
10�C 15�C 20�C
10�C 15�C 20�C
4 8 12 16 20 24 28 32 36
4 8 12 16 20 24 28 32 36 Hour
4 8 12 16 20 24 28 32 36 Hour
4 8 12 16 20 24 28 32 36 Hour
4 8 12 16 20 24 28 32 36 4 8 12 16 20 24 28 32 36
0.7 0.6 0.5 0.4 0.3 0.2 0.1 0 N2O flux(mg∙m-2∙hr-1)N2O flux(mg∙m-2∙hr-1)
조사한 결과, KNO3용액을 투입한 질뫼늪 토양에서는 처 리36시간 후10�C에서0.017 mg∙m-2∙hr-1, 15�C에서는 0.045~0.054 mg∙m-2∙hr-1그리고20�C에서는0.074~ 0.076 mg∙m-2∙hr-1의N2O가 배출되었다(Fig. 4A). 10�C 에서 NO3-N을 추가한 토양의 아산화질소 배출량은 무질 소 처리구에 비해 큰 차이를 보이지 않았으며, 온도에 따 른 배출량도 거의 유사한 양상을 나타내었다. NH4Cl 용액 200 mL을 투입한 질뫼늪 토양은 36시간 후 10�C에서는 0.017 mg∙m-2∙hr-1, 15�C에서는 0.050~0.052 mg∙m-2
∙hr-1그리고20�C에서는0.074~0.075 mg∙m-2∙hr-1이 배출되었으며(Fig. 4B), 15�C까지는NO3--N을 추가한 토 양과 거의 유사한 누적배출량을 보였다. 그러나 20�C 누 적 배출량에 있어서는 NO3--N 처리구가2.47±0.095 mg
∙m-2에 비해 NH4 +
+-N 처리구의 2.50±0.092 mg∙m-2로
다소 많이 배출되었으며 두 처리구간 유의한 차이를 보였 다(Table 4).
2) 무제치늪 토양
9월 채취한 무제치 토양에 질소처리를 달리하여 온도 에 따른 N2O 배출량을 조사한 결과, 질소원을 처리하지 않은 토양(Fig. 3B)과 마찬가지로 처음 4시간 동안 가장 많은N2O가 발생되었으며, 시간이 흐름에 따라 발생량이 현저히 감소하는 양상을 보였다. KNO3용액을 투입한 무 제치늪 토양에서는 처리36시간 후10�C에서0.019 mg∙ m-2∙hr-1, 15�C에서는 0.052~0.054 mg∙m-2∙hr-1그리 고20�C에서는0.078~0.081 mg∙m-2∙hr-1의 N2O가 각 각 배출되었다(Fig. 5A). NO3-N을 추가한 토양의N2O 배 출량은 모든 온도처리구에서 질소를 처리하지 않은 9월 Table 4. Cumulative N2O fluxes on the soil of two wetlands by temperature change for 24 h according to additional N
treatments.
Wetland N-treatments Cumulative N2O fluxes (mg∙m-2)
10�C 15�C 20�C
Jilmoineup NO3--N 0.60±0.006a 1.60±0.123b 2.47±0.095c
NH4++-N 0.62±0.004a 1.58±0.063b 2.50±0.092c
Mujaechineup NO3--N 0.63±0.049a 1.82±0.050b 2.64±0.040c
NH4++-N 0.63±0.104a 1.67±0.004b 2.62±0.066c
The different letters indicate significant differences among temperature treatments, according to Duncan’s test (P⁄0.05, n==3).
Fig. 4. N2O emissions according to the temperature change and nitrogen sources of Jilmoineup soil collected in September (A: NO3--N, B: NH4++-N).
0.5 0.4 0.3 0.2 0.1 0
(B)
10�C 15�C 20�C
4 8 12 16 20 24 28 32 36
4 8 12 16 20 24 28 32 36 Hour
4 8 12 16 20 24 28 32 36 Hour
4 8 12 16 20 24 28 32 36 Hour
4 8 12 16 20 24 28 32 36 4 8 12 16 20 24 28 32 36
0.7 0.6 0.5 0.4 0.3 0.2 0.1 0 N2O flux(mg∙m-2∙N2O flux(mg∙m-2∙hr-1)
토양(Fig. 3B)과 유의한 차이를 보이지 않았다. NH4Cl 용 액200 mL을 투입한 무제치늪 토양의N2O 배출은 NO3-- N 처리구와 거의 유사한 양상을 보였으며36시간 후10�C 에서는 0.016~0.019 mg∙m-2∙hr-1, 15�C에서는 0.051~ 0.055 mg∙m-2∙hr-1그리고 20�C 토양에서는 0.081 mg∙ m-2∙hr-1의 N2O가 배출하였으며(Fig. 5B), 10�C에서는 질소처리구간 차이를 거의 보이지 않았으며, 온도에 따른 질소처리구간에 배출량에 있어서도 거의 유사한 양상을 나타내었다. 질소원으로 NO3--N과 NH4
+
+-N을 투입한 두 습지 토양 간에 아산화질소 발생량은 10�C와 15�C에서 는 유의적인 차이를 보이지 않았으나, 20�C에서는 무제 치늪이 질뫼늪보다 질소원 처리구에서 더 많은N2O 누적 배출량을 보였다(P⁄0.05). 질뫼늪에 비해 무제치늪 토양 은NO3--N을 투입한 토양이 NH4
+
+-N을 투입한 토양보다 다소 높은 누적N2O 가스발생량을 나타내었다(Table 4).
전반적으로 두 습지 토양은 부가적인 질소 처리나 질 소원에 따른 가스 배출양상에 있어서는 큰 차이를 보이 지 않았으며, 단지 온도처리에 따른 배출량에서만 뚜렷한 차이를 보여주었다.
고 찰
일반적으로 토양에서 N2O 가스는 호기적 질화작용이 나 혐기적 탈질작용과 같은 미생물학적 과정을 통해 형
성된다. 토양에서 N2O 가스 배출은 온도, pH, 강우, 질소 함량, 토성, 식생, 경지이용 등 다양한 요인에 의해 영향 을 받으며(Frency, 1997), 보편적으로 토양온도가 상승함 에 따라 N2O 배출량이 증가하는 것으로 알려져 있다 (Parton et al., 1996). 질뫼늪 토양의 이화학적 특성을 조 사한 결과, 계절에 따른 토양의 산도와 유기물 함량에서 차이를 다소 보였으나(Table 1), 이러한 차이에도 불구하 고 토양의 N2O 가스 배출에서는 유의적인 차이를 보이 지 않았다(Fig. 2). 무제치늪의 경우 총 이온함량과 총 질 소함량에서 유의적인 차이를 보였지만, 토양에서 배출되 는 N2O 가스량에는 큰 영향을 미치지 않는 것으로 조사 되었다(Fig. 4). N2O의 방출이 겨울과 봄보다는 여름에 더 높다는 연구 결과(Cantarel et al., 2011)를 토대로 본 연구도 여름철인 7월과 9월에 실험을 진행하였다. 질뫼 늪에서7월에 채취한 토양과 9월에 채취한 토양의 N2O 배출량은 온도가 증가함에 따라 증가하는 양상을 보였다 (Fig. 3A). 10�C에서는 처리시간에 따른 차이가 거의 없 었으나, 15�C 이상에서는 처리시간에 따라 누적 배출량은 다소 증가하는 양상을 보였다. 9월에 채취한 토양 또한7 월의 아산화질소 배출량과 거의 유사한 값을 보였다. 무 제치늪의 경우, 7월과 9월에 채취한 토양의 N2O 배출량 은 10�C에서는 질뫼늪과 마찬가지로 유의적인 차이를 보이지 않았지만, 15�C와20�C의 토양에서는 질뫼늪과는 달리15�C보다는20�C 토양에서 더 많은 양의N2O를 배 출하였다(P⁄0.05). 이는 최대 질화율이20�C, 100% 포장 Fig. 5. N2O emissions according to the temperature change and nitrogen sources of Mujaechineup soil collected in
September (A: NO3--N, B: NH4++-N).
0.3 0.2 0.1 0
(B)
10�C 15�C 20�C
4 8 12 16 20 24 28 32 36
4 8 12 16 20 24 28 32 36 Hour
4 8 12 16 20 24 28 32 36 Hour
4 8 12 16 20 24 28 32 36 Hour
4 8 12 16 20 24 28 32 36 4 8 12 16 20 24 28 32 36
0.7 0.6 0.5 0.4 0.3 0.2 0.1 0 N2O flux(mg∙N2O flux(mg∙m-2∙hr-1)
월에 채취한 토양에서 배출하는N2O의 배출량에서의 유 의적인 차이는 나타나지 않았다. 함수량과 온도에 따른 질화율의 변화를 조사한 연구에서 5�C와 10�C에서 질화 율이 거의 차이가 없는 것을 보여주고 있듯이(Maag and Vinther, 1996), 본 조사의10�C 토양에서N2O 배출량 또 한 시간에 따른 양의 변화를 거의 보이지 않았다.
위의 결과에서처럼10�C 이하의 온도에서는 N2O가 거 의 배출하지 않았으며, 15�C 이상의 온도에서 다소 많은 양의 N2O가 배출하는 것으로 보아 토양의 N2O 배출은 관련 토양세균의 활성이 15�C 이상의 온도를 요구하는 것으로 생각된다. 또한 15�C와 20�C에서 N2O 배출량의 유의적인 차이가 없었지만, 온도에 따른 배출량의 차이는 N2O 배출이 토양의 온도, pH 등과 같은 복합적인 상호작 용의 결과로 여겨지며(Parton et al., 2001), 토양의 산도 와 유기물 함량의 차이가 다소N2O 가스 배출에 영향을 주었을 것으로 생각된다.
토양에서 질소시비량의 증가에 따라 토양으로부터 N2O 배출량이 증가하며, 특히 NH4
+
+-N의 증가가 많은 양 의 N2O 가스를 배출하고(Xu et al., 2004), 또한 NO3--N 의 상승도 N2O 배출을 증가시키는 것으로 알려져 있다 (Hellebrand et al., 2008). 동일한 환경조건하에서 질소원 에 따른 아산화질소의 배출량은 질소원(NO3--N, NH4++- N)을 투입하지 않는7월과9월의 배출 결과와 거의 유사 한 양상을 보였다(Fig. 3). 이것은 아마도 단기간의 질소 원 처리가 토양세균의 탈질작용에 큰 영향을 미치지 못 하였을 것으로 여겨진다. 무제치늪 토양 또한 온도에 따 른 N2O의 배출량은 질소원 종류 및 첨가여부에 관계없 이 유의적인 차이가 나타나지 않았다. 유럽의 이탄습지에 서는 토양 내 NO3-의 농도가 높은 장소에서N2O 가스가 가장 많이 발생하였다는 보고가 있지만(Carter et al., 2012), 본 연구에서는 짧은 처리시간으로 인해 질소원 간 에 뚜렷한 차이를 보이지 않았다. 일반적으로 토양 내 이 산화탄소의 증가는 미생물의 호흡 증가를 통해 N2O를 많이 배출하는 것으로 알려져 있으나(Kettunen et al., 1996), 본 실험에서는 시간에 따른 토양 챔버 내 이산화 탄소의 저하가 미생물의 호흡의 저하시켜 부가적인 질소 원의 공급에도 불구하고 N2O 배출 양상에서 차이를 보 이지 않았을 것으로 생각된다.
결론적으로, 이탄토양으로부터 배출하는 N2O의 양은 온도가 상승함에 따라 증가되는 양상을 보였으나 질소원 의 종류와 부가량은 N2O 배출 양상에 큰 차이를 보이지 않은 것으로 조사되었다. 2011년 8월 현지 조사 시 이탄
온도가 상승된다면 더 많은 양의N2O 가스가 발생될 것 으로 예측되며, 이탄습지대의 N2O 가스 발생은 한반도 기온 상승에도 영향을 미칠 수 있을 것으로 여겨진다. 향 후 이탄습지 토양의 N2O 배출양상을 보다 명확히 규명 하기 위해서는 질소원의 차이, 질소의 시비, 토양효소 활 성이나 질화세균의 활동성을 포함하여 다양한 요인에 대 한 복합적인 연구가 진행될 필요가 있을 것이다. 부가하 여, 이탄토양으로부터 온실가스를 배출시키는 원인을 명 확히 밝히는 연구를 진행시킴과 동시에 온실가스를 저감 할 수 있는 다양한 기술 개발을 위한 후속 연구 또한 이 루어질 필요가 있다.
적 요
최근 기후변화에 따른 지구온난화는 전세계적으로 매 우 큰 문제로 인식되고 있다. 이산화탄소의 농도, 온난화 정도, 토양 온도, 강우량, 토양수분함량, 탈질작용 등과 같 은 요인들은 토양으로부터 아산화질소(N2O)의 방출에 영향을 미치는 것으로 알려져 있다. 본 연구에서는 산지 습지인 오대산 질뫼늪과 정족산 무체치늪 토양으로부터 온도변화에 따른N2O 발생을 조사하였다. 7월 채취한 질 뫼늪 토양은 온도가 증가함에 따라 N2O 발생이 증가하 였으나 10�C에서는 유의한 차이를 보이지 않았다. 15�C 와20�C 토양은24시간까지는 증가하는 N2O 발생양상을 보였으나 그 이후 발생량의 뚜렷한 차이를 보이지 않았 다, 전반적으로 온도처리에 따른 유의한 차이만을 보였 다. 무제치늪 토양 또한 질뫼늪 토양과 유사한 경향을 보 였다. 부가적인 질소원 처리에 대해 두 습지 토양은 다소 증가하는 양상을 보였으나 질소부가나 질소원에 따른 유 의한 차이를 보이지 않았다. 결론적으로 이탄토양으로부 터 배출하는 N2O의 양은 온도가 상승함에 따라 증가되 는 양상을 보였으나 질소원의 종류와 부가량은 N2O 배 출 양상에 큰 차이를 보이지 않은 것으로 조사되었다. 향 후 산지 이탄습지 토양의 N2O 배출양상을 보다 명확히 규명하기 위해서는 질소원의 차이, 질소의 시비, 토양효 소 활성이나 질화세균의 활동성을 포함하여 다양한 요인 에 대한 복합적인 연구가 진행될 필요가 있을 것이다.
사 사
본 연구는 한국연구재단 일반연구자 지원 사업(2010-
사의 인사를 드립니다.
인 용 문 헌
Basiliko, N. and J.B. Yavitt. 2001. Influence of Ni, Co, Fe and Na additions on methane production in Sphagnum dominated Northern American peatlands. Biogeochemi- stry 52: 133-153.
Bellisario, L.M., J.L. Bubier, T.R. Moore and J.P. Chanton.
1999. Controls on CH4emissions from a northern peat- land. Global Biogeochemical Cycles 13: 81-91.
Bubier, J.L. 1995. The relationship of vegetation to methane emission and hydrochemical gradients in northern peat- lands. Journal of Ecology 83: 403-420.
Cantarel, A.M., M.G. Bloor, N. Deltroy and J.F. Soussana.
2011. Effects of climate change drivers on nitrous oxide fluxes in an upland temperate grassland. Ecosystems.
14: 223-233.
Carter, M.S., K.S. Larsen, B. Emmett, M. Estiarte, C. Field, I.D. Leith, M. Lund, A. Meijide, R.T.E. Mills, Ü. Niine- mets, J. Penuelas, M. Portillo-Estrada, I.K. Schmidt,~ M.B. Selsted, L.J. Sheppard, A. Sowerby, A. Tietema and C. Beier. 2012. Synthesizing greenhouse gas fluxes across nine European peatlands and shrublands - respo- nses to climatic and environmental changes. Biogeosci- ences 9: 3739-3755.
Carter, M.S., P. Ambus, K.R. Albert, K.S. Larsen, M. Anders- son, A. Prieme, L. Linden and C. Beier. 2011. Effects of elevated atmospheric CO2, prolonged summer drought and temperature increase on N2O and CH4fluxes in a temperate heathland. Soil Biology & Biochemistry 43:
1660-1670.
Coles, J.R.P. and J.B. Yavitt. 2002. Control of methane me- tabolism in a forested northern wetland, New York State, by aeration, substrates, and peat size fractions. Geomi- crobiology Journal 19: 293-315.
Crill, P.M., K.B. Bartlett, R.C. Harriss, E. Gorham, E.S.
Verry, D.I. Sebacher, L. Mazdar and W. Sanner. 1988.
Methane flux from Minnesota peatlands. Global Bioge- ochemical Cycles 2: 371-384.
Dedysh, S.N. 2002. Methanotrophic bacteria of acidic Spha- gnum peat bogs. Microbiology 71: 638-650.
Dise, N.B. 1993. Methane emission from Minnesota peat- lands: Spatial and seasonal variability. Global Biogeo-
Soil Biology and Biochemistry 25: 321-326.
Fechner-Levy, E.J. and H.F. Hemond. 1996. Trapped me- thane volume and potential effects on methane ebulli- tion in a northern peatland. Limnology and Oceanogrphy 41: 1375-1383.
Frency, J.R. 1997. Emission of nitrous from soils used for agriculture. Nutrient Cycling in Agreecosystems 49: 1-6.
Garcia, J.L., B.K.C. Patel and B. Ollivier. 2000. Taxonomic, phylogenetic and ecological diversity of methanogenic Archaea. Anaerobe 6: 205-226.
Groβe, W. 1996. The mechanism of thermal transpiration (=thermal osmosis). Aquatic Botany 54: 101-110.
Hanson, R.S. and T.E. Hanson. 1996. Methanotrophic bac- teria. Microbiological Reviews 60: 439-471.
Hellebrand, H.J., V. Scholz and J. Kern. 2008. Fertilizer induced nitrous oxide emissions during energy crop cul- tivation on loamy sand soils. Atmospheric Environment 42: 8403-8411.
Hyvoenen, N.P., J.T. Huttunen, N.J. Shurpali, N.M. Tavi, M.E. Repo and P.J. Martikainen. 2009. Fluxes of nitrous oxide and methane on an abandoned peat extraction site: Effect of reed canary grass cultivation. Bioresource Technology 100: 4723-4730.
Ineson, P., P.A. Coward and U.A. Hartwig. 1998. Soil gas fluxes of N2O, CH4 and CO2 beneath Lolium perenne under elevated CO2: The Swiss free air carbon dioxide enrichment experiment. Plant and Soil 198: 89-95.
IPCC. 2007. Climate change 2007: synthesis report. contri- bution of working groups I. II and III to the fourth asse- ssment. p. 104. In: Core Wrighting Team (Pachauri, R.K.
and A. Reisinger, eds.). Report of the Intergovernmental Panel on Climate Change. IPCC, Geneva, Switzerland.
Joabsson, A., T.R. Christensen and B. Wallen. 1999. Vas- cular plant controls on methane emissions from northern peatforming wetlands. Trends in Ecology and Evoltion 14: 385-388.
Kamal, S. and A. Varma. 2008. Peatland microbiology. pp.
177-203. In: Microbiology of Extreme Soils. Soil Biology 13. (Dion, P. and C.S. Nautiyal, eds.). Springer-Verlag, Berlin Heidelberg.
Kanerva, T., K. Regina, K. Ramo, K. Ojanpera and S. Man- ninen. 2007. Fluxes of N2O, CH4and CO2in a meadow ecosystem exposed to elevated ozone and carbon dioxide for three years. Environmental Pollution 145: 818-828.
Kang, H., C. Freeman and T.W. Ashendon. 2001. Effects of
Kettunen, A., V. Kaitala, J. Alm, J. Silvola, H. Nykänenand and P.J. Martikainen. 1996. Cross-correlation analysis of the dynamics of methane emissions from a boreal peatland. Global Biogeochemical Cycles 10: 457-471.
Kim, J.G. 2009. Ecological Characteristics of Sphagnum fens in Mt. Odae: I. Sowhangbyungsan-neup. Journal of Wetlands Research 11: 15-27
Maag, M. and F.P. Vinther. 1996. Nitrous oxide emission by nitrification and denitrification in different soil types and at different soil moisture contents and temperatures.
Applied Soil Ecology 4: 5-14.
Moore, T.R., A. Heyes and N.T. Roulet. 1994. Methane emis- sions from wetlands, southern Hudson Bay lowland.
Journal of Geophysical Research 99: 1455-1467.
Morrissey, L.A. and G.P. Livingston. 1992. Methane emis- sions from Alaska Arctic tundra: An assessment of local spatial variability. Journal of Geophysical Research 97D:
16661-16670.
Pannikov, N.S. and S.N. Dedysh. 2000. Cold season CH4 and CO2emission from boreal peat bogs (West Siberia):
Winter fluxes and thaw activation dynamics. Global Biogeochemical Cycles 14: 1071-1080.
Parton, W.J., A.R. Mosier, D.S. Ojima, D.W. Valentine, D.S.
Schimel, K. Weier and A.E. Kulmala. 1996. Generalized model for N2and N2O production from nitrification and denitrification. Global Biochemical Cycles 10: 401-412.
Parton, W.J., E.A. Holland, S.J. Del Grosso, M.D. Hartman, R.E. Martin, A.R. Mosier, D.S. Ojima and D.S. Schimel.
2001. Generalized model for NOxand N2O emissions from soils. Journal of Geophysical Research 106: 17,403- 17,419.
Pelletier, L., T.R. Moore, N.T. Roulet, M. Garneau and V.
Beaulieu-Audy. 2007. Methane fluxes from three peat- lands in the La Grande Rivi `ere watershed, James Bay lowland, Canada. Journal of Geophysical Research 112:
G01018.
Scheutz, C. and P. Kjeldsen. 2004. Environmental factors influencing attenuation of menthane and hydrochloro- fluorocarbons in landfill cover soils. Journal of Environ-
sumption: A review of processes underlying wetland methane fluxes. Biogeochemistry 41: 23-51.
Smith, K.A., H. Clayton, I.P. McTaggart, P.E. Thomson, J.R.M. Arah, A. Scott, K.W.T. Goulding, J.L. Monteith, and V.R. Phillips. 2012. The Measurement of Nitrous Oxide Emissions from Soil by Using Chamber. The Ro- yal Society 351: 327-338.
Treat, C.C., J.L. Bubier, R.K. Varner and P.M. Crill. 2007.
Time scale dependence of environmental and plantme- diated controls on CH4flux in a temperate fen. Journal of Geophysical Research 112: G01014.
Tsuyuzaki, S. 1997. Wetland development in the early stages of volcanic succession. Journal of Vegetation Science 8:
353-360.
Valentine, D.W., E.A. Holland and D.S. Schimel. 1994. Eco- system and physiological controls over methane produc- tion in northern wetlands. Journal of Geophysical Rese- arch 99: 1563-1571.
Waddington, J.M., N.T. Roulet and R.V. Swanson. 1996.
Water table control of CH4 emission enhancement by vascular plants in boreal peatlands. Journal of Geophy- sical Research 101: 22775-22785.
Wrage, N., G.L. Velthof, M.L. Beusichem van and O. Oenema.
2001. Role of nitrifier Time scale dependence of environ- mental and plantmediated controls on CH4flux in a tem- perate fen denitrification in the production of nitrous oxide. Soil Biology & Biochemistry 33: 1723-1732.
Wu, X., Z. Yao, N. Bruggemann, Z.Y. Shen, B. Wolf, M.
Dannenmann, X. Zheng and K. Butterbach-Bahl. 2010.
Effects of soil moisture and temperature on CO2 and CH4soil-atmosphere exchange of various land use/cover types in a semi-arid grassland in Inner Mongolia, China.
Soil Biology & Biochemistry 42: 773-787.
Xu, Z., H. Ouyang, C. Cao, Z. Pei and C. Zhou. 2004. Nitro- gen deposition and carbon sequestration in alpine mea- dows. Biogeochemistry 71: 353-369.
(Manuscript received 31 July 2013, Revised 5 September 2013
Revision accepted 10 September 2013)