Ⅰ. 서 론
최근 고령화 시대의 진입으로 만성질환인 골다공증의 환 자 수는 꾸준히 증가추세이다. 건강보험심사평가원 보건의 료 빅데이터 개방시스템에 따르면 골다공증 연도별 환자 수 추이는 2015년 821,754명에서 2019년 1,079,548명으로 연 평균 7.06% 증가하였으며, 연도별 요양급여비용 총액 추이 는 2015년 92,892,132천 원에서 2019년 165,662,889천 원 으로 연평균 15.56% 증가하였다. 골다공증은 폐경 여성에 서 흔히 발생하는 질환으로 골 양의 감소 및 미세구조 변화 로 인하여 골의 강도가 감소되어 골절이 일어날 가능성이 높은 상태를 의미한다[1]. 골다공증은 골절이 일어나기 전까
지 무증상인 경우가 많으며 골다공증 환자의 경우 작은 손 상에도 골절이 발생할 가능성이 높기 때문에 증상이 없더라 도 조기 진단 및 치료를 수행해야 병변으로 인한 사회적, 경 제적 부담을 줄일 수 있다[2]. 따라서 골다공증 예측 및 예 방을 위한 연구는 꾸준히 진행되어왔다[3,4].
최근 인공지능 기술은 당뇨병 예측, 피부 유형 판단 등 의료분야에서 다양하게 적용되고 있다[5,6]. 인공지능 기 술의 한 분야인 머신러닝(Machine learning)은 데이터를 기반으로 패턴을 학습하고 결과를 예측하는 기법을 통칭 하며, 일반적으로 지도학습(Supervised learning), 비지도 학습(Un-supervised learning), 강화학습(Reinforcement learning)으로 나눌 수 있다[7]. 이 중 지도학습은 훈련 데
<원저>
폐경 여성에서 트리기반 머신러닝 모델로부터 골다공증 예측
이인자・이준호 동남보건대학교 방사선과
Predictive of Osteoporosis by Tree-based Machine Learning Model in Post-menopause Woman
Lee In-Ja・Lee Junho
Department of Radiological Technology, Dongnam Health university
Abstract In this study, the prevalence of osteoporosis was predicted based on 10 independent variables such as age, weight, and alcohol consumption and 4 tree-based machine-learning models, and the performance of each model was compared. Also the model with the highest performance was used to check the performance by clearing the independent variable, and Area Under Curve(ACU) was utilized to evaluate the performance of the model. The ACU for each model was Decision tree 0.663, Random forest 0.704, GBM 0.702, and XGBoost 0.710 and the importance of the variable was shown in the order of age, weight, and family history. As a result of using XGBoost, the highest performance model and clearing independent variables, the ACU shows the best performance of 0.750 with 7 independent variables. This data suggests that this method be applied to predict osteoporosis, but also other various diseases. In addition, it is expected to be used as basic data for big data research in the health care field.
Key Words : Osteoporosis, Bone mineral density, Machine learning, XGBoost, Prediction model 중심 단어 : 골다공증, 골밀도, 머신러닝, XGBoost, 예측모델
This work was supported by the research grant of the Dongnam Health University.
Corresponding author: Junho Lee, Department of Radiological Technology, Dongnam Health University, 50, Cheoncheon-ro 74beon-gil, Jangan-gu, Suwon-si, Gyeonggi-do, 16328, Republic of Korea/ Tel: +82-31-249-6650 / E-mail: [email protected]
Received 27 November 2020; Revised 22 December 2020; Accepted 24 December 2020
이터에 정답을 포함 시켜 학습시키는 방법으로 분류와 회귀 에 사용된다. 트리기반 모델은 다양한 지도학습에 사용되고 있으며, 대표적인 트리기반 알고리즘은 결정 트리(Decision tree), 랜덤 포레스트(Random forest) 등이 있고 최근 높은 정확도로 인하여 각광받고 있는 XGBoost(Extra gradient boost) 알고리즘도 트리기반 모델이다[8,9].
본 연구에서는 폐경여성에서 트리기반 머신러닝 모델로 부터 골다공증 예측에 대해 알아보고자 하였다.
Ⅱ. 대상 및 방법
1. 데이터 수집
국민건강영양조사(The Korea national health and nutrition examination survey, KNHANES)는 국민건강증진법 제16 조에 근거하여 국민의 건강 및 영양상태를 파악하기 위해 실시되고 있으며, 1998년 제1기를 시작으로 2018년 제7기 원시자료까지 공개되어 있다. 본 연구에서는 골다공증 검사 가 실시된 제5기(2010∼2011) 원시자료를 사용하였으며 골 다공증검사를 진행한 폐경 여성 2,135명의 데이터를 수집하 였으며, 이중 결측치를 제외한 1,995명을 연구대상으로 선 정하였다.
2. 데이터 선정 및 연구대상
본 연구는 트리기반 머신러닝 모델을 이용하여 생활습관 및 현재 신체 지표를 이용하여 골다공증 유병여부 유무를
예측하였다. 따라서 선행연구 및 도메인 지식을 이용하여 골다공증과 연관성이 높은 변수를 파악하였다[10-14].
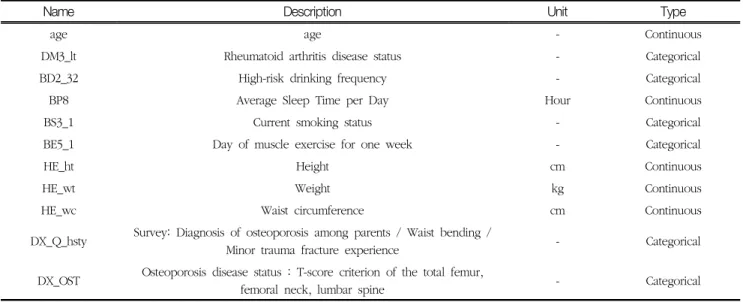
Table 1과 같이 간단히 파악할 수 있는 나이, 류마티스성 관 절염 유병여부, 성인 여성 고위험 음주빈도, 하루 평균 수면 시간, 현재 흡연 여부, 1주일간 근력운동 일수, 신장, 체중, 허리둘레, 부모 중 골다공증진단 / 허리 휨 / 경미한 외상 골절 경험여부(가족력 등) 등 10개의 독립변수를 선정하였 고 T-score 기준으로 산출된 골다공증 유병여부를 종속변 수로 선정하였으며 골다공증 유병여부에 따라 비골다공증 군(Non-osoteoporosis group)과 골다공증군(Osoteoporosis group)으로 분류하였다.
3. 데이터 전처리 및 통계적 분석
수집된 데이터는 머신러닝 모델에 적용하기 위해 분석에 적합한 형태로 변형해야 한다. 이를 데이터 전처리라 하며 모델의 성능을 높이기 위하여 초기 데이터는 가공하는 과정 을 거쳐야 한다[15]. 수집된 데이터에서 결측치가 속한 행 및 각 변수 내용에서 모름으로 응답한 것과 수면시간에서 0, 1, 20시간 등 비정상적이라 생각되는 행은 삭제하였다. 나 이, 신장, 체중 등 연속형 변수는 StandardScaler를 사용하 여 데이터를 처리하였다. 데이터의 유의성 검정을 위하여 통계적 분석을 실시하였다. 연속형 변수는 독립표본 t검정 을 이용하여 평균과 표준편차를 구하였고, 범주형 변수는 카이제곱검정을 이용하여 빈도(%)를 구하였다. p-value는 0.05 미만인 경우에 통계적으로 유의하다고 판단하였다. 통 계 분석은 SPSS 23.0 software (SPSS Inc., Chicago, IL, USA)를 이용하였다. 데이터 분류는 데이터를 훈련데이터와
Table 1. Variable description
Name Description Unit Type
age age - Continuous
DM3_lt Rheumatoid arthritis disease status - Categorical
BD2_32 High-risk drinking frequency - Categorical
BP8 Average Sleep Time per Day Hour Continuous
BS3_1 Current smoking status - Categorical
BE5_1 Day of muscle exercise for one week - Categorical
HE_ht Height cm Continuous
HE_wt Weight kg Continuous
HE_wc Waist circumference cm Continuous
DX_Q_hsty Survey: Diagnosis of osteoporosis among parents / Waist bending /
Minor trauma fracture experience - Categorical
DX_OST Osteoporosis disease status : T-score criterion of the total femur,
femoral neck, lumbar spine - Categorical
테스트데이터로 랜덤하게 분리하여 교차 검증을 실시하는 홀드아웃(Hold-out method) 방법을 사용하였다.
4. 분류 알고리즘 및 평가
골다공증 유병여부를 예측하기 위하여 트리기반 머신러 닝 분류 알고리즘인 결정 트리(Decision tree), 랜덤 포레스트 (Randon forest), GBM(Gradient boost machine), XGBoost (Extra gradient boost) 모델을 사용하였다. 머신러닝 분류 알고리즘의 평가는 Table 2와 같이 혼동행렬(Confusion matrix)을 기반으로 구성되며, 예측 클래스와 실제 클래스를 기준으로 Negative, Positive로 분류하여 True positive(TP), False positive(FP), False negative(FN), True negative(TN) 형태로 구성된다. 이를 이용하여 ROC(Receiver operation characteristic) 곡선과 AUC(Area under curve), 정확도 (Accuracy), 정밀도(Precision), 재현율(Recall), F1 스코 어(F1_score)를 산출하여 모델을 평가할 수 있다. 본 연구에 서는 이진 분류모델의 성능 평가와 비교를 위하여 의학 진
단, 생물학, 신용평가 등의 분야에서 예측 및 분류 모델의 성능평가 지표로 주로 사용되는 AUC를 이용하여 모델의 성 능을 평가하였다[16,17]. AUC는 ROC 곡선의 아래 면적을 의미하고 1에 가까울수록 좋은 모형이라고 판단한다. 평가 결과 가장 높은 성능의 알고리즘에서 독립변수를 줄여가며 예측결과를 파악하여 모델의 최적화를 수행하였다. 분석도 구는 Python(v3.7.3), Jupyter notebook을 사용하였다.
Ⅲ. 결 과
1. 데이터 유의성 평가
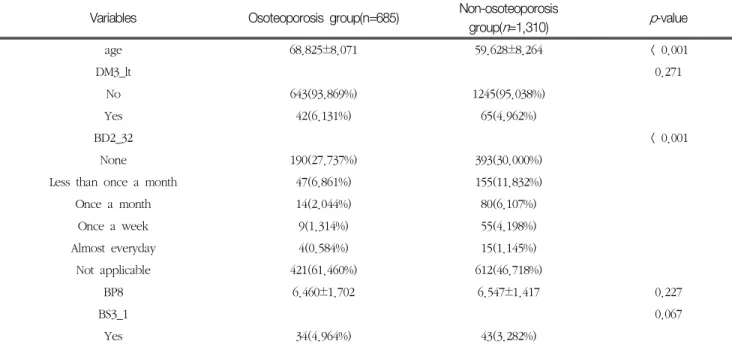
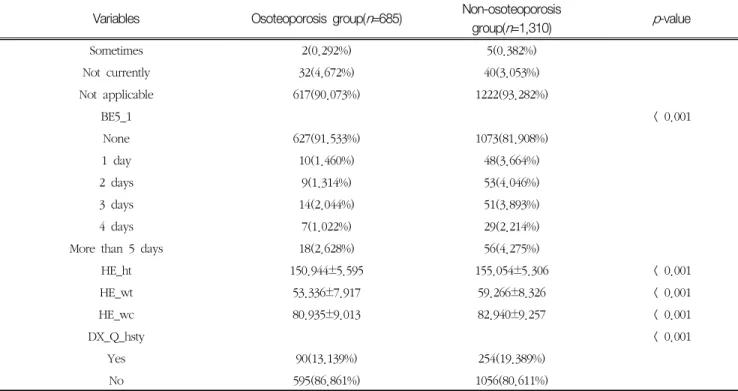
데이터 유의성 평가 결과 Table 3과 같이 나이, 고위험 음주빈도, 1주일간 근력운동 일수, 신장, 체중, 허리둘레, 가족력 등은 통계적으로 유의하게 나타났으며(p<0.05), 류 마티스성 관절염 유병여부, 하루 평균 수면시간, 현재 흡연 여부는 유의하게 차이가 나타나지는 않았다(p>0.05).
Table 2. Confusion matrix of classification model
Predicted class Positive
(Osteoporosis)
Negative (Non-osteoporosis)
Actual class
Positive
(Osteoporosis) True positive(TP)
(Osteoporosis prediction success) False negative(FN) (Osteoporosis prediction failure) Negative
(Non-osteoporosis) False positive(FP)
(Non-Osteoporosis prediction failure) True negative(TN) (Non-osteoporosis prediction success)
Table 3. Baseline characteristics of study population
Variables Osoteoporosis group(n=685) Non-osoteoporosis
group(n=1,310) p-value
age 68.825±8.071 59.628±8.264 < 0.001
DM3_lt 0.271
No 643(93.869%) 1245(95.038%)
Yes 42(6.131%) 65(4.962%)
BD2_32 < 0.001
None 190(27.737%) 393(30.000%)
Less than once a month 47(6.861%) 155(11.832%)
Once a month 14(2.044%) 80(6.107%)
Once a week 9(1.314%) 55(4.198%)
Almost everyday 4(0.584%) 15(1.145%)
Not applicable 421(61.460%) 612(46.718%)
BP8 6.460±1.702 6.547±1.417 0.227
BS3_1 0.067
Yes 34(4.964%) 43(3.282%)
2. 데이터셋 분류
폐경 여성의 골다공증 유병여부를 예측하기 위하여 1,995 명의 원천 데이터를 사용하였다. 이중 비골다공증 그룹은 1,310명이며, 골다공증 그룹은 685명이다. 머신러닝 분류 모델에 사용하기 위하여 원천 데이터를 홀드아웃 방법을 이 용하여 훈련데이터셋과 테스트데이터셋으로 랜덤하게 나누 었으며 7:3의 비율로 나누어 각각 1,396명, 599명의 데이터 를 사용하였다.
3. 예측모델 평가
골다공증 유병여부를 예측하기 위하여 훈련 데이터를 활 용하여 Decision tree, Random forest, GBM, XGBoost 분
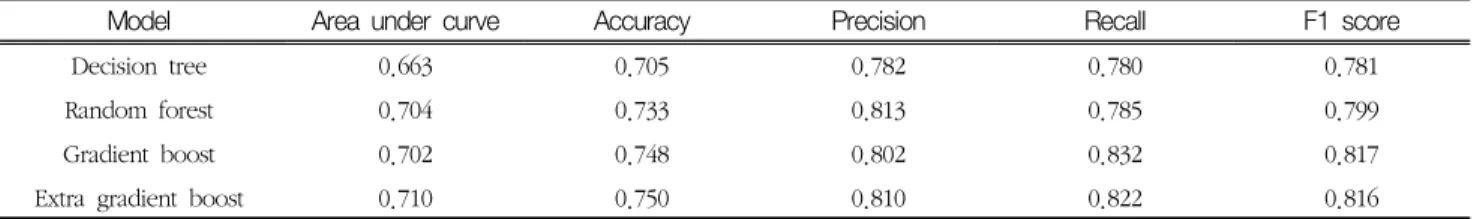
류모델을 구축하였다. 생성한 모델에 테스트데이터를 적용 한 결과는 Table 4와 같이 혼동행렬로 나타난다. 예측력 평 가 결과 각 모델의 AUC는 Fig. 1과 같이 Decision tree 0.663, Random forest 0.704, GBM 0.702, XGBoost 0.710으로 나타났다. Table 5는 생성된 모델들에 대한 이진 분류 성능평가를 나타낸다.
4. 변수 중요도 평가 및 최적화
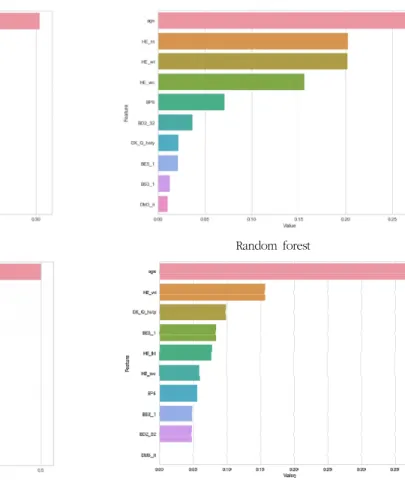
각 모델의 10개 독립변수가 골다공증 예측에 영향을 미친 정도는 Fig. 2와 같다. 결정 트리의 경우 나이 0.304, 체중 0.231, 신장 0.170, 허리둘레 0.136, 하루 평균 수면시간 0.068, 고위험 음주빈도 0.035, 1주일간 근력운동 일수 0.022, 가족력 등 0.020, 류마티스성 관절염 유병여부 Table 3. Baseline characteristics of study population (Cont.)
Variables Osoteoporosis group(n=685) Non-osoteoporosis
group(n=1,310) p-value
Sometimes 2(0.292%) 5(0.382%)
Not currently 32(4.672%) 40(3.053%)
Not applicable 617(90.073%) 1222(93.282%)
BE5_1 < 0.001
None 627(91.533%) 1073(81.908%)
1 day 10(1.460%) 48(3.664%)
2 days 9(1.314%) 53(4.046%)
3 days 14(2.044%) 51(3.893%)
4 days 7(1.022%) 29(2.214%)
More than 5 days 18(2.628%) 56(4.275%)
HE_ht 150.944±5.595 155.054±5.306 < 0.001
HE_wt 53.336±7.917 59.266±8.326 < 0.001
HE_wc 80.935±9.013 82.940±9.257 < 0.001
DX_Q_hsty < 0.001
Yes 90(13.139%) 254(19.389%)
No 595(86.861%) 1056(80.611%)
* age: age, DM3_lt: Rheumatoid arthritis disease status, BD2_32: High-risk drinking frequency, BP8: Average Sleep Time per Day, BS3_1:
Current smoking status, BE5_1: Day of muscle exercise for one week, HE_ht: Height, HE_wt: Weight, HE_wc: Waist circumference, DX_Q_hsty: Survey: Diagnosis of osteoporosis among parents / Waist bending / Minor trauma fracture experience
* Values are presented as number (%) or mean±standard deviation.
Table 4. Confusion matrix of test data-set Predicted
True Decision tree Random forest Gradient boost Extra gradient boost
Osteoporosis Non-osteopo
rosis Osteoporosis Non-osteopo
rosis Osteoporosis Non-osteopo
rosis Osteoporosis Non-osteopo rosis
Osteoporosis 106 88 121 73 111 83 116 78
Non-osteoporosis 89 316 87 318 68 337 72 333
0.007, 현재 흡연 여부 0.007이었으며 랜덤 포레스트는 나 이 0.268, 신장 0.203, 체중 0.202, 허리둘레 0.156, 하루 평균 수면시간 0.071, 고위험 음주빈도 0.036, 가족력 등 0.021, 1주일간 근력운동 일수 0.021, 현재 흡연 여부 0.012, 류마티스성 관절염 유병여부 0.010으로 나타났다.
GBM은 나이 0.500, 체중 0.265, 신장 0.110, 허리둘레 0.061, 가족력 등 0.018, 1주일간 근력운동 일수 0.017, 하 루 평균 수면시간 0.013, 현재 흡연 여부 0.008, 고위험 음 주빈도 0.007, 류마티스성 관절염 유병여부 0.002로 나타 났으며 XGBoost는 나이 0.370, 체중 0.156, 가족력 등
0.098, 1주일간 근력운동 일수 0.084, 신장 0.078, 허리둘 레 0.060, 하루 평균 수면시간 0.056, 현재 흡연 여부 0.049, 고위험 음주빈도 0.048, 류마티스성 관절염 유병여 부 0.000으로 나타났다.
모델의 성능이 가장 좋게 평가된 XGBoost 모델에서 10개 독립변수를 하나씩 축소하여 평가한 결과 Fig. 3과 같이 7 개의 독립변수를 사용하였을 때 AUC가 가장 높았으며 이때 AUC는 0.750, 사용 변수는 나이, 체중, 가족력 등, 1주일간 근력운동 일수, 신장, 허리둘레, 하루 평균 수면시간이다.
Table 5. Result of prediction model evaluation
Model Area under curve Accuracy Precision Recall F1 score
Decision tree 0.663 0.705 0.782 0.780 0.781
Random forest 0.704 0.733 0.813 0.785 0.799
Gradient boost 0.702 0.748 0.802 0.832 0.817
Extra gradient boost 0.710 0.750 0.810 0.822 0.816
Decision tree(Area under curve = 0.663) Random forest(Area under curve = 0.704)
Gradient boost(Area under curve = 0.702) Extra gradient boost(Area under curve = 0.710) Fig. 1. Receiver operation characteristic curve by classification model
Ⅳ. 고 찰
골다공증은 골 형성의 감소 및 골 파괴의 증가로 인하여 골량과 밀도가 낮아져 일상적인 충격에도 골절 위험이 높아 지는 질환이다[18,19]. 또한, 수년간 자각 증상 없이 진행되
므로 건강검진 중에 발견되는 경우가 많아 조기 검진으로 인한 예방이 필요하며 이를 위해 국민 건강 보험공단 일반 검진을 통하여 만 54세 여성과 만 66세 여성에 한하여 골밀 도 검사를 진행하고 있다[20]. 골다공증은 나이의 증가 및 생활습관 영향에 의해 골 소실 속도가 다르고 증상이 없기
Decision tree Random forest
Gradient boost Extra gradient boost
Fig. 2. Result of feature importance evaluation
Fig. 3. Area under curve according to feature reflection
때문에 더욱 주의 깊게 관찰할 필요가 있다. 특히 여성의 경 우 골밀도의 감소는 폐경을 전후로 가장 중요한 시점을 맞 이하게 되며 폐경 이후 에스트로겐 결핍에 의한 골 흡수의 증가와 장에서 칼슘의 흡수가 감소되어 골밀도 감소가 진행 된다[21]. 따라서 폐경 이후 골밀도 감소의 예측 및 골다공 증 예방에 관한 연구가 꾸준히 진행되어 왔다[22,23].
머신러닝 기술은 다양한 분야의 분류 및 예측에 활용되고 있으며, 질병 예측으로 범위를 넓혀가고 있다[24-26]. 본 연구는 트리기반 머신러닝 모델 4종의 골다공증 예측 성능 을 비교하였다. 트리기반 모델의 기본이 되는 결정 트리는 결과에 이르기 위해 예, 아니오를 반복하며 학습을 이어간 다. 랜덤 포레스트는 다수의 결정 트리를 이용하여 예측을 진행하며, GBM과 XGBoost는 이전 트리의 오차를 보완하 는 방식으로 학습하여 예측에 활용되며 XGB는 랜덤 포레스 트와 GBM보다 학습 속도가 빠르며 과적합이 잘 일어나지 않고 다른 알고리즘과 연계 활용성이 좋은 장점이 있다[27].
트리기반 모델 학습 결과 4개 모델 전부 나이가 골다공증 유병여부를 예측하는데 영향력이 가장 큰 변수였으며, 모델 별 AUC는 Decision tree 0.663, Random forest 0.704, GBM 0.702, XGBoost 0.710로 Decision tree를 제외하고 나머지는 비슷하였다. 가장 좋은 성능을 나타낸 XGBoost를 이용하여 변수를 순서대로 5개까지 줄여 학습시킨 결과 7개 의 변수를 사용했을 때 AUC는 0.750으로 가장 좋은 성능을 나타냈다. 머신러닝을 이용한 질병 예측을 다양한 질병에 적용한다면 질병의 사전 예측 및 예방에 기여할 수 있을 것 으로 생각된다. 본 연구에서는 10개의 독립변수를 사용하여 예측하였다. 머신러닝은 빅데이터를 활용하여 유용한 정보 의 추출 및 예측이 가능한 만큼 더 많은 변수들을 사용한다 면 모델 성능 향상 및 일정 수준의 예측 성능을 유지할 수 있는 최소 변수를 찾는데 유용하게 사용될 수 있을 것이다.
또한, 본 연구에서는 기본 모델을 사용하여 모델간의 성능 을 비교하였으나 머신러닝 모델은 사용자가 직접 세팅 가능 한 하이퍼 파라미터(Hyper parameter) 조절을 통하여 성 능을 향상시킬 수 있다. 하이퍼 파라미터는 정해진 값이 없 기 때문에 데이터의 종류와 회귀, 분류 등 예측결과의 종류 에 따라 적절히 조정해야 하며, 경험법칙(Rule of thumb) 또는 GridSearchCV 등을 이용하면 모델의 성능을 향상시 킬 수 있을 것으로 생각된다.
Ⅴ. 결 론
본 연구에서는 트리기반의 머신러닝 분류 알고리즘인 결정
트리(Decision tree), 랜덤 포레스트(Randon forest), GBM (Gradient boost machine), XGBoost(Extra gradient boost) 모델을 사용하여 폐경 이후 여성의 골다공증 유병여부를 예 측하였다. 신장, 체중, 가족력 등 10개의 독립변수를 이용하 여 예측을 진행하였으며 이용한 변수 중 골다공증 유병여부 를 예측하는데 영향력 가장 큰 변수는 나이로 나타났다. 또 한, 예측결과 XGBoost의 AUC가 0.710으로 가장 높았으며 변수를 줄여가며 평가한 결과 7개 변수를 사용하였을 때 AUC는 0.750으로 모델의 성능이 가장 높았다. 이러한 연구 의 결과는 다양한 질병의 예측에 적용될 수 있을 것으로 생 각되며, 향후 보건의료분야의 빅데이터 연구에 기초 자료로 활용될 것으로 기대된다.
REFERENCES
[1] Park H, So J. The validational study of OSTA (Osteoporosis Self Assessment Tool for Asian) for prediction of osteoporosis in korean post- and peri- menopausal women. Obstetrics & Gynecology Science.
2003;46(2):276-82.
[2] Kang B, Kwon S, Kim D, Kim E, Kim I, Kim J, et al.
Manual of bone densitometry. Seoul: Cheongwoon; 2009.
[3] Yoo J, Lee B. Prediction model of osteoporosis using nutritional components based on association. The Journal of Convergence on Culture Technology.
2020;6(3):457-62.
[4] Lee K, Yoon C, Lee J. Comparison of body weight and body mass index as predictors for osteoporosis among postmenopausal Korean women. Journal of the Korean Academy of Family Medicine. 2005;
26(10):609-13.
[5] Kim K. A study on model of skin type judgment tool using machine learning technique. A Treatise on The Plastic Media. 2018;21(4):115-21.
[6] Jang J, Lee M, Lee T. Development of T2DM prediction model using RNN. Journal of Digital Convergence.
2019;17(8):249-55.
[7] Kwon C. Python machine learning complete guide.
Gyeonggi: Wikibooks; 2019.
[8] Géron A. Hands-on machine learning with sci- kit-learn & tensorflow. Seoul: Hanbit Media Inc; 2016.
[9] Han J, Ko D, Choe H. Predicting and analyzing fac-
tors affecting financial stress of household using machine learning: Application of XGBoost. Journal of Consumer Studies. 2019;30(2):21-43.
[10] Lee S, Jang S, Jung D, Lee J. Reconsideration of the mechanical loading hypothesis: Is obesity pro- tective against osteoporosis? Journal of the Korean Official Statistics. 2014;19(2):1-29.
[11] Baek K, Kang M. Official positions of the interna- tional society for clinical densitometry. Endocrinology and Metabolism. 2005;20(1):1-7.
[12] Kim D. New guidelines for the diagnosis and frac- ture risk assessment of osteoporosis. Journal of Bone Metabolism. 2008;15(1):1-8.
[13] Kim K. Factors associated with the bone mineral density in Korean adults: Data from the 2010-2011 Korean National Health and Nutrition Examination Survey (KNHANES) V. Journal of Agricultural Medicine & Community Health. 2014;39(4):240-55.
[14] Choi J, Han S, Shin A, Shin C, Park S, Cho S, et al. Prevalence and risk factors of osteoporosis and osteopenia in Korean women: Cross-sectional study.
Journal of Menopausal Medicine. 2008;14(1):35-49.
[15] Lee H, Lee S, Cho J, Cho I. Analysis of feature importance of ship’s berthing velocity using clas- sification algorithms of machine learning. Journal of the Korean Society of Marine Environment &
Safety. 2020;26(2):139-48.
[16] Lee B. Prediction model of hypercholesterolemia using body fat mass based on machine learning.
The Journal of Convergence on Culture Technology.
2019;5(4):413-20.
[17] Hong C, Won C. Parameter estimation for the im- balanced credit scoring data using AUC maximization.
The Korean Journal of Applied Statistics. 2016;
29(2):309-19.
[18] Park J, Choi M, Lee S, Choi Y, Park Y. The associa- tion between bone mineral density, bone turnover markers, and nutrient intake in pre- and post- menopausal women. Journal of Nutrition and
Health. 2011;44(1):29-40.
[19] Kim J, Yang Y, Lee M. The influence of osteoporosis knowledge, health belief and self efficacy on os- teoporosis prevention behavior osteoporosis in middle-aged men. Korean Public Health Research.
2020;46(2):13-28.
[20] Lee H, Rho J. Study on the osteoporosis knowledge, concern about osteoporosis factors, and health be- havior to prevent osteoporosis of women in Jeonbuk area.
Journal of Nutrition and Health. 2018;51(6);526-37.
[21] Kim T, Lee H, Chung S, Park H. Differentiation in the management of osteoporosis between pre- menopausal and menopausal women. Journal of Menopausal Medicine. 2011;17(1):21-6.
[22] Song T, Choi H, Lee S, Yeon M, Ko J, Lee C, et al.
Performance of risk indices for prediction of osteopo- rosis in post- and perimenopausal women. Obstetrics
& Gynecology Science. 2005;48(11):2627-34.
[23] Lee J, Kim E, Suk M, Kim E, Hwang L. Factors influencing osteoporosis. Korean Academy of Community Health Nursing. 2003;14(2):253-62.
[24] Choi P, Min I. A predictive model for the employ- ment of college graduates using a machine learning approach. Journal of Vocational Education &
Training. 2018;21(1):31-54.
[25] Lee G, Lee J. A classification of medical and adver- tising blogs using machine learning. Journal of Korea Academia-Industrial cooperation Society.
2018;19(11):730-7.
[26] Eom J, Lee S, Kim B. A feasibility study on the improvement of diagnostic accuracy for en- ergy-selective digital mammography using ma- chine learning. Journal of Radiological Science and Technology. 2019;42(1):9-17.
[27] Kim I, Lee K. Tree based ensemble model for devel- oping and evaluating automated valuation models:
The case of Seoul residential apartment. Journal of the Korean Data And Information Science Society. 2020;31(2):375-89.
구분 성명 소속 직위
제1저자 이인자 동남보건대학교 부교수
교신저자 이준호 동남보건대학교 조교수