1)
** This study was supported by the Fund for Humanities & Social Studies at Pusan National University 2015.
** Associate Professor, Department of Geography Education, Pusan National University([email protected])
Spaciotemporal Distributions of PM
10Concentration and Their Correlation with Local Temperature Changes : a Case Study of Busan Metropolitan City *
Park, Sunyurp**
PM
10농도의 시공간적 분포 특징과 국지적 기온 변화 간의 상관관계 : 부산광역시 사례 분석 *
박 선 엽**
Abstract The main objective of this study was to investigate the climatic impact of PM: 10 concentration on the temperature change pattern in Busan Metropolitan City(BMC), Korea during 2001~2015. Mean PM10 concentration of BMC has gradually declined over the past 15 years. While the highest PM10 concentration was observed in spring followed by winter, summer, and fall on average, the seasonal variations of PM10 concentration differed from place to place within the city. Frequency analysis showed that the most frequently observed PM10
concentration ranged from 20 g/mμ 3 to 60 g/mμ 3, which accounted for 64.6% of all daily observations. Overall, the west-high and east-low pattern of PM10 concentration was relatively strong during the winter when the effect of yellow-dust events on the air quality was weak. Comparative analyses between PM10 concentration and monthly temperature slope derived from generalized temperature curves indicated that the decreasing trend of PM10 concentration was associated with increases of annual temperature range, and PM10 concentration had a negative relationship with the temperature slope of warming months. Overall, PM10 concentration had a weak correlation with the annual mean temperature, but it had a significant, positive correlation with the winter season, which had a dominant influence on the annual mean temperature. In terms of energy budget, it has been known that the change in PM10 concentration contributes to the warming or cooling effect by affecting the radiative forcing due to the reflection and absorption of radiant energy. The correlation between PM10
concentration and temperature changes in the study area was not seasonally and spatially consistent, and its significance was statistically limited partly due to the number of observations and the lack of potential socioeconomic factors relevant to urban air quality.
Key Words PM: 10, Busan Metropolitan City, Yellow dust, radiative forcing
요약 본 연구의 목적은 : 2001~2015년 동안 부산광역시의 PM10농도가 기온변화 패턴에 미치는 영향을 파악하는 것이다 최. 근 15년간 관측된 부산광역시 PM10농도는 꾸준한 감소 추세를 보이고 있다 계절적 . PM10농도는 평균적으로 봄철에 가장 높 게 나타났고 겨울철 여름철 가을철의 순으로 관측되었지만 관측 지점별로 계절적 평균 농도 순위는 일정하지 않았다, , , , . PM10
농도의 구간별 발생 빈도를 분석한 결과 가장 높은 빈도로 관측된 미세먼지 농도는 , 20 g/mµ 3~60 g/mµ 3범위로 조사되었고, 이는 전체 관측일수의 64.6%에 달했다 황사일과 비황사일의 월평균 농도를 공간적으로 비교한 결과 황사의 영향이 상대적. , 으로 작은 겨울철에 미세먼지 농도의 서고동저 패턴이 다소 강하게 나타난 반면 황사의 영향이 증가하는 봄철에는 지역적 차, 이가 감소하였다 단순화된 연간 기온 곡선을 이용하여 산출한 월평균 기온증감률을 . PM10농도와 비교한 결과, PM10농도 변 화는 연구지역 평균 기온상승률과 음의 상관관계를 보임에 따라 PM10농도 감소 추세는 연중 기온 변화 폭 연교차 의 증가 경( ) 향으로 이어졌다 전체적으로 . PM10농도 변화는 연평균기온과는 미미한 상관관계를 나타냈지만 연평균기온에 지배적인 영향, 을 주는 겨울철로 국한할 때 PM10농도와 기온은 비교적 높은 양의 상관관계를 보였다 에너지 수지 측면에서. , PM10농도 변 화는 복사에너지의 반사와 흡수에 따른 복사강제력에 영향을 미쳐 온난화 또는 냉각효과에 기여하게 되는데 연구지역의 , PM10농도 변화와 기온 변화 간의 상관관계는 시공간적으로 일정하지 않고 도시 대기 질에 연관된 사회경제적 요인이 고려되 지 않아 통계적 유의성은 제한적으로 나타났다.
주요어:PM10, 부산광역시 황사 복사강제력, ,
1. Introduction
The temporal and spatial variation of the concentration of atmospheric substances including the fine dust directly or indirectly influences the surface temperature change through the radiative effect in terms of the atmospheric radiant energy balance(Albrecht, 1989; Kaufman
et al
., 2002; Honget al
., 2008).Suspended particles, such as particulate matter with a diameter 10 m(PM≤ μ 10), are a significant factor in air quality and public health, and they are an important contributor to the interactions between solar radiation and temperature change (Dockery and Pope, 1994; Kwon
et al
., 2002;Remer
et al
., 2008; Leeet al
., 2009; Jeonget al
., 2013). In major metropolitan cities in Korea, the origins and dynamics of natural or artificial pollutants from rapid urban expansion, vehicle emissions, industrial pollutants, biomass burning, and yellow dust are complicated in time and space, and it is difficult to determine correlations between atmospheric materials and climate change(Jinet al
., 2003; Leeet al
., 2006; Kimet al
., 2009; Leeet al
., 2011; Lee, 2012; Park, 2016; Park and Choi, 2016). Most studies on urban PM10 dynamics conducted for the past decade focused primarily on diurnal, weekly, or seasonal changes and distributions and their relationships with meteorological characteristics, including rainfall, humidity, winds, and atmospheric pressure systems. Seasonally, high- level PM10 concentration events are most frequent in spring followed by winter in Korea.Well-known yellow dust events, relatively low humidity, low rainfall, and high pressure systems over Korean Peninsula in spring and winter are common causes of high-PM10
conditions(Lee
et al
., 2011; Jeon, 2012; Kim and Lee, 2013). Diurnal and weekly cycles of PM10 concentrations are significantly associated with human activities in major metropolitancities. High-PM10 levels are typically observed in commuting hours in the morning and evening, and PM10 concentrations are much higher during the weekdays compared to weekends(Jeon, 2003; Jin
et al
., 2003). The magnitude of PM10-level difference between weekdays and weekends was reported greater in industrialized areas than residential areas (Jeon, 2010).The influence of atmospheric substances on temperature change can be explained by radiative forcing. Radiative forcing is the radiative effect resulting from an increase in the concentration of natural or anthropogenic aerosol or greenhouse gases, and it causes a net change in the Earth’s absorbed and emitted solar and thermal energy. Atmospheric substances may cool the atmosphere by reflecting solar radiation or warm the atmosphere by absorbing the energy. Atmospheric particles also affect climate indirectly acting as cloud condensation nuclei(Kokhanovsky and de Leeuw, 2009).
Atmospheric suspended particles, commonly referred to as atmospheric aerosols, are known to exhibit radiative cooling effects as a whole.
In other words, part of radiant energy transferred to the surface is reduced by the atmospheric material, resulting in less amount of energy available to heat the Earth-atmosphere system (Kaufman
et al
., 2002; Honget al
., 2008; Chunget al
., 2010; Zhaoet al
., 2015). However, the impact of atmospheric aerosol, including atmospheric particulate matter, on climate change through radiative forcing still remains uncertain, and the understanding of the atmospheric aerosol effect on climate is low (Kaufmanet al
., 2002; IPCC, 2013).The rate of recent temperature change observed on the Korean peninsula is much higher than the global average, and Busan Metropolitan City(BMC), located on the southeast coast of the peninsula within the monsoon
region of East Asia, is subject to climatic change(Kim
et al
., 2000; Chunget al
., 2004; Anet al
., 2011). Since the city has experienced rapid urbanization for decades since the 1970s, it is urgent for the city to accumulate research results on the relationship between air quality and climate change in the region(Kwonet al
., 2007; Kimet al
., 2014; Leeet al
., 2014; Lee and Lee, 2016). The impact of urbanization on the climate change was reported at the local and regional level, but it is hard to find research results focusing on the correlation between climate change and air quality such as PM10concentration on a local scale(Park
et al
., 2012;Park and Tak, 2013; Jin and Park, 2015). Long- term monitoring and analyses of particulate matter has been technically limited due to lack of continuous data availability in Korea. In fact, the real-time PM10 monitoring system at the national level was only established in the early
2000s for public health and environmental purposes in the nation(Park and Choi, 2016).
Therefore, the effect of PM10 distributions on temperature changes has not been thoroughly studied for most metropolitan areas, and research outcomes in relation to urban climate change on the long-term scale are still rare (Jeong
et al
., 2013). The purpose of this study is to quantitatively investigate the effect of air quality on climate change by analyzing the spatiotemporal characteristics of the atmospheric PM10 concentration and their correlation with local temperature in BMC.2. Materials and Methodology
1) Study Area
BMC is located at the southeastern edge of the Korean peninsula and it is the largest port
Figure 1. Busan Metropolitan City. Locations of weather stations and PM10 monitoring sites are provided along with a shaded-relief map of the city. Site names are labeled only for weather stations for visual clarity of the map
city of the nation(Figure 1). The climate of the city is classified as humid subtropical winter-dry climate, and the city is hot and wet in summer and cold and dry in winter. The city’s annual mean temperature and total precipitation are 14.7℃ and 1,519mm, respectively. More than a half(51%) of annual total precipitation is concentrated in summer from June to August, while precipitation in winter takes up only 7%
of the annual rainfall. BMC’s eastern area is largely covered by forests, and the western part of the city is agricultural plains and industrialized districts. As the second largest city in the nation with its population of 3.5 million, BMC is the economic, educational, and cultural center in the southeastern region of the country. The city’s population is primarily distributed in the central part of the city along a narrow valley surrounded by mountainous landscape. The deterioration of air quality due to industrial
development and urban sprawl, especially the increase of fine dust concentration, has become an urgent environmental problem. It is reported that the increase of the PM10 concentration of the coastal city is accelerated due to the emission of the ship on the shore in addition to the rapid increase of the traffic volume(Jeon, 2010).
2) PM10 and Climate Data
PM10 concentration records were collected from the network of the air quality monitoring system operated by the National Institute of Environmental Research(NIER). The data acquisition began at different times among the locations, and the data periods ranged from 11 to 15 years(Table 1). Hourly records were averaged for 24 hours to compute daily data, and monthly mean was computed by averaging daily records if the number of observations
Site Data period Latitude(°N) Longitude(°E) Location
Gwangbok 2001.2~2015.12 129.03 35.10 Jung-gu, Busan
Gudeoksan* 2005.6~2015.12 128.98 35.12 Seo-gu, Busan
Hakjang 2001.1~2015.12 128.98 35.15 Sasang-gu, Busan
Taejongdae 2001.1~2015.12 129.08 35.06 Youngdo-gu, Busan
Noksan* 2004.2~2015.12 128.86 35.09 Gangseo-gu, Busan
Gijang* 2002.3~2015.12 129.22 35.24 Gijang-gun, Busan
Jwadong* 2005.12~2015.12 129.17 35.17 Haewundae-gu, Busan
Jeonpo 2001.1~2015.12 129.06 35.15 Busanjin-gu, Busan
Bugok* 2002.3~2015.12 129.09 35.23 Geumjeong-gu, Busan
Myungjang* 2003.6~2015.12 129.10 35.20 Dongrae-gu, Busan
Daejeo* 2002.3~2015.12 128.96 35.21 Gangseo-gu, Busan
Daeyeon 2001.1~2015.12 128.09 35.13 Nam-gu, Busan
Janglim 2001.1~2015.12 128.97 35.08 Saha-gu, Busan
Deokcheon 2001.1~2015.12 129.02 35.22 Buk-gu, Busan
Cheongryong 2001.1~2015.12 129.09 35.28 Geumjeong-gu, Busan
Yeonsan 2001.1~2015.12 129.08 35.18 Yeonje-gu, Busan
Yongsuri* 2004.11~2015.12 129.18 35.33 Gijang-gun, Busan
Gwangan* 2002.4~2015.12 129.11 35.15 Suyoung-gu, Busan
Table 1. Locations of PM10 monitoring sites in BMC (*Start of data collection ranges from 2002 to 2005)
were 20 days or more per month(Jeon, 2003).
Annual mean PM10 concentration was computed if monthly means for 9 months or more existed each year. In addition to PM10 concentration data, the occurrence days of yellow dust were also acquired from the Korea Meteorological Administration(KMA). Using the yellow-dust information, PM10 concentrations on yellow-dust days and non-dust days were compared to determine the impact of yellow dust on the distribution of PM10 concentration.
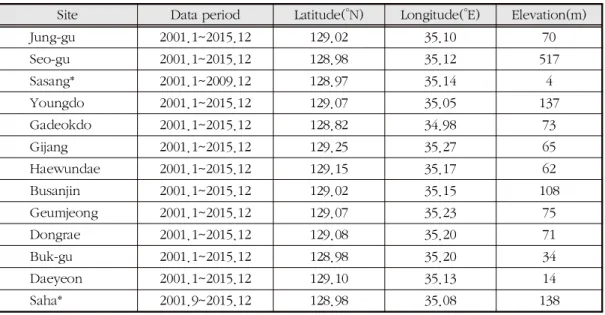
Daily air temperature and precipitation data from 2001 to 2015 were acquired from 12 automatic weather systems(AWS) and 1 automatic synoptic observing system(ASOS) managed by KMA. Continuous temperature data were available for 15 years(2001~2015) at 11 locations, but data were partially missing for two locations(Table 2).
Locations of weather stations are not the same as those of PM10 monitoring sites. For comparative analyses of PM10 and temperature data, the closest weather station was selected for each PM10 monitoring site.
3) Smoothing of Temperature Data
Simplification of temperature time series was carried out in order to ascertain the overall increasing or decreasing trend of the air temperature according to the change of atmospheric PM10 concentration. In other words, in order to calculate the slope of the temperature change at a certain point, it is necessary to express the annual temperature change as a continuous temperature curve function by extracting and adding the time series elements describing most of the variations of the temperature data. Harmonic analysis or Fourier analysis is commonly used to simplify and summarize complex time-series data, such as temperature data, into a limited number of major data elements called harmonic terms (Andres
et al
., 1994; Olsson and Eklundh, 1994;Azzali and Menenti, 2000; Jakubauskas
et al
., 2001; Davis, 2002; Park, 2003; Park, 2009;Wilks, 2011). This method is a mathematical technique that allows the analyzer to determine the overall change pattern of the input data by reducing the regularly observed time series data at a fixed time interval to a general waveform defined by wavelength, amplitude, and phase Site Data period Latitude(°N) Longitude(°E) Elevation(m)
Jung-gu 2001.1~2015.12 129.02 35.10 70
Seo-gu 2001.1~2015.12 128.98 35.12 517
Sasang* 2001.1~2009.12 128.97 35.14 4
Youngdo 2001.1~2015.12 129.07 35.05 137
Gadeokdo 2001.1~2015.12 128.82 34.98 73
Gijang 2001.1~2015.12 129.25 35.27 65
Haewundae 2001.1~2015.12 129.15 35.17 62
Busanjin 2001.1~2015.12 129.02 35.15 108
Geumjeong 2001.1~2015.12 129.07 35.23 75
Dongrae 2001.1~2015.12 129.08 35.20 71
Buk-gu 2001.1~2015.12 128.98 35.20 34
Daeyeon 2001.1~2015.12 129.10 35.13 14
Saha* 2001.9~2015.12 128.98 35.08 138
Table 2. Locations of weather stations in BMC (*partially missing data)
(Figure 2). The wavelength of each waveform represents the time it takes for a given phenomenon to complete one cycle.
The amplitude is the half value of the waveform height, and the phase represents the time at which the peak value of the waveform occurs. The sum of all the waveforms generated by the Fourier analysis is restored to the original input data. Among the waveforms derived from the Fourier analysis, the periodic waveform in which the peak occurs once during the period of the analysis cycle, one year, is referred to as the first term, and the order of harmonic terms increases in sequence as the number of peaks increases. A basic trigonometric relationships used in the Fourier analysis is expressed in an equation below(Olsson and Eklundh, 1994; Jaku- bauskas
et al
., 2001):
sin cos It is assumed that one complete wave form of a simple cosine curve has an interval of 2 for the year. π is the mean of the whole time-series. The subscript is called the harmonic number or the frequency of the curve per interval. N is the number of observations in the time-series, and P is the fundamental periods of the data(e.g. P=26 if data are treated biweekly). Finally, and are two Fourier coefficients, and more detailed description is provided in Jakubauskas
et al
.(2001). The harmonic equation states that any complex time-series can be expressed as the sum of a series of cosine curves. It is normally observed that the first few harmonic terms explain most of variance of the input data. For example, the first harmonic term of temperature data represents a waveform thatcompletes one single cycle per year, and it is the dominant periodic component of annual temperature changes(Park, 2010; Jin and Park, 2015). Percent variance of each harmonic term decreased dramatically as the order a harmonic term increased. The first four harmonic terms, which were used in the analysis, explained more than 95% of the input data variance.
Once the raw air temperature time-series was simplified by Fourier analysis, the output temperature curve function was differentiated to compute the first derivative on a daily basis.
Differentiation is a mathematical process that computes a derivative of a function of a real variable. By definition, a first derivative of a function at a given time, , is the slope of the tangent line to the function at the time of . Figure 2. Schematic diagram of the first two harmonic terms (upper panel) and comparison between the sum of the major terms and raw data (lower panel)
Since the tangent line to the function is the best linear approximation at the given point in terms of its slope, the first derivative often represents the instantaneous rate of change, indicating how much the function is increasing or decreasing at the time of (Park, 2016). For example, the derivative of a temperature curve function, , of an independent time variable represents the rate at which the dependent temperature of the function changes with the change of the time. A positive derivative indicates that the function increases with time, whereas a negative derivative indicates that the function decreases with time. In notation, the derivative of with respect to is expressed as /, or ′ indicating the ratio between the two infinitesimal quantities.
Increasing or decreasing rates of the daily temperature were finally averaged and integrated into monthly values.
3. Results and Discussion
1) Seasonal Distributions of PM10 Concentration
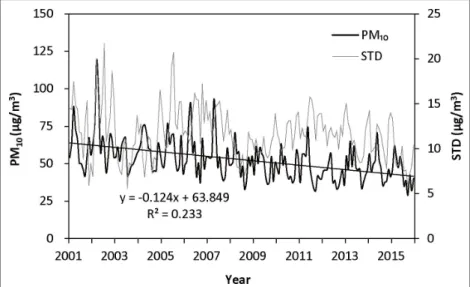
The concentration of PM10 in BMC showed an obvious decline during the study period (Figure 3). Seasonal average concentration records over the past 15 years showed that the highest concentration was observed in spring (63.3±2.1 g/mμ 3) followed by winter(50.2±2.5
g/m
μ 3), summer(47.0±2.0 g/mμ 3), and fall(45.6
±2.3 g/mμ 3). Comparing with the mean concentrations within the city, the season with the highest PM10 concentration was spring at all observation points, but the season with the second highest PM10 concentration was different among the locations. While the second highest PM10 concentration was observed in summer at 7 out of 18 locations, the PM10 concentration of winter was higher than that of summer at the other 11 locations. Therefore, it is concluded that the seasonal variations of PM10 concentrations varied spatially in the city. Previous studies reported that the highest PM10 concentration was observed in spring as shown in this study, but the PM10 concentration was lowest in summer(Jeon, 2003; Jeon, 2010). In addition, frequent precipitation and atmospheric instability were suggested as a potential cause of the low
Figure 3. Time-series of mean PM10 concentration and its standard deviation(STD) during the study period(2001~2015)
PM10 concentration in summer(Jin
et al
., 2003).These discrepancies in the study results show that seasonal and interannual variability of precipitation increased in the long-term trend and its correlation with PM10 concentration became variable within the city while PM10
concentration continued to decrease.
Analysis results showed that the frequency of relatively high PM10 concentrations above 100
g/m
μ 3 was highest in spring, and the percent frequency of the high concentrations was recorded 10.2% of the daily observations in spring. The second highest frequency of the high concentrations was observed in winter with 5.2% of the daily observations. The frequency of high PM10 concentrations was observed in the order of spring> winter> fall>
summer, but the mean concentration of all observation locations was found in the order of spring(158.25 g/mμ 3)> fall(124.85 g/mμ 3)> summer (121.15 g/mμ 3)> winter(117.95 g/mμ 3). The seasonal percent frequency and mean concentration of high PM10 did not agree to each other. This result may be caused by the fact that the correlation between the frequency and mean of high PM10 concentration was changing by
season. In other words, in the spring when the number of high-PM10 days is mostly concentrated, a very strong negative correlation between the frequency and the concentration was observed, but the correlation was not clear in the other seasons.
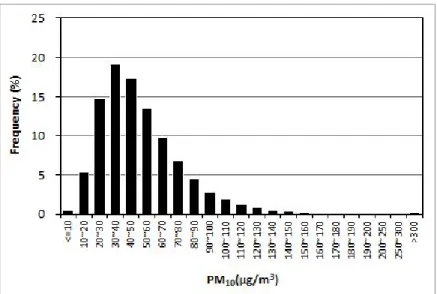
By statistics, the most frequent PM10 concen- tration level during the study period ranged from 20 g/mμ 3 to 60 g/mμ 3. The percent frequency of the concentration range reached 64.6% of the entire daily observations. In particular, the modal interval was in the range of 30 g/mμ 3~40
g/m
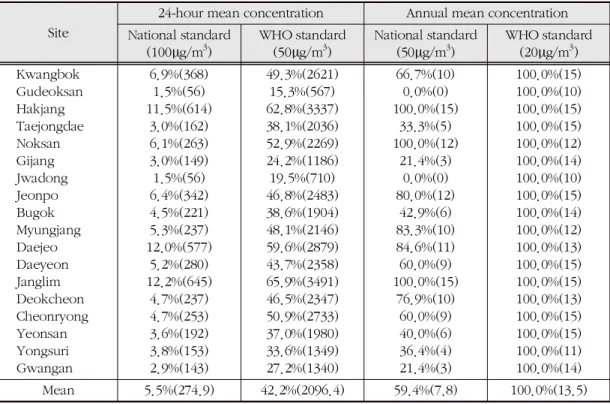
μ 3, which accounted for 19.0% of the total daily observations. In contrast, the highest concentration interval of > 150 g/mμ 3 was minimal(0.9%). In terms of the number of days exceeding the domestic air-quality standard of the 24-hour mean concentration of 100 g/mμ 3, the percent frequency ranged from 1.5% to 12.2% with the mean of 5.5% in the city(Figure 4). Domestic PM10 standards are significantly higher than those of the World Health Organization(WHO, 2006). If the WHO’s daily PM10 standard of 50 g/mμ 3 was applied, the number of days exceeding the air-quality standard was 2,096 days on average out of the
Figure 4. Percent frequency of PM10 concentration
total 5,478 observation days in the city, and the percent frequency locally reached up to 65.9%(3,491 days exceeding the standard at Janglim). Seasonally speaking, based on the 18 monitoring stations, 57.1% and 41.6% of the daily observations exceeded the 24-hour mean PM10 standard of WHO in spring and winter, respectively. If the same observations were evaluated by the domestic air-quality standard, the number of days exceeding the domestic standard was only found 10.2% and 5.2% in spring and winter, which was significant discre- pancy between the two different air-quality standard applications. Annual mean PM10
concentrations ranged from 42.1 g/mμ 3 to 65.5 g/m
μ 3 among the monitoring stations of the city. The domestic annual air-quality standard of PM10 is 50 g/mμ 3, and the percent frequency of the number of years that exceeded the
domestic annual standard was 59.4% on average.
When the WHO PM10 standard(20 g/mμ 3) was applied to the annual PM10 concentration data, the annual mean PM10 concentrations exceeded the air-quality standard at all monitoring locations without exception(Table 3). Knowing that the frequency of high-PM10 concentration was substantially high throughout the year against both the international and the national air-quality standards, it is urgent to revise the national measures to reduce the PM10 concentration over major urban areas in the nation.
2) Impact of Yellow Dust
The monthly mean PM10 concentration was highest in spring(March to May), and the air-quality of the season was significantly influenced by seasonally-induced yellow-dust
Site
24-hour mean concentration Annual mean concentration National standard
(100 g/mµ 3)
WHO standard (50 g/mµ 3)
National standard (50 g/mµ 3)
WHO standard (20 g/mµ 3) Kwangbok
Gudeoksan Hakjang Taejongdae Noksan Gijang Jwadong Jeonpo Bugok Myungjang Daejeo Daeyeon Janglim Deokcheon Cheonryong Yeonsan Yongsuri Gwangan
6.9%(368) 1.5%(56) 11.5%(614)
3.0%(162) 6.1%(263) 3.0%(149) 1.5%(56) 6.4%(342) 4.5%(221) 5.3%(237) 12.0%(577)
5.2%(280) 12.2%(645)
4.7%(237) 4.7%(253) 3.6%(192) 3.8%(153) 2.9%(143)
49.3%(2621) 15.3%(567) 62.8%(3337) 38.1%(2036) 52.9%(2269) 24.2%(1186) 19.5%(710) 46.8%(2483) 38.6%(1904) 48.1%(2146) 59.6%(2879) 43.7%(2358) 65.9%(3491) 46.5%(2347) 50.9%(2733) 37.0%(1980) 33.6%(1349) 27.2%(1340)
66.7%(10) 0.0%(0) 100.0%(15)
33.3%(5) 100.0%(12)
21.4%(3) 0.0%(0) 80.0%(12)
42.9%(6) 83.3%(10) 84.6%(11) 60.0%(9) 100.0%(15)
76.9%(10) 60.0%(9) 40.0%(6) 36.4%(4) 21.4%(3)
100.0%(15) 100.0%(10) 100.0%(15) 100.0%(15) 100.0%(12) 100.0%(14) 100.0%(10) 100.0%(15) 100.0%(14) 100.0%(12) 100.0%(13) 100.0%(15) 100.0%(15) 100.0%(13) 100.0%(15) 100.0%(15) 100.0%(11) 100.0%(14)
Mean 5.5%(274.9) 42.2%(2096.4) 59.4%(7.8) 100.0%(13.5)
Table 3. Percent frequency(number of days or years in parenthesis) of 24-hour mean and annual PM10
concentration that exceeded the national and WHO standard during the study period (2001~2015)
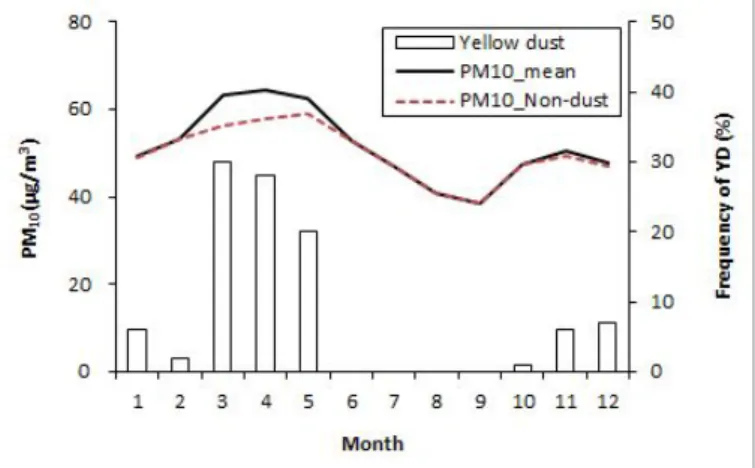
events. The monthly incidence of yellow dust reached 78% from March to May during the study period, followed by winter(15%) and fall(7%). The number of yellow- dust events in spring was 78 days, which is only 1.4% of the total observation days, but the mean PM10 concentration in spring was increased by 6.1%~12.2% due to yellow dust compared to the mean PM10 concentration of non-yellow dust days. The frequency of yellow-dust events in fall and winter was only 7 and 15 days, respectively, and their effect on monthly mean PM10 concentration was negligible (Figure 5).
In terms of the frequency of the monthly PM10 concentration for non-yellow dust days, the occurrence of low-level con- centration( 50 g/m≤ μ 3) range was most dominant. Seasonally, the low-PM10
concentration was most common in fall (67.6% or 758 days) followed by summer (62.7% or 702 days), winter(59.0% or 642 days) and spring(44.7% or 477 days). The percent frequency of the intermediate- PM10 concentration(50~100 g/mμ 3) was
29.2%~48.1% (or 332~522 days) depending on the season, and the frequency of high concentration (>100 g/mμ 3) was only 3.1%~7.3%
(or 34~79 days). Intermediate and high-PM10 concentrations were dominantly observed on yellow- dust days, which occurred mainly in spring and winter. On yellow- dust days in spring, which accounts for 78% of the all yellow-dust days, the percent frequencies of inter- mediate- and high-PM10 concentration were 25.9%(or 15 days) and 65.0%
(or 38 days), respectively. In winter,
Figure 6. Seasonal frequency(days) of low-, intermediate-, and high-PM10 concentration on non-dust(upper panel) and yellow-dust days(lower panel). No yellow-dust events were observed in summer Figure 5. Monthly mean PM10 concentrations of all observation
days and non-dust days are compared with percent frequency of yellow-dust(YD) events
the percent frequencies of intermediate- and high-PM10 concentration were 58.1% (or 7 days) and 38.6%(or 5 days), respectively(Figure 6).
The monthly mean PM10 concen- trations of the yellow dust and non- dust days were similar to each other in terms of their seasonal patterns.
However, the spatial distribution of PM10 concentrations for 18 observa- tional sites varied throughout the year. In other words, the spatial distribution of the monthly mean PM10 concentrations of yellow-dust days and non-dust days differed from month to month. Spatial correlations Figure 7. Monthly mean PM10 concentration of yellow-dust
days in the order of its magnitude. Size of each circle represents its correlation with the PM10
concentration of non-dust days in that month
Figure 8. Distribution of monthly mean PM10 concentration on yellow-dust days and non-dust days in January(a and b) and April(c and d) during the study period (2001~2015)
between PM10 concentrations of yellow-dust and non-dust days decreased with increasing monthly mean PM10 concentrations of yellow- dust days(Figure 7). In January, when the monthly mean PM10 concentration of yellow- dust days was lowest, the distribution patterns of the PM10 concentration of yellow-dust days and non-dust days were shown similar to each other(r=0.878). By contrast, in April, when the monthly mean PM10 concentration of yellow- dust days was highest, their spatial distributions were different from each other(Figure 8, a and b). Overall, the west-high and east-low pattern of PM10 concentration was relatively strong during the winter, when the effect of yellow- dust events on the air quality was weak.
However, local variations of PM10 concentration were reduced in spring, when both of PM10
concentrations and occurrence of yellow-dust events significantly increased, and the spatial relationship became weaker.
3) Correlation between PM10 and Temperature Change
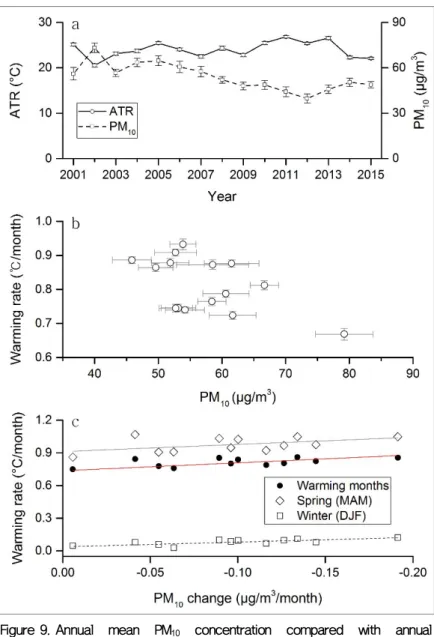
The monthly mean PM10 concentration of the city showed a distinct decreasing trend throu- ghout the study period, but its correlation with air temperature was seasonally variable. The mean PM10 concentration during the last 15 years was analyzed to have a statistically strong correlation(r=0.758, P<0.01) with the mean temperature in winter, whereas the other seasons did not show any significant correlation with PM10 concentration. The selective relation- ship between PM10 concentration and seasonal temperature lead to a moderate inverse relationship(r=-0.500, p<0.05) between annual PM10 concentration and annual temperature range(ATR). This result indicated that ATR increased primarily due to colder temperature in winter as PM10 concentration declined over
the years(Figure 9a). However, it should be noted that this negative correlation was statistically valid only for five locations in the city ranging from r= -0.465 to -0.708. Although the increasing trend of ATR was statistically limited during the study period, it was obviously shown that the temperature slope of warming months(or warming rate) became steeper as PM10 concentration decreased(r=
-0.549, p<0.05; Figure 9b). Knowing that the radiative effect of PM10 was found inconsistent over the year, it is difficult to declare whether the warming or cooling effect of particulate matter took place in the city. From the statistical analyses, however, it is speculated that the warming effect rather than the cooling effect was associated with PM10 distributions, and it was reduced due to weakening of the radiative forcing by PM10, resulting in colder winter temperature. In order to investigate if this correlation between PM10 concentration and temperature change existed in spatial dimension, the decreasing slope of monthly PM10 concen- tration was compared with monthly temperature slope. The decreasing rate of PM10 concentration ranged from -0.006 to 0.191 g/m– μ 3/month during the study period. The variation of the rate was relatively large among the monitoring locations, and its correlation with warming rate was significant. Figure 9c shows that the warming rate in spring(r=-0.489, p<0.05), winter(r=-0.727, p<0.01), and in all warming months(r=-0.587, p<0.05) clearly increased as the decreasing rate of the PM10 concentration was enhanced (became more negative). Therefore, it may be reasonable to conclude that the more rapid the decreasing PM10 concentration, the steeper the temperature slope in warming periods over the year. As mentioned above, the steeper temperature slope was primarily caused by significant decreases in winter temperature with decreasing PM10 concentration. The reason why
the diminishing radiative effect of PM10
concentration was found only in winter is still questionable, and it requires further investigation.
4. Concluding Remarks
The PM10 concentration of BMC has been
gradually decreasing over the past 15 years.
Seasonally, PM10 concentrations were highest in spring at all locations, but the order of the rest seasons was not constant at each observation site. The most frequently observed PM10
concentrations ranged from 20 g/mμ 3/ to 60 g/mμ 3, which was 64.6% of the total observation days.
Figure 9. Annual mean PM10 concentration compared with annual temperature range(ATR)(a) and a correlation between annual mean warming rate and mean PM10 concentration(b). Decreasing rate of PM10 concentration also had a significant correlation with monthly mean warming rates(c)
The number of days that exceeded the domestic PM10 standard of 24-hours mean concentration (100 g/mμ 3) was in the range of 1.5%~12.2%
(average=5.5%) among the observation sites.
However, when the WHO standard(50 g/mμ 3) was applied, 57.1% and 41.6% of the total observation days exceeded the WHO standard in spring and in winter, respectively. Especially, statistical results showed that the annual mean PM10 concentration exceeded the WHO standard at all observation sites in all years. Therefore, there is an urgent need for discussion on the revision of the domestic environmental standard for proper regulation of PM10 concentration.
Comparison of the spatial distributions of monthly mean PM10 concentration between yellow-dust days and non-dust days indicated that their spatial patterns became more dissimilar to each other as the mean PM10 concentration of yellow-dust days increased. Overall, the west- high and east-low pattern of PM10 concentration was relatively strong during the winter, when the effect of yellow-dust events on the air quality was weak. In spring, when both of PM10
concentrations and occurrence of yellow-dust events increased, the spatial correlation between the two conditions(yellow-dust days and non- dust days) diminished within the city.
Comparative analyses between PM10 concen- tration and monthly temperature slope derived from generalized temperature curves indicated that the decreasing trend of PM10 concentration was associated with increases of annual temperature range, and PM10 concentration had a negative relationship with the temperature slope of warming months. Overall, PM10 concen- tration did not have a significant correlation with the annual mean temperature, but it had a significant, positive correlation with winter temperature. Since the PM10 concentration gradually decreased during the study period, the reduced radiative forcing of particulate
matter may be translated into the cooling effect.
However, it is difficult to say conclusively if the warming or cooling effect of particulate matter took place in the city because the statistically significant correlation between PM10 concentra- tion and temperature change was found only in limited locations and season, and the period of observations(2001~2015) considered in the analyses was also limited. From the viewpoint of energy balance, the decreasing PM10 concen- tration is thought to weaken the radiative forcing, leading to colder winter temperature and therefore the reduced warming effect.
Geographic discrepancy between PM10 monitoring sites and weather stations is another source of uncertainty. Obviously, the results of this study were based only on the limited range of a city, and a more general and convincing interrela- tionship between PM10 and temperature change can be obtained by compiling expanded data analysis and broadening the sampling area. In addition, socioeconomic factors associated with urbanization, sea surface temperature near the city, wind effects, landforms, and meteorological conditions are important components, and their contribution to the climatic change of urban environment remains to be discussed in the future study.
Acknowledgements
This study was supported by the Fund for Humanities & Social Studies at Pusan National University 2015.
References
Albrecht, B.A., 1989, Aerosols, cloud micro- physics, and fractional cloudiness,
Science
, 245(4923), 1227-1230.An, S.I., Ha, K.J., Seo, K.H., Yeh, S.W., Min, S.K., and Ho, C.H., 2011, A review of recent
climate trends and causes over the Korean Peninsula,
Climate Change Research
, 2(4), 237-251.Andres, L., Salas, W.A., and Skole, D., 1994, Fourier analysis of multi-temporal AVHRR data applied to a land cover classification,
International Journal of Remote Sensing
, 15(5), 1115-1121.Azzali, S. and Menenti, M., 2000, Mapping vegetation-soil-climate complexes in southern Africa using temporal Fourier analysis using NOAA-AVHRR-NDVI data,
International Journal of Remote Sensing
, 21(5), 973-996.Chung, C.E., Ramanathan, V., Carmichael, G., Kulkarni, S., Tang, Y., Adhikary, B., Leung, L.R., and Qian, Y., 2010, Anthropogenic aerosol radiative forcing in Asia derived from regional models with atmospheric and aerosol data assimilation,
Atmospheric Chemistry and Physics
, 10(13), 6007-6024, doi:10.5194/acp- 10-6007-2010.Chung, Y.S., Yoon, M.B., and Kim, H.S., 2004, On climate variations and changes observed in South Korea,
Climate Change
, 66(1), 151-161.Davis, J.C., 2002,
Statistics and Data Analysis in Geology
, John Wiley & Sons, Inc., New York, 268.Dockery, D.W. and Pope, C.A., 1994, Acute respiratory effects of particulate air pollution,
Annual Review of Public Health
, 15, 107-132.Hong, S.C., Chung, I.U., Kim, H.J., Lee, K.T., and Lee, J.B., 2008, Estimation of aerosol radiative forcing by AGCM,
Journal of the Environmental Sciences
, 17(6), 623-631.IPCC, 2013,
Climate Change 2013: The Physical Science Basis
, in Stocker, T.F., Qin, D., Plattner, G.-K., Tignor, M., Allen, S.K., Boschung, J., Nauels, A., Xia, Y., Bex, V., and Midgley, P.M. (ed.),Contribution of Working Group I to the Fifth Assessment Report of the Intergovernmental Panel on
Climate Change
, Cambridge University Press, New York.Jakubauskas, M.E., Legates, D.R., and Kastens, J.H, 2001, Harmonic analysis of time-series AVHRR NDVI data,
Photogrammetric Engin- eering and Remote Sensing
, 67(4), 461-470.Jeon, B.I., 2003, Characteristics of spaciotem- poral variation for PM10 concentration in Busan,
Journal of the Environmental Sciences
, 12(10), 1033-1041.Jeon, B.I., 2010, Characteristics of spacio- temporal variation for PM10 and PM2.5
concentration in Busan,
Journal of the Environmental Sciences
, 19(8), 1013-1023.Jeong, J.H., Kim, H.S., Kim, J.T., Park, Y.P., and Choi, H.J., 2013, An analysis of aerosol direct radiative forcing using satellite data in East Asia during 2001~2010,
Journal of Environmental Science International
, 22(8), 1053-1062.Jin, M. and Park, S., 2015, Temperature changes of climatic solar terms and their spatiotemporal characteristics in South Korea,
Journal of the Korean Geographical Society
, 50(1), 23-36.Jin, Y.H., Koo, H.J., Kim, B.M., Kim, Y.P., and Park, S.U., 2003, Variations of the PM10
concentrations observed in eleven cities in South Korea between 1995 and 2000,
Journal of Korean Society for Atmospheric Environ- ment
, 19(2), 231-245.Kaufman, Y.J., Tanr , D., and Boucher, O., é 2002, A satellite view of aerosols in the climate system,
Nature
, 419(6903), 215-223.Kim, H., Seok, H., and Kim, Y., 2014, A study on the change of the urban heat island structure in Busan metropolitan area, Korea,
Journal of Environmental Science International
, 23(11), 1807-1820.Kim, K.H., Kim, B.J., Oh, J.H., Kwon, W.T., and Baek, H.J., 2000, Detection of urbani- zation effect in the air temperature change of Korea,
Journal of Korean Meteorological
Society
, 36(5), 519-526.Kim, S. and Lee, S., 2013, The analysis of the weather characteristics by source region of the Asian Dust observed in South Korea,
Journal of the Korean Geographical Society
, 48(2), 167-183.Kim, Y.J., Woo, J.H., Ma, Y.I., Kim, S., Nam, J.S., Sung, H., Choi, K.C., Seo, J., Kim, J.S., Kang, C.H., Lee, G., Ro, C.U., Chang, D., and Sunwoo, Y., 2009, Chemical characteristics of long-range transport aerosol at background site in Korea,
Atmospheric Environment
, 43(34), 5556-5566.Kokhanovsky, A.A. and de Leeuw, G., 2009,
Satellite Aerosol Remote Sensing over Land
, Springer, Chichester, UK, 1.Kwon, H.J., Cho, S.H., Chun, Y., Lagarde, F., and Pershagen, G., 2002, Effects of the Asian dust events on daily mortality in Seoul, Korea,
Environmental Research Section A
, 90(1), 1-5.Kwon, Y., Kwon, W., Boo, K., and Choi, Y., 2007, Future projections on subtropical climate regions over South Korea using SRES A1B data,
Journal of Korean Geographical Society
, 42(3), 355-367.Lee, D.H., Lee, K.H., Kim, J.E., and Kim, Y.J., 2006, Characteristics of atmospheric aerosol optical thickness over the Northeast Asia using TERRA/MODIS data during the year 2000~2005,
Atmosphere
, 16(7), 85-96.Lee, K.H., 2012, Impact of Northeast Asian biomass burning activities on regional atmospheric environment,
Journal of Korean Association of Geographic Information Studies
, 15(1), 184-196.Lee, K., Li, Z., Kim, Y., and Kokhanovsky, A., 2009, Atmospheric aerosol monitoring from satellite observations: a history of three decades, in Kim, Y., Platt, U., Gu, M.B., and Iwahashi, H.,
Atmospheric and Biological Environmental Monitoring
, Springer, NewYork, 13-38.
Lee, S., Ho, C.H., and Choi, Y.S., 2011, High- PM10 concentration episodes in Seoul, Korea:
back-ground sources and related meteoro- logical conditions,
Atmospheric Environment
, 45 (39), 7240-7247.Lee, W., Hwang, M., and Kim, Y., 2014, Health vulnerability assessment for PM10 in Busan,
Journal of Environmental Health Sciences
, 40(5), 355-366.Lee, W. and Lee, M., 2016, Interannual variability of heat waves in South Korea and their connection with large-scale atmospheric circulation patterns,
International Journal of Climatology
, 36(15), 4815-4830.Olsson, L. and Eklundh, L., 1994, Fourier series for analysis of temporal sequences of satellite sensor imagery,
International Journal of Remote Sensing
, 15(18), 3735-3741.Park, M.H., Lee, J.S., Ahn, J.S., Shu, I.S., and Kim, H.D., 2012, Study on the climate change and the urbanization effect in Busan,
Journal of the Environmental Sciences
, 21(4), 401-409.Park, S., 2003, Harmonic analyses of NDVI response patterns to temporal changes in soil moisture content,
The Korean Association of Professional Geographers
, 37(1), 67-79.Park, S., 2009, Synchronicity between satellite- measured leaf phenology and rainfall regime in Hawaiian tropical forests,
Photogrammetric Engineering and Remote Sensing
, 75(10), 1231-1237.Park, S., 2010, A dynamic relationship between the leaf phenology and rainfall regimes of Hawaiian tropical ecosystems: a remote sensing approach,
Singapore Journal of Tropical Geography
, 31(3), 371-383.Park, S., 2016, Influences of temperature change rates and impervious surfaces on the intra-city climatic patterns of Busan Metro- politan Area,
Journal of Korean Association
of Geographic Information Studies
, 19(4), 199-217.Park, S., and Choi, J., 2016, Satellite-measured atmospheric aerosol content in Korea:
anthropogenic signals from decadal records,
GIScience & Remote Sensing
, 53(5), 634-650.Park, S. and Tak, H., 2013, Land use changes and climate patterns in Southeast Korea,
Journal of Korean Association of Geographic Information Studies
, 16(2), 47-64.Remer, L.A., Kleidman, R.G., Levy, R.C., Kaufman, Y.J., Tanr , D., Mattoo, S., Martins,é J.V., Ichoku, C., Koren, I., Yu, H., and Holben, B.N., 2008, Global aerosol climatology from the MODIS satellite sensors,
Journal of Geo- physical Research, 113, D14S07, doi:10.1029/
2007JD009661
.Wilks, D.S., 2011,
Statistical Methods in the Atmospheric Sciences
, Elsevier, Oxford, 428-438.
WHO, 2006,
WHO Air Quality Guidelines for Particulate Matter, Ozone, Nitrogen Dioxide and Sulfur Dioxide-Global Update 2005
, World Health Organization, 9-13.Zhao, H., Che, H., Ma, Y., Xia, X., Wang, Y., Wang, P., and Wu, X., 2015, Temporal variability, particulate matter mass concentra- tion and aerosol optical properties over an urban site in Northeast China,
Atmospheric Research
, 166, 204-212.• 교신 박선엽: (46288, 부산광역시 금정구 부산대학로 번길 부산대학교 사범대학 지리교육과 이메일
63 2, )( :
Correspondence Park, Sunyurp(Department of : Geography Education, Pusan National University, Busan 46288, Korea)(E-mail: [email protected])
접수 수정 채택
( : 2017.01.16, : 2017.02.01, : 2017.02.13)