An Automatic Strabismus Screening Method with Corneal Light Reflex based on Image Processing
Xi-Lang Huang†, Chang Zoo Kim††, Seon Han Choi†††
ABSTRACT
Strabismus is one of the most common disease that might be associated with vision impairment.
Especially in infants and children, it is critical to detect strabismus at an early age because uncorrected strabismus may go on to develop amblyopia. To this end, ophthalmologists usually perform the Hirschberg test, which observes corneal light reflex (CLR) to determine the presence and type of strabismus. However, this test is usually done manually in a hospital, which might be difficult for patients who live in a remote area with poor medical access. To address this issue, we propose an automatic strabismus screening method that calculates the CLR ratio to determine the presence of strabismus based on image processing.
In particular, the method first employs a pre-trained face detection model and a 68 facial landmarks detector to extract the eye region image. The data points located in the limbus are then collected, and the least square method is applied to obtain the center coordinates of the iris. Finally, the coordinate of the reflective light point center within the iris is extracted and used to calculate the CLR ratio with the coordinate of iris edges. Experimental results with several images demonstrate that the proposed method can be a promising solution to provide strabismus screening for patients who cannot visit hospitals.
Key words: Automatic strabismus screening, Corneal light reflex, Image processing
※ Corresponding Author : Seon Han Choi, Address:
(48513) 45 Yongso-ro, Nam-gu, Busan, Korea, TEL : +82-51-629-6240, FAX : +82-51-629-6230, E-mail : shchoi@
pknu.ac.kr
Receipt date : Apr. 26, 2021, Revision date : May 17, 2021 Approval date : May 20, 2021
†††Dept. of Artificial Intelligent Convergence, Pukyong National University
(E-mail : [email protected])
†††Dept. of Ophthalmology, Kosin University College of Medicine (E-mail : [email protected])
†††Dept. of IT Convergence and Application Engineering, Pukyong National University
※ This work was supported by a Research Grant of Pukyong National University(2021)
1. INTRODUCTION
Vision plays an important role for people to un- derstand and interact with the environment.
Normal vision can ensure the accurate cognition of things and give us depth perception. However, many ocular diseases often occur and affect our daily life. Among all the ocular diseases, stra- bismus is one of the most common eye conditions, which affects 5.4% of the population of the USA and commonly occurs in children[1]. Strabismus is a condition in which the eyes do not align with each other when focusing on an object. Many factors
may cause strabismus, such as muscle dysfunc- tion, farsightedness, and problems on the optic nerve, etc. According to the eyes' position, stra- bismus can be divided into 4 types. When one eye or both eyes turn either inward, it is known as eso- tropia, and the opposite condition is called exo- tropia, in which one or both eyes turn outward.
When one eye turns upward, it is called hyper- tropia, and hypotropia indicates that one eye turns downward. Due to the misalignment of the eyes, strabismus can lead to vision impairment and faul- ty depth perception. If the strabismus is not diag- nosed and corrected, it may go on develop to am-
blyopia, which leads to permanently decreased vision.
So far, there are a variety of tests that can screen strabismus for clinical diagnostic purposes, such as the prism cover test (PCT), the red reflex test (RRT), and the Hirschberg test (HT). The PCT (also known as the golden standard) places an occlude over one eye and uses a prism bar to measure the deviation of the uncovered eye for strabismus screening. Despite this test can provide a reliable measurement of ocular misalignment, it can only be performed manually by a well-trained ophthalmologist. The RRT is performed by projec- ting the ophthalmoscope light onto the patient's eyes from approximately 18 inches away in a dark- ened room[2]. Different from the PCT, the RRT has the advantage of being simple, fast, and requires less labor[3]; however, it is limited to be performed under certain conditions. The HT, so- called cor- neal light reflex (CLR) test, is another strabismus screening test in which an ophthalmologist shines light into the eyes of a patient to see if the light in the two eyes is symmetrical. Although HT is the quickest and simplest way to measure ocular alignment among these tests, it still requires man- ual operation and can only be performed in hospi- tals, which is infeasible for people with poor medi- cal access.
To help screen strabismus for the people who cannot visit the hospitals or eye care centers, this work proposed an automatic strabismus screening method with CLR based on image processing. The proposed method includes 5 steps to obtain the screening result. (1) Face detection with a pre- trained face detection model; (2) Facial landmark model for eye region detection; (3) Binarization with Otsu's binarization and HSV color model; (4) Localization of limbus with the least square method (LSM); and (5) CLR ratio estimation based on the limbus and reflective points.
The rest of this study is organized as follows:
Section II provides the background of the image
processing methods for the study, and Section III describes the proposed method. Section IV shows the experimental results, and a brief conclusion is given in Section V.
2. BACKGROUND
In this section, we briefly introduce the image processing techniques used in the proposed method.
They are the face detection model, facial landmark detector, Otsu's binarization, and HSV color space.
2.1 Face detection model
In this study, the proposed method firstly used a face detection model to extract facial parts from a digital image, which is also the foundation for successful strabismus screening. However, the successful detection of faces in images usually af- fected by many factors such as illumination, reso- lution, and occlusion within the image. Therefore, an accurate and stable face detection model that can handle various situations is essential in this study. With the rapid development of deep learning, the use of deep learning methods, namely the con- volutional neural network (CNN), for face detection has achieved a lot of successful progress and shown remarkable performance in various scenes, which could be attributed to its enormous learning capacity and learnable feature extractors. To per- form accurate and reliable face detection for the images taken under various scenes, our method employs a CNN-based face detection model pro- vided by the dlib library. The model is obtained by training a CNN on the images from ImageNet, PASCAL VOC, VGG with the use of maximum margin object detection algorithm [4] as the loss function.
2.2 Facial landmark detector
If the face within the image can be detected, a facial landmark detector will be employed to ex- tract the region of interest (ROI). Dlib library pro-
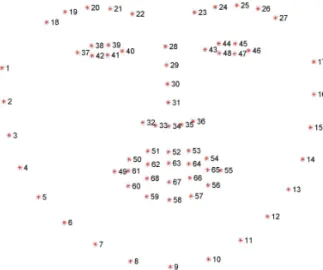
vides a 68 facial landmark detector that is made using the ensemble of regression trees[5], and pre-trained on the IBUG 300-W dataset[6], which aims to help the detector extract the 68 facial land- marks from the labeled face images taken under different situations. The extracted facial landmarks by the detector are shown in Fig. 1. All the land- marks are represented by the index array from 1 to 68. To extract the eye region from the detected face image, our method utilizes the index of 37 and 46 to create a square region that two eyes are included.
Fig. 1. A pre-trained 68 facial landmark detector.
2.3 Otsu's binarization
In image processing, binarization is usually used to keep the ROI in the images while neglecting the backgrounds that we are not concerned with. To achieve this, an optimal threshold value that en- ables separate the target object from the irrelevant object should be pre-defined, which is totally de- pends on the experience of the designer. However, each designer has a different perception of an im- age, and the brightness of each image is different, manually selecting the optimal threshold value for various images to locate the objective is tedious and infeasible. Considering this issue, our method employs Otsu's binarization[7], which can auto- matically determine the optimal threshold rather
than selecting a fixed threshold value. This binar- ization method determines the optimal threshold value that minimizes intra-class intensity variance by enumerating all the possible greyscale levels generated by the histogram. In this study, Otsu's binarization was used to eliminate the influences of the skin color and the sclera (i.e., the white of the eye) to the iris localization.
2.4 HSV color model
Although the binarization method mentioned above could eliminate a big part of irrelevant ob- jects from the eye region image. However, it may fail at distinguishing the object that has a similar color space with the iris, such as the shadows in the internal and medial canthus, shadows between the sclera and the lower eyelid, and the eyelash.
To deal with this problem, the HSV color model is used to extract the desired object with a pre-de- fined color space value. The HSV color model is an alternative representation of the RGB color model, where H, S, V represent hue, saturation, and value respectively. Owing to its capability of sepa- rating the brightness from the chromaticity, it has been widely used in image classification[8-10], and image segmentation[11-13] as it can detect a target object with a certain color. The HSV color model in this work is used as a supplement binarization method that focuses on extracting the iris region.
3. METHOD
3.1 Overview of the proposed method
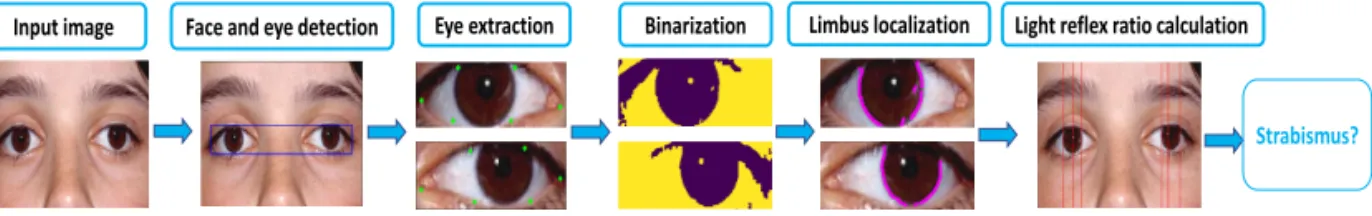
The screening of strabismus in digital images depends on the precise location of reflective points and the limbus. Therefore, the proposed method was organized into 5 steps to complete the proce- dure of strabismus screening, which is shown in Fig. 2. The input is a digital image that has a reso- lution of 1920x1280. The image first goes through the face detection model and the facial landmark detector to obtain the eye region landmarks, and
Face and eye detection Eye extraction
Input image Binarization Limbus localization Light reflex ratio calculation
Strabismus?
Fig. 2. Overview of the proposed method.
then the left and right eye are extracted based on its landmarks. Binarization is applied to the ex- tracted eye images to eliminate the influence fac- tors while maintaining the iris region. With the processed images, the method calculates the center coordinates of the reflective points and samples the data points that lie in the limbus to estimate the center of the iris, which can be used to obtain the coordinates of the limbus. Finally, the CLR ratio for strabismus screening is calculated according to the coordinates of the limbus and the reflective point center.
3.2 Face and eye detection
At the preliminary stage of the proposed method, a facial image was sent to the face detection model.
To reduce the memory occupation for face de- tection, the image was resized to its half size, namely 860×640. If a face can be detected within the image, the model returns the coordinate of a rectangular bounding box that enclosed the facial part within the image. With the coordinates of the detected facial part, the facial landmark detector is applied to estimate the location of 68 coordinates that match the facial structures on the detected face. For positioning the eye, we only utilize the indexes from 37 to 48 in this study.
3.2 Eye extraction
As shown in Fig. 1, the index array for the right eye region is from 37 to 42, and 43 to 48 for the left eye region. To extract the eye region from the image, we utilize the coordinates of these land- marks. For the extraction of the right eye region, the width value of the index 37 and the height value
of the index 38 are used as the beginning coor- dinate, the width value of the index 40 and the height value of 41 are used as the ending coordinate.
With the similar operation above, the left eye re- gion can also be extracted. However, the detector may not accurately locate the facial landmarks for the eye region, which affects the extraction of the complete eye region. To tackle this problem, we add a parameter that enlarges the size of the ex- tracted eye region image. In other words, the pa- rameter simultaneously increase the height and width of the image to ensure a complete eye region can be included, which is shown in the eye ex- traction block in Fig. 2.
3.2 Binarization
If the eye regions are obtained, the method im- plements Otsu's binarization and HSV color model to remove the objects that affect the acquisition of the iris center. First, the eye region images are fil- tered with a 5×5 Gaussian kernel to remove the noises that exist in the image. Then, the next step is to convert the eye region image into grayscale and apply binary thresholding to remove the skin and sclera (the white part around the iris), so that only the iris region remains. However, since the images have different illumination, a fixed thresh- old value cannot meet the requirement of iris ex- traction. Thus, we utilize Otsu's binarization to automatically determine the threshold value. With the optimal threshold value determined by Otsu's binarization, the pixel values smaller than the de- termined threshold value are set to 0 (black) and the pixel values bigger than the threshold value are set to 255 (white). Despite Otsu's binarization can
(a) (b)
(c) (d)
(e) (f)
Fig. 3. Image processing for the eye region image, where (a) and (b) are the result of Otsu's binarization, (c) and (d) are the results of the HSV color model, and (e) and (f) are the results of the combination of two methods.
Fig. 4. Visualizing the sampled coordinates on the limbus, where the pink dots are the coordinate points.
remove most of the background of the eye region, but some black backgrounds (i,e., the shadow gen- erated by the eyelid) are remained and affect the result of iris extraction. Due to the pixels of the shadow is easily affected by the illumination, its pixels' value is bigger than the value of the iris.
Thus, the proposed method further converts the eye region image from the RGB color model to the HSV color model by setting the array of the upper bound color and lower bound color, which is con- sists of the value of 3 channels. The arrays aim to keep the object if the pixel value of the object falls within the pre-defined upper and lower bound, otherwise remove. The HSV-type image may con- tain less shadow than the binarization image, but it may be susceptible to the pre-defined color value.
From this point of view, the direct use of the HSV- type image may cause pixel loss inside the iris.
Therefore, we combine the binarization image and HSV-type image to form a new image with fewer shadows while maintaining the iris region, which is shown in Fig. 3.
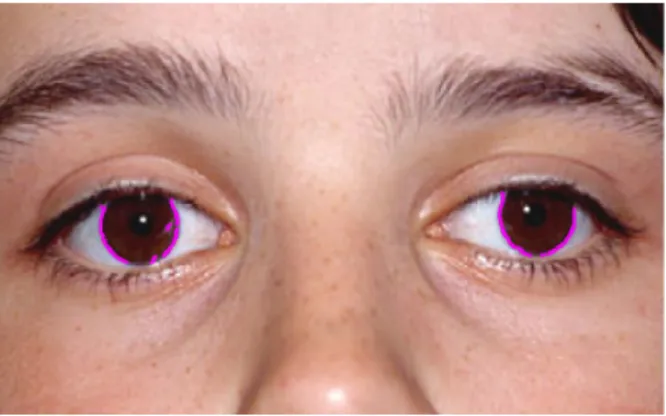
3.4 Limbus localization
The limbus is the boundary of the cornea and the sclera. To determine the right and left edges from the limbus coordinates, our method utilizes
the center coordinate and radius of the iris that can be obtained by the LSM. Firstly, since the iris usu- ally locates at the center of the extracted eye region image, we assume the coordinate of this center is within the iris region. If the pixel value of the coor- dinate is 0, which indicates that the assumed point is not within the iris region. Then, we use the height value of the assumed point to search for the iris region along the width of the image until the width value has the pixel value of 255. Secondly, the method uses the coordinate obtained in the first step to searches for the maximum height value (bottom) of the iris region by comparing the coor- dinate whose pixel value is 255. It is noted that the coordinates that lie on the limbus are the last coor- dinates with the pixel value of 255. Using this property, the method can sample the coordinates located at the limbus from the coordinates obtained in the second step. Fig 4 visualizes the result of the sampled coordinates.
To determine the right and left edge of the iris for both eyes, one simple idea is to compare all the width values of the sampled coordinates. However, the coordinates sampled from the limbus may not be perfectly accurate, which affects the determi- nation of the right and left edges of the iris. Thus, we employed the LSM to approximate the coor- dinates with a circle, which aims to estimate the center of the iris by minimizing the mean square geometric distance from the circle to the coor-
Fig. 5. Visualizing the estimated iris center, where the red dots represent the iris center.
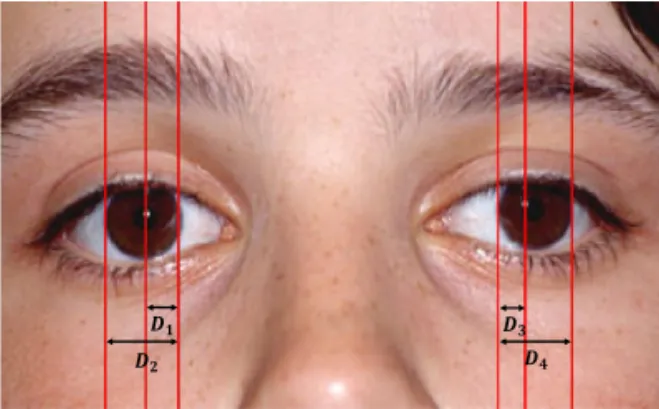
Fig. 6. Horizontal distance measurements from the image.
Table 1. Normal and abnormal ranges of CLR ratio[15].
Parameter Measurement
Normal range 0.448-0.488 Abnormal range <0.440, >0.497 dinates. We define the above problem following
[14]:
min (1)
whereis the total number of coordinates, is the coordinate of theith coordinate, is the center of the circle, andis its radius. Since
is not known in advance, it is set as the mean of the coordinates. Fig. 5 shows the result of iris cen- ter estimation.
Having the coordinates of the iris center, the left and right edges of the irises of the two eyes can be determined. That is, the edges of the iris can be calculated by adding or subtracting the radius of the circle from the coordinates of the iris center.
3.5 Corneal light reflex ratio calculation In the final stage of the method, the coordinate of the reflective light points is estimated and used to calculate the CLR ratio. To obtain the coor- dinates from the image, we extract the iris region image based on the coordinate of the iris center and convert it to grayscale. The next step is to ap- ply Otsu's binarization method to the grayscale and store all the coordinates of the reflective light points. Using these coordinates, we can obtain the center coordinate of the reflective light points by calculating their average value. After the coor- dinates of the iris edges and the reflective light
point center are obtained, we use them to calculate 2 horizontal distances for each eye, which is shown in Fig. 6.
To compute the CLR ratio for strabismus scre- ening, we follow the formula from [15]:
(2) With the computed value, the method takes it to compare with the reference table of CLR ratio, as shown in Table 1, to determine whether the pa- tient is suffering from strabismus. If the computed value falls within the normal range, it means that the patient's eyes are normal; otherwise, if the val- ue falls within the abnormal range, it is considered that the patient has strabismus.
4. EXPERIMENTAL RESULTS
In this study, 20 images (10 normal eyes, 10 stra- bismus) were used to test the proposed method.
The images were provided from Kosin University Gospel Hospital and labeled by an ophthalmologist.
All the images have a resolution of 1920x1280. The method was implemented with an eight-core AMD Ryzen 7 2700 CPU and was based on python
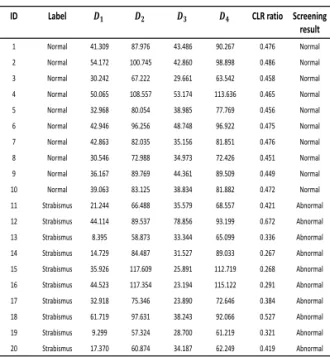
Table 2. Measurement of CLR ratio for 20 images.
ID Label CLR ratio Screening
result
1 Normal 41.309 87.976 43.486 90.267 0.476 Normal
2 Normal 54.172 100.745 42.860 98.898 0.486 Normal
3 Normal 30.242 67.222 29.661 63.542 0.458 Normal
4 Normal 50.065 108.557 53.174 113.636 0.465 Normal
5 Normal 32.968 80.054 38.985 77.769 0.456 Normal
6 Normal 42.946 96.256 48.748 96.922 0.475 Normal
7 Normal 42.863 82.035 35.156 81.851 0.476 Normal
8 Normal 30.546 72.988 34.973 72.426 0.451 Normal
9 Normal 36.167 89.769 44.361 89.509 0.449 Normal
10 Normal 39.063 83.125 38.834 81.882 0.472 Normal
11 Strabismus 21.244 66.488 35.579 68.557 0.421 Abnormal
12 Strabismus 44.114 89.537 78.856 93.199 0.672 Abnormal
13 Strabismus 8.395 58.873 33.344 65.099 0.336 Abnormal
14 Strabismus 14.729 84.487 31.527 89.033 0.267 Abnormal
15 Strabismus 35.926 117.609 25.891 112.719 0.268 Abnormal
16 Strabismus 44.523 117.354 23.194 115.122 0.291 Abnormal
17 Strabismus 32.918 75.346 23.890 72.646 0.384 Abnormal
18 Strabismus 61.719 97.631 38.243 92.066 0.527 Abnormal
19 Strabismus 9.299 57.324 28.700 61.219 0.321 Abnormal
20 Strabismus 17.370 60.874 34.187 62.249 0.419 Abnormal
(version 3.7.9) and OpenCV (version 3.4.2). We set the parameter that enlarges the size of the ex- tracted eye region as 10, which means that the height and width of the eye region extracted from the landmarks will be simultaneously increased by 10-pixel units. For the HSV color model, we set the upper bound color as [180, 255, 49] and the low- er bound color as [0, 0, 0], which aim to remove the shadows. The result of the measured CLR ratio of the images is shown in Table 2.
From Table 2, we can see that the CLR ratio of the normal image falls within the range of 448 to 488, while the ratio of the strabismus image falls within the range of <0.440 and > 0.497, indicating the effectiveness of the proposed method. In addi- tion, we observe that the estimated distances
and have very similar values, and the error be- tween them may likely be caused by the approx- imation of the sampling points during iris extraction.
In the measurements of the Normal images, the difference between and is caused by the lo- calization of the reflective point center. For exam- ple, and on the image of ID 6 have almost equal estimates and and are also supposed to be similar. However, since the center of the re-
flection point is estimated from the average of all reflected points, the approximation error for each iris will lead to the difference between and . In the results of strabismus images, since there are two types of strabismus, exotropia (eyes deviate outward) and esotropia (eyes turn inward), the es- timated CLR ratio fall within the range of >0.497 and <0.440.
Despite the success of the proposed method, there are still some limitations are required further improvement. 1) Due to the HSV color model re- quires pre-defined upper and lower bound color to extract the desired color, it may fail when the iris color is different from the pre-defined color value.
2) The estimate of the reflective point center has a big impact on the measurement of CLR ratio.
From this point of view, a much more stable and accurate binarization method is required to locate the reflective point center.
5. CONCLUSIONS
In this study, in order to provide strabismus screening for patients who cannot visit hospitals in remote areas, we propose an automatic stra- bismus screening method that compares CLR on both eyes in a facial image. The method employed a face detection model, facial landmark detector, automatic binarization, and the least square method to locate the coordinates of the iris edges and the reflective point center. These estimated coor- dinates are used to compute CLR ratio for de- termining whether a patient is suffering strabismus.
The experimental results with several images demonstrate the effectiveness of the proposed method.
REFERENCE
[ 1 ] B.G. Mohney, “Common forms of childhood esotropia,”Ophthalmology, Vol. 108, No. 4, pp.
805-809, 2001.
[ 2 ] S.P. Donahue, C.N. Baker, and Committee on
Practice and Ambulatory Medicine, “Procedu- res for the Evaluation of the Visual System by Pediatricians,”Pediatrics, Vol. 137, No. 1, pp. 2015-3597, 2016.
[ 3 ] A.C. Tongue and G.W. Cibis, “Bruckner test,”
Ophthalmology, Vol, 88, No. 10, pp. 1041-1044, 1981.
[ 4 ] D.E. King, “Max-Margin Object Detection,”
arXiv:1502.00046, 2015.
[ 5 ] V. Kazemi and J. Sullivan, “One Millisecond Face Alignment with an Ensemble of Regres- sion Trees,” P roceedings of IEEE Confer- ence on Computer Vision and Pattern Re- cognition, pp. 1867-1874, 2014.
[ 6 ] C. Sagonasa, E. Antonakosa, G. Tzimiropou- losb, S. Zafeirioua, and M. Pantic, “300 Faces In-The-Wild Challenge: database and re- sults,”Image and Vision Computing, Vol. 47, pp. 3-18, 2016.
[ 7 ] N. Otsu, “A Threshold Selection Method from Gray-level Histograms,” IEEE Transactions on Systems, Man, and Cybernetics, Vol. 9, No. 1, pp. 62–66, 1979.
[ 8 ] O.R. Indriani, E.J. Kusuma, C.A. Sari, E.H.
Rachmawanto, and D.R.I.M. Setiadi, “Toma- toes Classification using K-NN based on GLCM and HSV Color Space,” Proceedings of International Conference on Innovative and Creative Information Technology, pp. 1-6, 2017.
[ 9 ] H. Razalli, R. Ramli, and M.H. Alkawaz,
“Emergency Vehicle Recognition and Classi- fication Method Using HSV Color Segmenta-
tion,” P roceedings of IEEE International Colloquium on Signal Processing & Its Applications, pp. 284-289, 2020.
[10] Y.A. Gerhana, W.B. Zulfikar, A.H. Ramdani and M.A. Ramdhani, “Implementation of Nearest Neighbor using HSV to Identify Skin Disease,” Proceedings of the 2nd Annual Applied Science and Engineering Confer- ence, pp. 1-5, 2017.
[11] S. Sural, G. Qian, and S. Pramanik, “Segmen- tation and Histogram Generation using the HSV Color Space for Image Retrieval,”Pro- ceedings of IEEE International Conference on Image P rocessing, pp. 589-592, 2002.
[12] E. Prasetyo, R.D. Adityo, N. Suciati and C.
Fatichah, “Mango Leaf Image Segmentation on HSV and YCbCr Color Spaces using Otsu Thresholding,” Proceedings of International Conference on Science and Technology- Computer, pp. 99–103, 2017.
[13] N.R. Choi and S.I. Choi, “Preprocessing Tech- nique for Lane Detection Using Image Clus- tering and HSV Color Model,” J ournal of Korea Multimedia Society, Vol. 20, No. 2, pp.
144-152, 2017.
[14] N. Chernov and C. Lesort, “Least Squares Fitting of Circles and Lines,”Computer Vision and Pattern Recognition, 2003.
[15] S. Duangsang and S. Tengtrisorn, “The Central Corneal Light Reflex Ratio from Photographs derived from a Digital Camera in Young Adults,” J ournal of the Medical Association of Thailand, Vol. 95 No. 5, pp. 699-703, 2012.
Xi-Lang Huang
He received the M.S. degree in electrical engineering from the Pusan National University, Busan, South Korea, in 2018. He is currently pursuing the Ph.D.
degree in electrical engineering with the Pukyong National University, Busan, South Korea. His current research interests include modeling and simulation of dis- crete-event systems, efficient simulation optimization, and computer vision.
Chang Zoo Kim
He received the M.D. and M.S.
degrees from the Kosin University College of Medicine, Busan, South Korea, in 2011 and 2019, respectively. In 2017. he become an Ophthalmologist, and specialized in Strabismus and Pediatric Ophthalmology in 2018. In 2019, he joined the Department of Ophthalmology, Kosin University College of Medicine, as an Assistant Professor. His current research interests include medical devices based on artificial intelligence and strabismus.
Seon Han Choi
He received the B.S., M.S., and Ph.D. degrees in electrical en- gineering from the Korea Advanced Institute of Science and Technology (KAIST), Daejeon, South Korea, in 2012, 2014, and 2018, respectively. He was a Teaching Assistant for computer programming with the School of Electrical Engineering, from 2013 to 2017. In 2018, he was a Post-Doctoral Researcher with the Information and Electronics Research Institute, KAIST. From 2018 to 2019, he was a Senior Researcher with the Korea Institute of Industrial Technology. In 2019, he joined the Department of IT Convergence and Application Engineering, Pukyong National University, Busan, South Korea, as an Assistant Professor. His current research interests in- clude the modeling and simulation of discrete-event systems, efficient simulation optimization under sto- chastic noise, evolutionary computing, and machine learning.