Effect of Mixing Method on Mechanical Properties of Fiber Reinforced Concrete
7
0
0
전체 글
(2)
(3)
(4)
(5)
(6)
(7)
수치
관련 문서
In order to evaluate mechanical properties and carbonation resistance of concrete with water-soluble sulfur, compressive strength test, flexural strength test, bonding strength
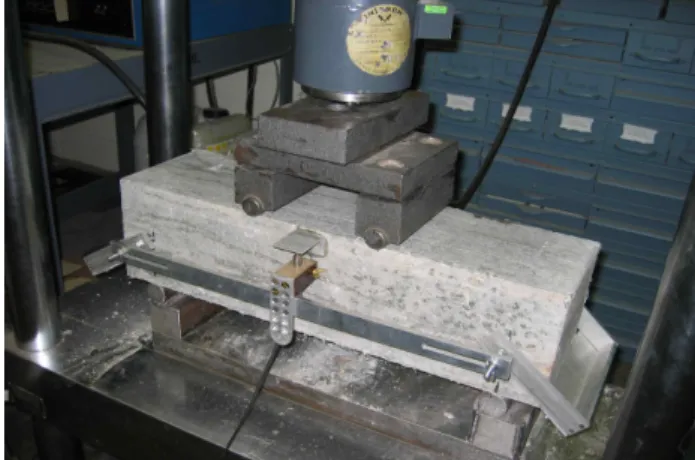
Soroushian and Bayasi ( 1991 ) experimentally investigated the effect of steel fiber shape on the mechanical properties of concrete, and found that the use of hooked steel fibers
Soroushian and Bayasi ( 1991 ) experimentally investigated the effect of steel fiber shape on the mechanical properties of concrete, and found that the use of hooked steel fibers
Engineering properties of permeable polymer concrete for pavement using powdered waste glass and recycled coarse aggregate, Journal of the Korean Society of Agricultural
Keywords : high fluidity concrete, waste marble powder, slump flow, flow ability, filling ability, compressive strength.. 이러한 단위시멘트량의 증가는 수화열 발생과
To evaluate the mechanical properties and carbonation resistance of concrete, slump, air amount, air-dried unit volume weight, compressive strength, and carbonation depth are
In this study, mechanical properties and structural flexure behavior experiments of slag, recycled PET fiber, and Hwang-toh added concrete are carried out...
To evaluate the reinforcement effect of RPET fiber in concrete member, experimental tests were performed, such as mechanical property tests (compressive strength,
