한국정보통신학회논문지 Vol. 25, No. 6: 766~773, Jun. 2021
SVM 모델 기반 가용성 예측 기능을 가진 야외마루 관리 서비스 구현 및 성능 평가
리자얀티 리타1·황민태2*
Implementation and Performance Evaluation of Pavilion Management Service including Availability Prediction based on SVM Model
Rita Rijayanti1 · Mintae Hwang2*
1Ph.D. Student, Department of Information &Communication Engineering, Changwon National University, Changwon, 51140 Korea
2*Professor, Department of Information & Communication Engineering, Changwon National University, Changwon, 51140 Korea
요 약
본 논문은 숲속 야외 마루의 실시간 이용 현황을 제공할 뿐만 아니라 기계학습을 통한 예측 서비스를 제공하는 야외 마루 관리 서비스의 구현 및 성능 평가 결과를 담고있다. 개발한 하드웨어 프로토타입은 모션 감지 센서를 이용해 야외 마루의 점유 여부를 감지한 후 위치 정보, 날짜 및 시간, 온도 및 습도 데이터와 함께 클라우드 기반 데이터베이스로 전 달한다. 수집된 야외 마루의 실시간 이용 현황은 이용자들에게 모바일 애플리케이션을 통해 제공된다. 성능 평가 결과 하드웨어 모듈에서부터 모바일 애플리케이션까지 평균 1.9초의 응답 시간을 보여주었으며, 정확도는 99%를 보여주 고 있음을 확인하였다. 아울러 수집 데이터에다 기계학습 기반의 SVM(Support Vector Model) 모델을 적용한 야외 마 루의 가용성 예측 서비스를 구현하고서 이를 모바일 및 웹 애플리케이션을 통해 제공할 수 있도록 하였다.
ABSTRACT
This paper presents an implementation result and performance evaluation of pavilion management services that does not only provide real-time status of the pavilion in the forest but also prediction services through machine learning. The developed hardware prototype detects whether the pavilion is occupied using a motion detection sensor and then sends it to a cloud database along with location information, date and time, temperature, and humidity data. The real-time usage status of the collected data is provided to the user's mobile application. The performance evaluation confirms that the average response time from the hardware module to the applications was 1.9 seconds. The accuracy was 99%. In addition, we implemented a pavilion availability prediction service that applied a machine learning-based SVM (Support Vector Model) model to collected data and provided it through mobile and web applications.
키워드 : 야외 마루, 실시간 점유 현황, 가용성 예측, 모바일 및 웹 애플리케이션, SVM 모델
Key word : Pavilion, Real-time occupation status, Availability prediction, Mobile and web application, SVM(Support Vector Machine) model
Received 18 March 2021, Revised 3 April 2021, Accepted 18 April 2021
* Corresponding Author Mintae Hwang (E-mail:[email protected], Tel:+82-55-213-3832)
Professor, Department of Information & Computer Engineering, Changwon National University, Changwon, 51140 Korea
Open Access http://doi.org/10.6109/jkiice.2021.25.6.766 print ISSN: 2234-4772 online ISSN: 2288-4165
Ⅰ. Introduction
Public service facilities are one of the things that the government must consider because it involves local citizens' convenience. And also, it is one of the core workings of urban planning. The government must know the condition of each location of its public facilities to assist in making service targets to the community. Good management of public facilities brings the citizens a convenient and high-speed management mode, which transfers information such as the use of the situation and the loss situation of the public facilities connected to the internet clearly to the receiver of administrator and effective help and efficiency [1]. Others think why public services information is important because not all people are in health condition and have a good condition, so we need some technology to provide for all states; one solution is to provide updated information to the public [2]-[3].
In this study, we propose a system that can give information about the pavilion's availability in the forest, using a hardware module to detect the pavilion condition and design the mobile application for the citizen's side and web application for the government side. The prediction feature is also provided to increase citizens convenience and satisfaction. This service can help a citizen who needs information about the availability of the pavilion before leaving to the forest to enjoy nature with friends or family and help the government make better public service facilities.
We investigate pavilion in the forest and citizen needs by employing various technologies and devices. We create a system that can determine the number of available pavilion in the forest. The system can also determine prediction and statistical data. We used the Arduino installed with a PIR (Passive Infrared) motion sensor to detect an object's movement in the pavilion and LTE for connection. The information was shared in real-time with drivers by storing it in the cloud database.
On the citizen side, the mobile application provides the citizen with prediction condition, and for the government
side, the web application provides statistical data. The information flows from the hardware module to the cloud database and finally to the mobile and web application interface.
The remainder of this paper is organized as follows.
In section II, we discuss the related existing works.
Section III illustrates the system model. Section IV describes the system. Section V illustrates the prediction concept of the proposed method. Section VI illustrates the performance of the proposed method. Section VII presents the conclusions.
Ⅱ. Related Works
A previous study [4] deployed a public facilities search using augmented reality technology for a citizen.
They utilize a mobile device such as data connection, GPS, geomagnetic or digital compass, and accelerometer, and perform directly using mobile user device in the direction they want. For calculating the distance, the sensor's value and they using their own formula namely haversine formula. The application will be displayed in the icon of public facilities that combine with a real image from the camera in a mobile phone. So the citizen can know all the locations of a public facility easily. In [5], deployed a bus stop that displays the bus's current position using a tablet terminal to eliminate the bunder, such as where and availability of the bus best on the bus status. This by using IoT technology with several sensors to implement. They focused on making convenient technology, especially an elder who has difficulties using a technology such as mobile phone or tablet, so they were using LAD to indicate the current bust position's location. In [6], Develop smart parking sensors based on real-time data related to a mobile application to maximize the productivity and reliability of urban infrastructure for limited parking areas more satisfying.
Citizens can know the location of an available parking lot at the current time using their mobile phones. A prediction mechanism was also provided for the parking
occupancy rate using three feature sets with a selected parameter to illustrate this feature's utility. This system supports the government in public facilities services, especially public safety, transport logistic, and environment management. In [7], Developing a framework of the Public Information Platform for Smart City (PIPSC/CMF), they focus on technology for indoor and outdoor integrated data management, 3D reconstructor and dynamic simulation emergency, indoor-outdoor integrated positioning, and indoor-outdoor integrated spatial analysis.
This study is an extension of previous studies [8]. In [8], introduce a concept of the system's functionality, communication structure between hardware, cloud database, the user interface to providing real-time information about the availability of pavilions in a forest.
The proposed system is to develop an intelligent forest pavilion management system. Develop the system with appropriate tools to implementing mobile and website applications with full function, prediction, and performance evaluation using Super Vector Machine (SVM) method.
Ⅲ. Architecture of the Proposed System
3.1. The architecture of the System
This section describes the architecture of the proposed system. The pavilion with the hardware module records the movement of people inside the pavilion. The server responds to a request and saves the data. The citizen is provided a mobile application to check pavilion availability in the forests and predict conditions per day.
With a web application, the government can get information about pavilions' conditions on the forest in the form of statistics in the forest per day. Fig. 1 illustrates the architecture of the system.
Fig. 1 The architecture of the proposed system
3.2. Requirement of The System
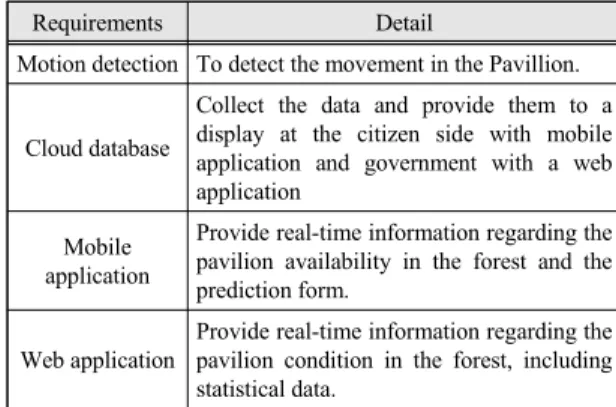
Table 1 lists the detailed requirements of the system for object detection and at the server and user sides.
Table. 1 Basic requirements of the system
Requirements Detail
Motion detection To detect the movement in the Pavillion.
Cloud database
Collect the data and provide them to a display at the citizen side with mobile application and government with a web application
Mobile application
Provide real-time information regarding the pavilion availability in the forest and the prediction form.
Web application
Provide real-time information regarding the pavilion condition in the forest, including statistical data.
Ⅳ. Implementation of The Proposed System
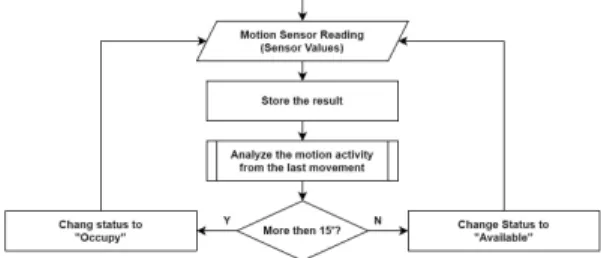
Fig. 2 illustrates a flowchart to maintain the status of the pavilion. First, the sensor will detect the mention of people then will store in the temporary database, and then the system will analyze the motion activity from the last movement. If the movement is more than 15 minutes, then the status will be changed to "Occupied,"
but if the movement lasts less than 15 minutes, then the status will be changed to "Available.".
The time of 15 minutes is just an assumption used to distinguish between the 'occupied' or 'available' status of
the pavilion. Because based on our observations, in general, people sit around the pavilion to rest and drink in less than 15 minutes, while those who occupy the pavilion to spend time chatting, eating, or enjoying nature with friends and family usually will take more than 15 minutes in the pavilion.
Fig. 2 Flowchart for update the status of a pavilion in the forest
The system configuration for implementation is divided into two categories: hardware and software side.
4.1. Hardware Configuration for Implementation The hardware configuration for detecting the movement will use a Raspberry PI installed with a PIR motion sensor to detect an object's movement in the pavilion and LTE to connect to the network. Fig 3 showing the hardware that was used to collect the data in this research.
Fig. 3 PIR sensor and raspberry PI and LTE
4.2. Software Configuration for Implementation Mobile application's function is to display information about pavilion availability in the forest at certain times on the citizen's mobile phone. Fig. 4 shows the mobile application interface where it has two main pages for showing the selected location and displayed information about the forest's pavilion availability status for the citizen side.
1) Searching the location page: This page's main function is to search for the forest location that has a pavilion. And it shows all names of forests that we already add before. Once the location is selected, the information about the pavilion is displayed in detail.
2) Pavilion Information page: This page will show the availability of the pavilion in real-time. Information, such as the forest name, number of the pavilion, number of the available pavilion, and prediction result, will be displayed on this page.
Fig. 4 Mobile application for citizen
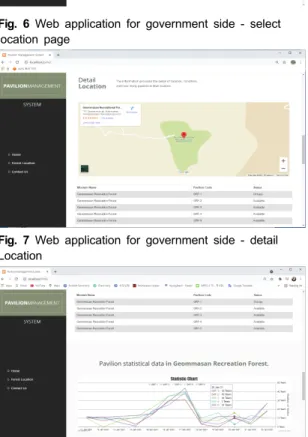
The Web application functions to display information about the status and condition of the pavilion in the forest at certain times and statistical data on conditions from day by day. This will significantly help the government monitor municipal facility services to decide whether to add or remove pavilions in a particular place – Fig. 5 shows the web application's home page.
Fig. 6 shows all the forest locations that we added to the previous database. The main function of this page is to locate a forest that has a pavilion. Once a location is selected, information about the pavilion is displayed in detail. Furthermore, Fig. 7 shows a map of the forest location based on the citizen's selected location. This page will show the availability of the pavilion in real-time. Information, such as a map of the forest, the forest name, number of the pavilion, number of the available pavilion, and statistic result, will be displayed on this page.
Fig. 5 Web application for government side - home page
Fig. 6 Web application for government side - select location page
Fig. 7 Web application for government side - detail Location
Fig. 8 Web application for government side - statistic graph
In general, the statistical objective here is to evaluate the existing conditions of using pavilions in the forest to improve the quality of public facilities services for the citizen. The statistical results are presented in graphical form with information such as how often people use the pavilion facilities in the forest, when people generally go to the forest and using the pavilion, and which pavilion is used most often in a certain area. This information can help the government decide whether it is necessary to increase the number of pavilions in the forest or even reduce it. Fig. 8 illustrates the statistical data intended for the government.
Ⅴ. Prediction Method
Classification Algorithms Techniques is one of the algorithms used to map the data for classification.
Classification is defined as “Determining the class of a given data record by applying a classification model”.
There are two types of performing classification:
supervised learning and unsupervised learning. Because we have a known and clear objective to predict future demand, we chose the supervised classification algorithm to build the model using historical data. There is several algorithm namely the Decision Tree (DT) [8]-[9], Support Vector Machine (SVM) [10], K-Nearest- neighbor (KNN) [11]-[12] and Naïve Bayes (NB) [13]-[14]. The SVM mining technique was chosen for this study based on the advantages of SVM compared to other algorithms, such as Decision tree, KNN, and Naive Bayes, where SVM classifies with minimal variable variations and creates hyperplanes in high dimensional space that are not obtained from other algorithms.
Accordingly, using SVM will produce relevant results for this study, which requires the separation of two classes in the input space for the prediction process with a minimum variable.
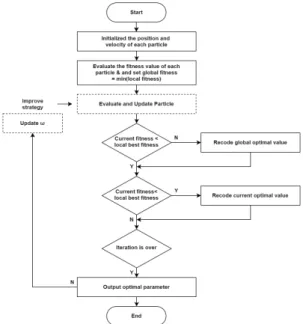
Following is an SVM algorithm of the system. Firstly, it analyzes the actual data and establishes an evaluation index model to influence the utilization performance
index. Then establishes a performance index prediction model and adopts the method to fit model parameters to obtain the optimum fitting parameters. The process of a parameter optimization algorithm can be described in fig. 9.
Fig. 9 Flowchart of SVM algorithm for the system
The data come from the testing process that we were implementing in laboratories from 1st to 20 January. The program is given on a scale of 20. The maximum iteration is 400, particle vector dimension 3, acceleration 2, punishment parameter C in [1, 150]. The value of range ɛ is [0, 0.3]. The kernel parameter is in [0, 1.5], and the vector's maximum speed is (10, 0.0, 0.5). The
actual value and all predicted samples are shown in fig.
10. The maximum relative error is 10.63%. The prediction error curve is shown in Fig. 11. In the result, we can see the average relative error and average absolute error.
Ⅵ. System Performance
To evaluate the system, we conducted several tests to determine whether the system can be run as expected by creating several scenarios to evaluate its performance.
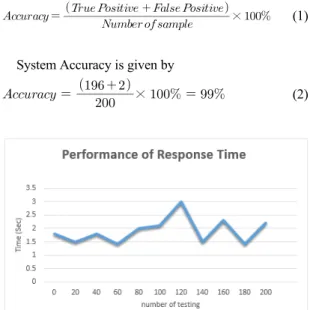
As for the trial, we conducted 200 experiments to check whether the hardware module can detect the movement and whether the server can receive data. This experiment is intended to determine the accuracy of the proposed system. For the simulation phase, we used two parameters: accuracy and response time when sending and receiving data and set that the activity time is 1 minute, where one minute is only used for the testing process in order to generate much data in a shorter time during the testing phase. To ensure the performance of this system is considered good or not. This study focuses on the connection between hardware module and database, such as whether the developed hardware module can detect movement correctly, the algorithms made for state changes sent from the hardware module to the database are appropriate or not. Whether the response time between the hardware module and the database run smoothly in real time. If the movement is still detected in one minute, the status will change to Fig. 10 Curves of prediction value and actual value
Fig. 11 Prediction error curve
occupy; else, status is available. Fig. 12 illustrates the results of the performance of response time. The response time of the system 1.9s, with an accuracy of 99%. To evaluate the system's accuracy, we used True positive value and False Positive value based on the SVM model. The accuracy formula is expressed as follows [15]:
× (1)
System Accuracy is given by
× (2)
Fig. 12 Performance evaluation of response time between hardware module and database
Ⅶ. Conclusion
In this study, we created a system providing real-time information about the availability of pavilions in the forest to determine the number of available pavilions in the forest using a sensor to detect motion in the pavilion and showing in the user interface. For the movement time, we assume after 15 minutes, but for the testing phase, we set it as one minute, if it still detects the movement, then the pavilion's status will be changed to
"Occupied" else "Available," and it will be connected to the cloud database.
We use the SVM model for prediction and evaluation performance. Firstly, it analyzes the actual data, such as
the evaluation index model, to influence the utilization performance index. Then establishes a performance index prediction model and adopts the method to fit model parameters to obtain the optimum fitting parameters. Our system archived an accuracy of 99%
with an average response time of 1.9s. The result is shown in a Mobile application that provides a prediction function at the citizen's interface to help the citizens decide whether they come to the forest or not after knowing the real-time condition. Web applications for government interfaces can help them maintain a policy based on the statistical data to make better public service facilities.
The challenge in this system is how to protect the hardware module from heat, rain, and people touching the hardware module. Since it can make the hardware unstable, we have to use tools to handle this problem to work stably when we implement in a real environment.
Another challenge is electricity supply, where the pavilion is located in a forest and far from a power source. The real implementation would require a solar battery or power bank to generate electrical power to make the hardware module run well. Furthermore, to ensure the application's performance, We can do it after the application is already distributed to a real user to check the reliability of the application based on input from users.
REFERENCES
[ 1 ] L. Zhongxian and H. Guili, “Information Management System of Public Facilities based on Internet of Things Technology,” in Proceeding of International Conference on Smart City and Systems Engineering, China: Hunan, pp. 6-8, 2016.
[ 2 ] Q. Adrianus, G. Guarddin, and H. Santoso, “Developing Interaction Design to Provide Public Facilities Information for Person with Disabilities,” in Proceeding of 2019 International Conference on Advanced Computer Science and information Systems (ICACSIS), Indonesia: Bali, pp.
27-32, 2019.
[ 3 ] F. Khalique, S. Khan, and I. Nosheen “A Framework for Public Health Monitoring Analytic and Research,” Journal of IEEE Access, vol. 7, no. 1, pp. 101309-101329, 2019.
[ 4 ] G. S. Budhi and R. Adipratama, “Public facilities location search with argument reality technology in Android,” in Proceeding of International Conference on Information, Communication Technology and System (ICTS), Indonesia:
Surabaya, pp. 195-198, 2016.
[ 5 ] C. Watanabe, S. Ishikawa, H. Yabe, and M. S. Tanaka, “A study of Bus Stop that Display the Current Location of the Buss to Increase User Convenience,” in Proceeding of 2020 IEEE 9th Global Conference on Customer Electronic, Japan: Kobe, pp. 268-269, 2020.
[ 6 ] Y. Zheng, S. Rajasegarar, and C. Leckie, “Parking availability prediction for sensor-enabled car parking smart cities,” in Proceeding 2015 IEEE Tenth International Conference on Intelligent Sensor, Sensor Network and Information Processing (ISSNIP), Singapore: Singapore, pp.
1-6, 2015.
[ 7 ] A Dive Into Decision Trees [Internet]. Available: https://
towardsdatascience.com/a-dive-into-decision-trees-a12892 3c9298.
[ 8 ] R. Rijayanti and M. Hwang, “Availability Information Service of Pavilions in the Forest,” in Proceeding of The 13th International Conference on Future Information &
Communication Engineering(ICFICE2020), Korea, pp. 37-41, 2021.
[ 9 ] Decision Trees [Internet]. Available: https://corporatefinan ceinstitute.com/resources/knowledge/other/decision-tree/.
[10] Support Vector Machine [Internet]. Available: https://ai- summary.com/summary-support-vector-machine-0cb43bb5/.
[11] Machine Learning Basics with the K-Nearest Neighbors Algorithm [Internet]. Available: https://towardsdatascience.
com/machine-learning-basics-with-the-k-nearest-neighbors -algorithm-6a6e71d01761.
[12] P. Cunningham and S. Delany, K-Nearest Neighbour Classifiers.: 2nd Edition (with Python examples), 2nd ed.
New York, NY: New York, 2020.
[13] A short tutorial on Naive Bayesian Classification with implementation [Internet]. Available: https://towardsdata science.com/a-short-tutorial-on-naive-bayes-classification- with-implementation-2f69183d8ce1.
[14] C. Pawel, Data Mining Algorithms: Explained Using R, 1th ed, United Kingdom, UK: West Sussex, 2015.
[15] A. Pedraza, G. Bueno, O. Deniz, G. Cristóbal, S. Blanco, and M. Borrego-Ramos, “Automated diatom classification (Part B): A deep learning approach,” Applied Sciences, vol.
7, no. 5, pp. 1-25, 2017.
리자얀티 리타(Rita Rijayanti)
2007 빠순단대학교 정보기술공학과 공학사 2015 랑랑부아나대학교 정보기술공학과 공학석사 2019 ~ 현재 창원대학교 정보통신공학과 박사과정
※ 관심분야 : IT 보안, 웹 기반 애플리케이션, 기계 학습, 스마트 제조
황민태(Mintae Hwang)
1990 부산대학교 컴퓨터공학과 공학사 1992 부산대학교 컴퓨터공학과 공학석사 1996 부산대학교 컴퓨터공학과 공학박사
1996 ~ 1999 한국전자통신연구원 표준연구센터 선임연구원 1999 ~ 2000 인제대학교 정보컴퓨터공학부 교수 2000 ~ 현재 창원대학교 정보통신공학과 교수
※ 관심분야 : 통신 프로토콜, 데이터베이스 설계, 사물인터넷 응용, 기계학습, 스마트시티