Vol. 14, No. 3, pp. 15~20 (2018) https://doi.org/10.17664/ksgee.2018.14.3.015
시설원예용 난방온실의 온열환경 분석에 관한 연구
송 뢰·박윤철*†
제주대학교 일반대학원 기계공학과, *제주대학교 기계공학과
A Study on Thermal Environment Analysis of a Greenhouse
Lei Song and Youn Cheol Park*†
Department of Mechanical Engineering, Graduate School, Jeju National University, Jeju 63243, Korea
*Department of Mechanical Engineering, Jeju National University, Jeju 63243, Korea
Abstract
To study the effects of solar energy in a greenhouse, outdoor air temperature and wind speed on inside air temperature, a simulation model for forecasting the greenhouse air temperature was conducted on the basis of the energy and mass balance theory. Application of solar energy to the greenhouse is major area in the renewable energy research and development in order to save energy. Recently, considering the safety and efficiency of the heating of greenhouse, clean energy such as geothermal and solar energy has received much attention. The analysed greenhouse has 50㎡ of ground area which located in jocheon-ri of Jeju Province. Experiments were carried out to collect data to validate the model. The results showed that the simulated air temperature inside a plastic greenhouse agreed well with the measured data.
Key words: Greenhouse(온실), Solar irradiation(태양일사량), Heat transfer(열전달), Heating(난방)
기호 설명
A : Superficial area (m2)
C : Specific heat capacity (J/kgK) G : Mass velocity (kg/sm2) G' : Ventilation quantity (m2/s)
h : Convective heat transfer coefficient (W/m2K) K : Heat transfer coefficient (W/m2K)
Q : Heat transfer rate (W) r : Reflectivity
T : Temperature (K) t : Time (s) v : Velocity (m/s) V : Volume (m3)
그리스 문자
σ : Black body radiation constant (W/m2K4) ε : Surface emissivity
ρ : Density (kg/m3)
하첨자
a : Air
con : Convective heat transfer gro : Ground
†Corrresponding author
Tel: +82-64-754-3626, Fax: +82-64-756-3886 E-mail: [email protected]
접수일: 2018년 05월 02일
심사일: 1차:2018년 05월 17일, 2차:2018년 08월 03일 채택일: 2018년 08월 31일
lrad : Long-wave radiation rad : Radiation
s : Solar vent : Ventilation
1. 서 론
최근에 화석연료 자원의 고갈과 더불어 이산화탄 소 규제 및 배기가스 규제 등의 에너지 문제 해결 방 법이 관심사로 떠오르고 있다. 특히 환경오염 및 지 구 온난화 등 인류의 미래와 직접적인 결된 문제를 맞이하고 있다. 이런 환경문제를 해결하기 위한 여 러 방법 중 하나는 에너지를 효율적으로 이용하는 것이다[1].
태양 에너지는 여러 가지 신재생에너지 분야에서 가장 많이 이용되고 있는 분야이며, 태양광에 대비 하여 태양열의 이용은 제한적이나 식물의 성장을 위한 시설원예에서는 그 이용률이 높은 에너지원이 다. 태양 에너지는 식물의 광합성 작용을 촉진할 수 있을 뿐만 아니라, 추운 날씨에서도 온실 안에 식물 성장에 필요하고 따뜻한 온도를 제공할 수 있다[2].
한국 시설원예 농업은 급속히 발전하였으며, 최근 국민소득 향상에 따른 시설원예를 통하여 생산된 작물의 소비는 급속하게 증가하고 있는 실정이다 [3]. 2008년에 53,408 ha의 시설면적에 가온면적이 13,329 ha로써 약 25%를 차지하였으며, 2011년에는 기준 국내 시설원예 전체면적 52,393 ha 중 가온 면 적은 16,263 ha로 약 31%를 차지하여 시설면적의 감소에도 불구하고 가온면적이 차지하는 비중은 날 로 증가하고 있다[4, 5].
시설원예에 겨울철에는 난방용으로 태양열과 더 불어 히트펌프를 보조열원으로 사용함으로써 원예 시설의 난방, 냉방 및 제습 등의 다양한 환경관리에 적용 가능한 다목적 공조기기로써 국내의 경우 원 예시설용 히트펌프와 관련한 연구는 많이 수행되고 있다[6]. 최근에는 시스템의 안정성과 효율성을 높 이기 위하여 지열, 태양열 등을 이용한 하이브리드 시스템 이용 기술이 주목을 받고 있다[7].
유럽의 Pieters와 Deltour[8]은 온실의 구조가 태양 복사 에너지의 이용율에 어떠한 영향을 미칠 수 있 는지 조사를 하였다. 그들의 보고서에 따르면 온실 에 태양 에너지 이용 효율성이 온실의 형상 및 위치 에 달려 있으며, 평균적으로 온실은 태양 복사 에너
지의 70%를 포착하여 사용하고 있다고 보고하였다.
시설원예에 대한 수치 해석적 연구로써 Takakura [9]는 온실에 대한 동적모델링을 수행하여 밤에 온 실 내의 열운동을 묘사하고, 태양 복사로 가열된 지 붕을 통해 태양 열복사의 효과를 분석하였다. 또한 Zhihao et al.[10]은 모델링 중에 온실 내부 온도, 습 도와 젖은 잎사귀 사이의 열전달을 분석하여 공기 및 수증기하고 바닥 표면의 열교환을 검토하였다.
1997년에 Mistriotis[11]는 유체역학 분야에 계산 을 통해 각 온실 구조에 따라 공기가 유통하는 효율 을 분석하여, 온실 내 각 부분 작물의 에너지 흡수 량을 계산하였다. 또한 Sharmam, P.K[12]는 Runge- Kutta 법을 통해 온실 피복재료의 투과율과 농작물 의 비열이 온실 내 온도에 미치는 영향에 대한 연구 를 하였다. Pieters, J.G[13]는 2000년에 토마토를 재 배한 온실에 대해 수학 모델링에 관한 연구를 수행 하여 피복 재료의 표면 수증기의 응축 현상이 온실 태양 에너지 이용율에 미치는 영향을 분석하였다.
1985년에 텍사스 A&M 대학교의 Atsushi Kano와 Edward J Sadler[14]은 온실 모델링에 대해 실증적 인 블랙박스 모델(Empirical black-box models), 고정 적인 정상 상태 모델(Static steady-state models), 고 정적인 복수요소 모델(Static multiple-component models) 및 역학 복수요소 모델(Dynamic,multiple- component models)하고 이산화탄소 교환율이 포함 된 모델(Models including CO₂exchange rate of the crop)로 5가지 종류로 분류 정리하였다.
기존의 시설원예에 대한 해석 프로그램은 수치적 방법으로 접근하는 경우가 대부분이며, 간략한 에너 지평형식으로 부터 쉽게 온실부하를 계산할 수 있 는 프로그램의 개발이 필요하다.
본 연구에서는 열역학적 관계식을 기초로 하여 온 실 내부의 에너지평형과 질량평형식을 유도하고 EES(Engineering Equation Solver) 프로그램을 사용 하여 에너지 평형식을 연립방정식 형태로 구성하여 해를 구함으로써 외부환경에 따른 온실 내부온도 해석을 수행하였다.
이러한 수학적 모델링을 바탕으로 해석프로그램 을 개발하고 해석 대상온실의 온열환경 측정실험 결과와 비교하여 모델링의 정확성을 검토하였다. 신 뢰성인 확보된 해석프로그램을 이용하여 외기환경 의 변화에 따른 온실의 내부온도의 변화를 예측하 고 향후 온실용 난방장치의 부하계산의 활용할 수
있는 자료를 제공하고자 본 연구를 수행하였다.
2. 이론해석
2.1 온실의 열전달 모델링
온실은 외부 환경하고 지속적으로 에너지교환을 하고 있으며, 태양으로부터 복사 열량, 직접적인 열 복사의 방사 열량, 외기하고 환기 열량, 외부 공기와 교환한 열량하고 내부 토양과 교환한 열량이 있으 며, 이러한 열평형을 도식적으로 Fig. 1에 나타내었 다. 본 연구에서는 모델링의 간소화를 위하여 증산, 광합성작용 및 세포의 호흡작용은 무시하였다.
온실내부의 에너지 보존 법칙으로부터 식 (1)과 같은 열평형 방정식이 성립되며, 내부열량의 변화는 식 (2)와 같다.
(1)
(2) 온실에 입사된 태양 열복사 열량을 다음 식 (3)으 로 계산할 수 있고 여기서 비닐의 표면반사율은 0.2 로 사용하였다[27].
(3) 장파 복사 열량은 다음 식 (4)로 산출하고 이때 비 닐의 표면 방사율은 0.9이고, Stefan-Boltzmann의 흑 체 방사 상수가 5.67 × 10⁻⁸ W/m2K4이다[15]. 환기량 은 식 (5)로부터 구할 수 있다.
(4)
(5) 대류 열전달량을 다음 식 (6)으로 산출하고, 비닐 의 표면 열관류율은 외부공기의 함수로 식 (7)으로 계산하였다[29].
(6) (7) 온실의 내부공기와 토양사이의 열교환량을 다음 식 (8)로 계산할 수 있고, 여기서 토양의 열관류율이 5 W/m2K로 계산한다[30].
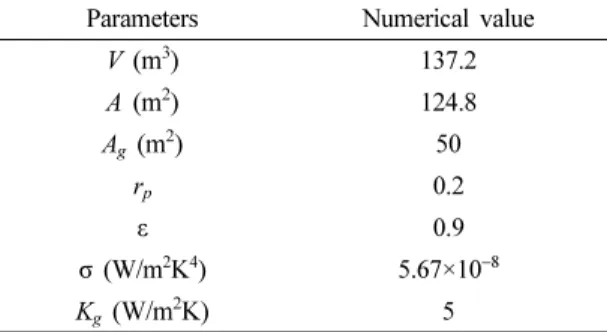
식 (1)~(8)을 연립하여 온실내부의 온도를 계산하 며, 이때 필요한 입력값은 Table 1과 같다. 각 계산 에 필요한 공기의 상태량 및 물성치는 EES(Eng- ineering Equation Solve)의 내장함수를 이용하였다.
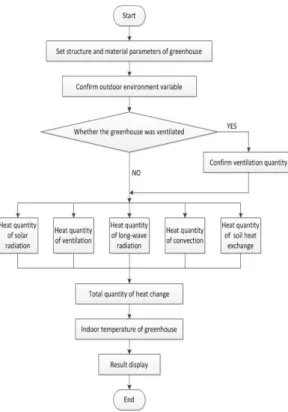
온실의 온열환경의 계산은 온실의 체적 및 표면적 그리고 외기조건에 대한 외기온도 및 토양온도를 입력 값으로 지정되며, 환기에 대하여 환기가 있을 경우 환기량을 먼저 가정하고 반복계산을 통하여 정확한 환기량을 계산한다. Fig. 2는 계산과정을 나 타내는 순서도이다.
태양으로부터 복사 열량, 직접적인 열복사의 방사 열량, 환기 열량, 외부 공기와의 열교환량을 계산한 후 온실내부의 토양과의 열전달을 계산하여 온실에 서의 총 열전달량을 계산하여 온실 내부온도의 변 화를 구한다.
본 온실의 위치는 제주시 조천읍 조천리 1515-3번 지 이며, Fig. 3 및 Fig. 4에 나타낸 바와 같이 높이 3 m, 폭 5 m 및 길이 10 m의 블루베리를 작물도 재 배하는 온실을 대상으로 하였다.
ΔQ = Qrad–Qvent–Qlrad–Qcon–Qgro ΔQ = V C ρa
dTi ---dt
⋅ ⋅ ⋅
Qrad = A R⋅ s⋅(1–rp)
Qlrad = ε A σ T⋅ ⋅ ⋅( i4–To4)
Qvent = C′ C ρ⋅ ⋅ a⋅(Ti–To)
Qcon = Kp⋅ ⋅A (Ti–To) Kp = 7.2 + 3.84 v⋅ a
Qgro = Agro⋅Kgro⋅(Ti–Tgro)
Fig. 1. Heat balance in the sunlight greenhouse.
Table 1. Structure and material parameters of greenhouse Parameters Numerical value
V (m3) 137.2
A (m2) 124.8
Ag (m2) 50
rp 0.2
ε 0.9
σ (W/m2K4) 5.67×10⁻⁸
Kg (W/m2K) 5
본 연구에서는 온실의 냉난방 용량을 수치적으로 계산하여 향후 개발되는 열펌프의 설계에 이용하고 자 수행되었다. 해석결과의 정확성은 실험값과 해석 값 중 어느 값이 정확한지 알 수 없으므로 식 (9)를 사용하여 계산하였다[16].
(9)
3. 결과 및 고찰
3.1 해석의 신뢰성 검증
본 시뮬레이션 연구의 신뢰성을 검토하기 위해 각 각의 모델을 해석하여 선행연구의 실험 데이터와 비교하였다.
온실의 열환경 모델링의 정확성을 알기 위해
ERROR = Experiment–Simulation Experiment+Simulation --- × 200%
Fig. 2. Flow chart of greenhouse simulation.
Fig. 3. Size of the greenhouse and position of temperature sensor.
Fig. 4. Picture of the duct in greenhouse.
Fig. 5. Comparison of the experimental and simulated data for internal temperature of the green house.
Table 2. External conditions of greenhouse
실험횟수 Date
Outdoor temperature
(oC)
Solar radiation
(W/m2)
Wind speed (m/s)
1 11.28 12.4 257.6 2.6
2 11.29 13.9 207.5 3.4
3 12.07 11.3 403.1 2.2
4 12.08 12.0 315.6 3.0
5 12.09 17.5 338.5 3.8
Table 2에 나타낸 총 5일의 실험 데이터를 선택해서 해석 결과와 비교하였다. 이때 온실의 환기량은 1 m3/s로 가정하였다. Fig. 5는 온실 내부온도의 실험 값과 해석결과를 비교한 그래프이다. 평균 오차는 4.87%이고 최대 오차는 6.14%로 계산결과가 비교 적 정확함을 알 수 있다.
3.2 외부조건에 따른 온실의 온도변화 특성
본 연구에서는 개발된 프로그램을 사용하여 온실 의 외부환경의 변화에 따른 온실내부의 온도를 계 산하였다. 이러한 해석은 EES(Engineering Equation Solver)를 이용한 간략한 열평형방정식을 연립방정 식 형태로 쉽게 해석할 수 있는 장점이 있다. 이러 한 계산을 통하여 온실내부의 온도변화를 외란에 대하여 해석함으로써 온실의 난방을 위한 난방기의 용량을 선정하는데 큰 잇점이 있다.
온실에서 발생되는 외부환경의 변화는 다양하나 본 연구에서는 온도, 풍량 및 일사량을 변수로 선정 하였다. 이때 외란은 온도 −10oC~30oC, 일사량 0 W/
m2~1000 W/m2 및 풍속 0 m/s~15 m/s의 범위로 설 정하였다.
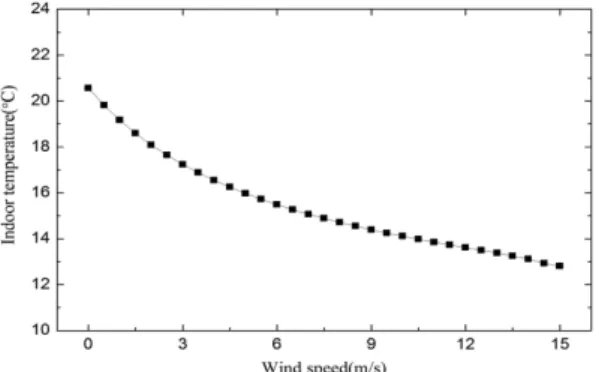
일사량 300 W/m2, 외기온도 10oC 및 환기량 1 m3/ s로 가정하고 풍속은 0 m/s~15 m/s로 변화하여 풍속 에 따른 온실 내부온도의 변화는 Fig. 6에 나타내었 다. 풍속이 증가하면 온실 내부온도는 떨어지며, 바 람이 없는 경우인 풍속이 0 m/s일 때 내부온도가 20.6oC되고 최대풍속인 15 m/s일 때 내부온도가 12.8oC이며, 풍속이 증가하면서 온실 내부온도의 변 화율은 감소된다.
일사량이 300 W/m2, 600 W/m2 및 900 W/m2로 변 화될 때 풍속 3 m/s 및 환기량 1 m3/s로 고정한 상
태에서 외기온도를 −10oC~30oC로 변화하여 외기온 도에 따른 온실 내부온도의 변화는 Fig. 7과 같다.
일사량 900 W/m2, 외기온도 30oC일 때에 온실 내부 온도는 50.1oC로 가장 높게 나타났으며, 일사량 300 W/m2, 외기온도 −10oC일 때에 온실 내부온도는
−2.9oC로 가장 낮게 나타났다. 일사량이 300 W/m2 씩 증가하면 온실 내부온도는 약 6.8oC가 증가되며, 외기온도 증가할수록 내부온도는 증가한다.
외기온도가 10oC, 20oC, 및 30oC일 경우에 풍속을 3 m/s 및 환기량 1㎥/s로 가정하고 일사량은 0 W/
m2~1000 W/m2로 변화할 때 일사량에 따른 온실 내 부온도의 변화는 Fig. 8에 나타내었다. 외기온도가 30oC, 일사량이 1000 W/m2일 때 온실 내부온도는 52.6oC로 가장 높게 나타났고, 외기온도가 10oC, 일 사량이 0 W/m2일 때 온실 내부온도는 10.3oC로 가 장 낮게 나타났다. 외기온도가 10oC씩 증가하면 온 실 내부온도는 약 9.9oC가 증가하며, 일사량이 증가 하면 온실 내부온도도 같이 높아진다.
Fig. 6. Indoor temperature variation with wind speed.
Fig. 7. Indoor temperature variation with outdoor air temperature at different solar radiation.
Fig. 8. Indoor temperature variation with solar radiation at different outdoor air temperature.
5. 결 론
본 연구에서는 온실 내부의 에너지평형과 질량평 형 식을 유도하고 EES 프로그램을 사용하여 외부환 경에 따른 온실 내부 온도 해석을 수행하였다. 해석 결과에 따라 다음과 같은 결론을 얻을 수 있다.
1) 해석프로그램의 신뢰성을 검토 하였을 때 온실 내부온도의 실험값과 해석 값을 비교한 결과에 평 균 오차는 4.87%로써 해석 결과는 실험 결과와 잘 일치하였다.
2) 외부조건 변화에 따른 온실 내부온도 특성을 파악하기 위하여 온실의 외부조건 중에 외기온도
−10oC~30oC, 일사량 0 W/m2~1,000 W/m2및 풍속 0 m/s~15 m/s로 각각 변화시켰다. 일사량이 300 W/m2 씩 증가하면 온실 내부온도는 약 6.8oC가 증가된다.
외기온도가 증가할수록 내부온도는 증가하는데 외 기온도 10oC의 증가에 대하여 온실 내부온도는 약 9.9oC가 증가하여 외기온도이 증가는 온실 내부온 도를 비례적으로 증가시킨다는 것을 알 수 있다. 풍 속이 증가할 경우에 온실 내부온도는 감소하지만 온도의 변화율은 감소한다.
후 기
본 결과물은 농림축산식품부의 재원으로 농림식 품기술기획평가원의 첨단생산기술개발사업의 지원 을 받아 연구되었음(318059-03).
References
1. Taehyung Kim, An Experimental Study on Refrigerant Charge of a Heat Pump System in accordance with Change of Heat Source and Expansion Device, Master thesis, Jeju University, 2015.
2. Sethi, V. P. and Sharma, S. K., “Thermal modeling of a greenhouse integrated to an aquifer coupled cavity flow heat exchanger system”, Solar Energy, 81, pp. 723-741, 2007.
3. Yong Cheol Yoon and Myung Won Suh, “System and it's function of a heat pump for green house”, Journal of the Korean Society of Agricultural Engineers, Vol. 39, No. 4, pp. 5-13, 1997.
4. Greenhouse status for the vegetable grown in facilities and the vegetable productions in 2011. Ministry of Agriculture, Food and Rural Affairs (MAFRA).
Gwacheon, Korea, 2012.
5. Cultivation status of floricultural crop in 2011. Ministry of Agriculture, Food and Rural Affairs (MAFRA).
Gwacheon, Korea. 2012.
6. Gracia, J. L., De la Plaza, L. M., Narvas, R. M.
Benavente, and L. Luna, “Evaluation of the feasibility of alternative energy sources for greenhouse heating”, J. Agric. Eng. Res, 69, pp. 107-114, 1998.
7. Nam Yu-Jin and Gao Xin-Yang, “Study on the Performance Prediction Simulation of the Heat Pump System using Solar and Geothermal Heat Source”, Journal of the Korean Solar Energy Society, 34(3), pp.
75-81, 2014.
8. J. G. Pieters and J. M. Deltour, Modelling solar energy input in greenhouses, Sol. Energy 67, pp. 119-130, 1999.
9. Del Barrio, E P., “Analysis of the green roofs cooling potential in buildings”, Energy and Buildings, 27, pp.
179-193, 1998.
10. Zhihao, Q., Berliner, P., and Arnon Karnieli, “Numerical solution of a complete surface energy balance model for simulation of heat fluxes and surface temperature under bare soil environment”, Applied Mathematics and Computation, 130, pp. 171-200, 2002.
11. Mistriotis, A., “Computational analysis of ventilation in greenhouses at zero and low speeds”, Agriculturaland Forest Meterology, 88, pp. 121-135, 1997.
12. Sharma, P. K. and Tiwari, G. N., “Parametric study of a greenhouse by using Runge-Kutta methods”, Energy Conversion & Management, 40, pp. 901-912, 1999.
13. Pieters, J. G. and Deltour, J. M., “Modelling solar energy input in greenhouses”, Solar Energy, 61, pp.
119-130, 1999.
14. Atsushi Kano and Edward J Sadler, “Control and modeling of vertical temperature distribution in green- house crops”, Acta Horticulturae, (456), pp. 368-370, 1998.
15. J. Li, “Simulation of air temperature and relative humidity in plastic greenhouse tunnel covered with insect-proof nets in lower reaches of Yangtze River”, Transactions of the Chinese Society of Agricultural Engineering, 26(6), pp. 238-244, 2010.
16. Carlson, G. A. http://www.ece.rochester.edu/courses/
ECE111/error_uncertainty.pdf