대한지리학회지 제50권 제3호 2015(355~373)?
Analyses on Related Factors with Fire Damage in Korea
Eunmi Chang* · Byungki Kang** · Kyeong Park***
한국에서의 화재 피해 관련요인 분석
장은미*·강병기**·박경***
Abstract : In this study the factors of fire damage are analyzed through previous research reviews. Local envi- ronmental factors as well as those factors attributed to fire damage (number of fire events, number of injured, number of death, economic loss) were selected to compose mutual relationship model. In order to verify this relationship model, official statistics concerning fire damage were collected from 228 local governments and compared with results from previous research. As a result of this comparison four dependent variables and 22 independent variables that affect fire damage were analyzed. Independent variables are divided into human vulnerability factors, physical vulnerability factors, economic vulnerability factors, mitigating factors and lo- cal characteristics. To analyze a relationship between selected dependent variables and independent variables, we applied a semi-logarithm model and performed regression analysis. Among the 22 independent variables, the number of the weak to disaster, social welfare service workers, workers in manufacturing industry, and the number of workers in restaurants and bars per 10,000 people show the significant correlation with the number of fire incidence. The number of death from fire is significantly related to two variables which are the number of social welfare service workers per 10,000 and the ratio of commercial area. Damage cost is significantly dependent on the property taxes per 10,000 people. These factors were included in the research model as vul- nerability factors (human, physical, economic) and mitigating factors and local characteristics, and the validity of research model was verified. The result could contribute to fire-fighting resource allocation in Korea or they can be utilized in establishing fire prevention policy, which will enhance the national level of fire safety.
Key Words : fire damage, related factor to determine fire damage, regression analysis
요약 :본 연구에서는 화재로 인한 피해에 영향을 주는 여러 요인들에 대한 사전 연구를 살펴보고, 주요 화재
피해 결정요인에 대한 모델을 만들고 지역환경 요소와 화재피해요소의 변수를 선정하여 상호인과관계 모형을 정립하였다. 모델의 유효성을 검증하기 위하여 228개의 시군구 자치단체별로 공표된 통계를 선정하여, 화재 피해에 대한 4개의 종속변수와 22개의 독립변수를 선정하여 검증을 하였다. 독립변수는 인적 취약성, 물리적 취약성, 경제적 취약성 및 경감요소와 지역의 특성으로 구분하여 구성하였다. 선택된 변수의 상관관계를 분석 하기 위하여 준로그 모형을 적용하여 회귀분석을 수행하였다. 22개의 독립변수 중에서 만명당 재난약자수, 만 명당 제조업 종사주수, 만명당 연료소매업 종사자수, 만명당 음식·요식업 종사자수는 화재의 발생건수와 유의 미한 상관관계를 보여주었으며, 이와는 달리 화재로 인한 사망자수는 만명당 사회복지사수와 상업지구비율과 유의미한 상관관계를 보였다. 이외에 화재로 인한 경제적 손실값을 설명하는 변수로는 만명당 부과된 재산세
* (주)지인컨설팅 대표(CEO, Ziinconsulting Inc.), [email protected]
** 국민대학교 강사(Lecturer, Kookmin University), [email protected]
*** 성신여자대학교 부교수(Associate Professor, Sungshin Women’s University), [email protected]
1. Introduction
Geographical analyses on fire incidences are very rare, whether they are natural or man-induced. Only a few studies were carried out in this area until now, and they are also carried out in a descriptive way. Lee (1994) found that the physical conditions such as relative humidity, temperature and regional characteristics such as the pop- ulation sizes are important. But the meanings of statistics were not clearly expressed. Regional analyses on fire disas- ter, however, was done for the city of Daejeon (Kim and Kim, 2009). Since fire is one of the key events that can cause significant fatalities as well as serious property dam- age, most countries make diverse efforts to minimize the impacts of natural and man-induced fire. Geographical research activities are also encouraged in many countries.
Despite individual’s efforts to prevent or minimize fire, it can happen at any time and place in daily life.
Thus, governments provide various systems and allocate budget to minimize the incidence of fire. Depending on the probability of the fire risk, proper decisions have to be made to minimize fire damage by arranging fire-fighting equipment and personnel in different regions to respond to those risk posed by fire. In this regard, the institutional standards of basic fire-fighting resources like fire stations are established under the “Framework Act on Fire Ser- vices,” as well as under regulations of presidential decree over “Local regulations regarding the installation of fire protection agencies”. Two criteria for the establishment of 119 Fire Safety Center are area and population. Other standards that determine fire-fighting resources, such as
the number of fire-fighters, fire-fighting equipment, and budget to allocate, are not clearly stated in the frame- work.
The purpose of this study is to deduce local environ- mental factors that affect fire occurrence or damage caused by fire in Korea. More specifically, we conducted empirical analysis of local environmental factors in the county level, in order to derive factors that affect fire breaking or damage. The result of this research can help to set up a standard of fire-fighting allocation procedures and help the central and/or local governments in policy making.
According to the “Framework Act on Fire Services”
of Korea, fire-fighting administration and activities are the responsibility of local governments. Therefore, in this study we collected diverse statistical data on fire occur- rence and damage that can elaborate upon the environ- ment of local governments. Statistical data were collected from 2007 to 2011 from official publications, other pub- lic sources or institutions. Statistical data were extracted from 228 county level governments.
Many researchers already pointed out that local envi- ronmental factors or personal factors affect fire damage.
Empirical analysis based on logistic regression, as well as relationship analysis, was conducted in order to derive these factors (Parker et al, 2013; Zahang and Jiang, 2012;
Lee, 2010; Shai, 2006). The causes of fire or damage, however, depend heavily on regional or local characteris- tics; therefore the results from foreign studies are difficult to apply directly to those cases of Korea. Despite the im- portance of local environmental factors, empirical analy- sis based on a relationship analysis in Korea is very rare 가 유의미한 변수로 도출되었다. 단순히 인구와 면적으로 소방에 필요한 자원을 배분하지 않고 피해에 영향을 주는 변수를 고려해야 할 것으로 사료되며 이 결과물은 화재예방정책과 화재안전을 제고하는 데 기여할 것으 로 기대된다.
주요어 :화재 피해, 화재피해 관련요인, 회귀분석
Analyses on Related Factors with Fire Damage in Korea
except for Goo’s research (2012). In case of fire-fighting resources, only simple statistical analyses like frequency analysis are applied, and these studies are limited only to exploratory research. Moreover, he focused on selected location of fire stations rather than on fire-fighting re- sources assigned in each region. Thus, as far as fire-fight- ing resources standards are concerned, this research has some limitations. We reviewed relationships of fire dam- age (including fire occurrences) identified in previous studies and constructed a relational model. Also, through examination of previous literature related to fire damage, we selected local environmental factors that cause the fire damage.
We also proposed a research model on the basis of the literature review. Where possible, we explored official statistical data, and defined dependent variables and in- dependent variables of fire damage. The attributes of the defined dependent and independent variables were ex- amined through basic statistical analysis, and we selected methodology based on regression analysis according to a variable’s characteristic. We also analyzed results from selected regression analysis and derived critical factors to determine fire damage among local environment factors.
This critical factor was derived by applying empirical analysis; SPSS 18.0 program was used to perform this analysis. Finally, we summarized the research result and draw suggestions for directions of future research.
2. Theoretical Background
1) Fire Damage Relational Models
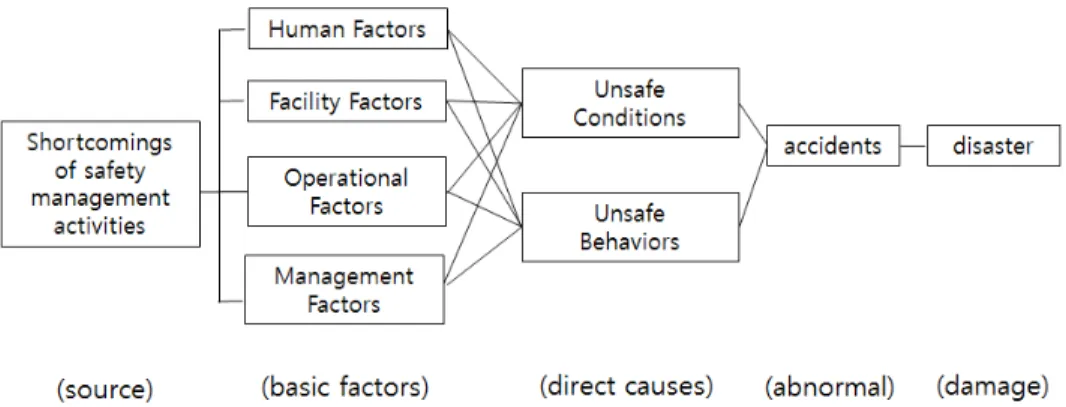
Fire incidences have various causes. Kim divided fire processes into five phases (Figure 1): source, basic factors of causes, direct causes, abnormality (accidents or inci- dences), and damages (Kim, 2009). From fire incidence–
which we refer to as accidents–direct causes can be select- ed as unsafe conditions and/or unsafe behaviors which ignite the fire. For example, discarded cigarettes can be direct causes of fire incidence. However, if there were fire resistant material around that person, it would not cause fire. Many different factors with such conditions and behaviors can be categorized into four types: human fac- tors, such as fire igniters and fire-fighters; facility factors, such as fire stations and special facilities for industrial complex; operational factors, such as a governing system, a proper police line (location and time), and space for the fire-fighting operation; and management factors, such as regular checkups, auditing for fire prevention, and proper laws and activities for prevention and preparedness of fire.
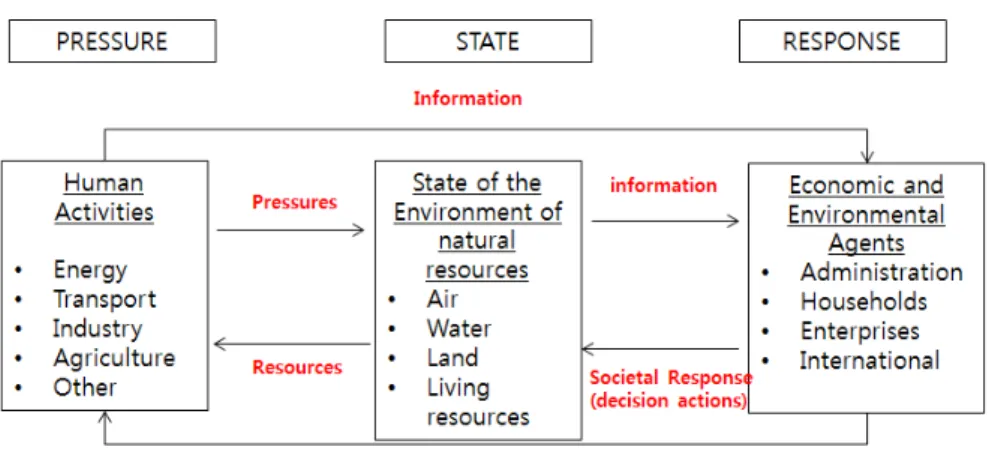
In case of fire disasters, the PSR model is widely used for fire causes (OECD, 2001). The PSR model was de- veloped originally for environmental assessment. This
Figure 1. Framework diagram for disaster occurrence (Kim, 2009)
model sets causality concept between basic indicators and carries a structure of pressure - state - response, as shown in Figure 2. The PSR model assumes that there is a feedback relationship among pressure, state and response factors. Lee (2008) applied PSR model to flood manage- ment system, defining “pressure“ as causal factors, “state”
as the flood phenomenon, and “response” as activities for reducing flood damage and countermeasures.
Petak (1985) divided disaster management into pre- disaster management and post-disaster management according to the disaster progress and response activities and then he explained it with four sequential steps: ① mitigation and prevention; ② preparedness and plan- ning; ③ response; ④ recovery. If we synthesize these three models, we may observe that fire damage can be generated by a variety of vulnerable causes and that these vulnerable causes are composed of population and economic factors or physical factors. On the one hand, fire prevention or fire accidents can be observed through mitigating factors which contribute to minimization of human damage or property damage through immediate fire-fighting or emergency actions. On the other hand, fire damage can be seen as number of fire accidents, num- ber of victims, death toll, costs etc.
2) Legal Status and Reviews of Key Factors for Fire Damage
In case of Korea, local environmental factors trigger- ing fire accident or fire damage are described in the law.
Currently, the first clause of Article 13 of the “Frame- work Act on Fire Services” regulates that city areas con- gested with buildings, areas where fire is of high concern, or areas where fire damage is expected to be especially severe, can be designated as fire watch districts. Article 4 of the Enforcement Decree states the target areas of fire watch districts are defined as follows:
1. Market areas
2. Districts with concentrated factories and, warehouses 3. Districts with concentrated wooden buildings 4. Districts with concentrated facilities for storage and
handling dangerous materials
5. Areas with producing petro-chemicals products 6. Areas without fire-fighting facilities/water or without
accessible road
7. Areas other than the one enlisted in Article 4 No. 1 to No. 6, recognized by Chief of Fire Station, where fire is of high concern or could cause severe damages.
Figure 2. Pressure-State-Response model for fire incidences (OECD, 2002)
Analyses on Related Factors with Fire Damage in Korea
Previous research regarding critical factors of fire dam- age is very diverse and the critical content of research related to this study is examined. In order to derive criti- cal factors of injuries caused by fire and hot water, Parker (2013) adopted factors of an individual’s characteristics, such as sex, age, education, income, race, house owner- ship and underage members of the family. Zhang and Jiang (2012) performed empirical analysis of fire damage by combining statistical data, including consumption of electricity, gas, electric heaters, electronic goods, popula- tion, housing, factories, and multiplex with climate and weather data. The number of fire accidents was reported to depend on human factors, electrical factors, and me- chanical/chemical factors in order of importance, and carelessness in food preparation and the handling of ciga- rette butts as the main causes of fire (Lee, 2010). Swanson (2010) proposed the importance of the arrival time of fire rescue teams by utilizing a spatial analysis of several ele- ments such as the population density, the number of fire- fighters, and the number of fire stations–all of which are the determinants for the location of fire stations.
Kim (2008) regarded fire-fighting budget as one of the most critical factors in ensuring sufficient fire-fighting resources, such as the number of fire-fighters, the num- ber of fire-fighting equipment, and the number of fire stations. He analyzed fire-fighting resources using the fire-fighting budget and common facilities tax. Also, he calculated a variable by dividing fire-fighting budget by the number of inhabitants.
Shai (2006) conducted a regression analysis over regional characteristics, such as the number of old houses, race, income, education, phone owner ratio, the unemployment rate and the empty houses ratio, to see the effects on the number of fire victims. Baek (2004) examined whether the fire-fighting resources are located properly, depending on the environment and demand.
He concluded that environmental variables such as pop- ulation, jurisdiction area, ratios of population above 65, the number of employees in the secondary industry, the
number of employees in the tertiary industry, commer- cial service area, power consumption, and gas consump- tion are significant in the number of fire accidents. Also, it appeared that these environmental variables differ depending on whether they are related to city or county areas. In his research, Baek (2004) regarded fire-fighting resources as the number of fire stations, the number of fire-fighters and the number of fire trucks. Kim (2002) adopted roads, hospitals, fire stations, gas stations, fire prone place, and fire watch districts (shopping areas, wooden buildings areas, areas with many gas stations and dangerous material storage places) as variables, in order to evaluate the proper position of a fire station in a dense residential district of Seoul city.
Vasconcelos (2001) adopted topography (elevation, slope, aspect), land use/cover (use, burned areas), man- made features (road network, urban areas), and spatial relationships (distance to roads, distance to urban areas, distance to farm, distance to scrubland, distance to for- est) as the variables of a wilderness fire in Portugal. Goo (2012) argued that fire-fighters must arrive within five minutes in response time to the commercial, recreational or industrial areas where the risks of life and property loss are the highest. Heo (2007) analyzed fire accidents among buildings in the central business districts and concluded that more than 50% of fire accidents occurred in neighborhood facilities, among which 70% accounts for restaurants and others.
According to the previous studies examined above, the ratio of elderly population (above 65) to carelessness can be included in human factors and human vulnerability factors among the fire damage vulnerability factors in local governments’ environment. Physical vulnerability factors-such as the population density; commercial ar- eas; factories; the number of employees in the secondary industry; the number of employees in tertiary industry;
multiplex businesses; gas stations and dangerous object storage facilities; roads conditions; etc.-can also be in- cluded.
Mitigating factors include the fire-fighting resources such as the number of fire-fighters, the number of fire stations, the number of fire-fighting equipment and fire- fighting budget. Also hospitals and road conditions could be included in mitigating factors in terms of reducing fire victims.
3. Establishment of Fire Relational Model
1) Initial Research Models
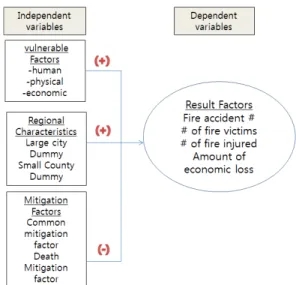
In this study, we applied the factors of fire damage analysis from previous researches. The research model is presented in Figure 3. The independent variables of the research model are vulnerability factors and local factors, while the dependent variables are the results of these fac- tors. The vulnerability factors are defined as the factors that, by fire, increase an impact (+) of various damages of the local environmental factors. According to the results of the previous research, the human vulnerability factors and the physical vulnerability factors are differentiated from the economic vulnerability factors. The mitigating factors are defined as factors that decrease an impact of fire (-) to the local environmental factors. These factors are divided into four kinds of the dependent variables such as vulnerable factors, regional factor, mitigation factors, and result factors. According to other studies fire damage may differ across instances, depending on regional characteristics (city area, county area), thus the regional characteristics were formulated to be the inde- pendent variable (Baek, 2004).
The dependent variables measuring fire damage are selected as four factors: number of fire accidents, the number of fire victims, the number of fire injuries, and the amount of economic loss, as shown in Figure 3. In order to derive the local environmental factors that affect
fire damage, we collected diverse official statistical data for analysis and applied it to the model above. The official statistical data is defined as the data from the govern- ment or public institutions that is published on a regular basis. Further detailed statistics are available for several administration units, but we did not use them as they are not available from every local government. Statistical data from 2007 to 2011 were obtained from surveys, and PDF format data were converted to spreadsheets. The independent variables and the dependent variables were processed through basic statistical analysis and created a regression analysis methodology (SPSS 18.0). The re- sults of the regression analysis were summarized and the critical factors of fire damage were derived. On the basis of these factors we identified and presented the implica- tions.
2) Selection of Variables
In this research, four kinds of the dependent variables–
the number of fire accidents, the number of injured, death toll and economic loss–are drafted as variables calculated per 10,000 people. For the dependent vari- ables, we collected data obtained between 2007 and 2011
Figure 3. Variables for models
Analyses on Related Factors with Fire Damage in Korea Table 1. Correlation matrix of the variables : A: fire occurrence per 10,000, B: fire injured per 10,000, C: casualty from fire per 10,000, D: economic
loss per 10,000 (1,000 won), a: the number of weak to disaster per 10,000, b: the number of days in hospital benefited with health insurance per 10,000, c: the number of social welfare service workers per 10,000, d: population density, e: commercial area size ratio, f: industrial area size ratio, g: number of workers in manufacturing industry per 10,000 people, h: number of workers in fuel retail trade per 10,000 people, i number of workers in restaurants and bars per 10,000 people per 10,000, j: financial independence rate, k :Local income tax per 10,000 people, l: Property taxes per 10,000 people, m: city dummy n: gun dummy o: local government safety budget ratio p: number of fire-fighters per 10,000 people, q: number of fire stations per 10,000 people, r: Water supply ratio, s: number of police officers per 10,000 people, t: number of police stations per 10,000 people.
A B C D a b c d e f g h i j k l m n o p q r s t
A
Pearson co ef. 1 .698 .399 .401 .640 .503 .498 -.565 -.116 -.275 .284 .764 .120 -.402 .042 .019 -.420 .601 .327 .587 .569 -.322 .256 .465 sig (2-tail) .000 .000 .000 .000 .000 .000 .000 .080 .000 .000 .000 .069 .000 .531 .772 .000 .000 .000 .000 .000 .000 .000 .000 N 228 228 228 228 228 228 228 228 228 228 228 228 228 228 228 228 228 228 228 228 228 228 228 228 B
Pearson co ef. .698 1 .672 .401 .529 .480 .389 -.475 .068 -.230 .244 .672 .232 -.312 .088 .083 -.374 .506 .270 .531 .530 -.226 .272 .416 sig (2-tail) .000 .000 .000 .000 .000 .000 .000 .306 .000 .000 .000 .000 .000 .187 .212 .000 .000 .000 .000 .000 .001 .000 .000 N 228 228 228 228 228 228 228 228 228 228 228 228 228 228 228 228 228 228 228 228 228 228 228 228 C
Pearson co ef. .399 .672 1 .361 .376 .426 .285 -.258 .209 -.153 .009 .342 .229 -.270 .038 -.008 -.252 .412 .223 .392 .481 -.223 .257 .464 sig (2-tail) .000 .000 .000 .000 .000 .000 .000 .002 .021 .898 .000 .001 .000 .565 .910 .000 .000 .001 .000 .000 .001 .000 .000 N 228 228 228 228 228 228 228 228 228 228 228 228 228 228 228 228 228 228 228 228 228 228 228 228 D
Pearson co ef. .401 .401 .361 1 .297 .309 .312 -.317 -.116 -.188 .155 .455 .076 -.102 .045 .157 -.304 .321 .109 .219 .288 -.095 .029 .214 sig (2-tail) .000 .000 .000 .000 .000 .000 .000 .081 .004 .019 .000 .254 .125 .502 .018 .000 .000 .101 .001 .000 .152 .662 .001 N 228 228 228 228 228 228 228 228 228 228 228 228 228 228 228 228 228 228 228 228 228 228 228 228 a
Pearson co ef. .640 .529 .376 .297 1 .747 .552 -.569 -.206 -.311 -.037 .674 -.116 -.669 -.120 -.297 -.573 .779 .389 .469 .763 -.482 .326 .737 sig (2-tail) .000 .000 .000 .000 .000 .000 .000 .002 .000 .576 .000 .080 .000 .070 .000 .000 .000 .000 .000 .000 .000 .000 .000 N 228 228 228 228 228 228 228 228 228 228 228 228 228 228 228 228 228 228 228 228 228 228 228 228 b
Pearson co ef. .503 .480 .426 .309 .747 1 .282 -.503 -.260 -.311 -.044 .543 -.151 -.544 -.161 -.258 -.460 .746 .442 .394 .769 -.358 .226 .807 sig (2-tail) .000 .000 .000 .000 .000 .000 .000 .000 .000 .511 .000 .023 .000 .015 .000 .000 .000 .000 .000 .000 .000 .001 .000 N 228 228 228 228 228 228 228 228 228 228 228 228 228 228 228 228 228 228 228 228 228 228 228 228 c
Pearson co ef. .498 .389 .285 .312 .552 .282 1 -.497 -.086 -.264 -.038 .492 .078 -.380 .079 -.085 -.426 .414 .292 .355 .394 -.236 .171 .306 sig (2-tail) .000 .000 .000 .000 .000 .000 .000 .197 .000 .563 .000 .242 .000 .234 .201 .000 .000 .000 .000 .000 .000 .010 .000 N 228 228 228 228 228 228 228 228 228 228 228 228 228 228 228 228 228 228 228 228 228 228 228 228 d
Pearson co ef. -.565 -.475 -.258 -.317 -.569 -.503 -.497 1 .415 .347 -.181 -.703 .126 .413 .147 .214 .710 -.473 -.371 -.292 -.503 .287 -.102 -.435 sig (2-tail) .000 .000 .000 .000 .000 .000 .000 .000 .000 .006 .000 .058 .000 .027 .001 .000 .000 .000 .000 .000 .000 .124 .000 N 228 228 228 228 228 228 228 228 228 228 228 228 228 228 228 228 228 228 228 228 228 228 228 228 e
Pearson co ef. -.116 .068 .209 -.116 -.206 -.260 -.086 .415 1 .189 -.030 -.289 .735 .222 .488 .360 .394 -.256 -.196 .265 -.165 .152 .272 -.158 sig (2-tail) .080 .306 .002 .081 .002 .000 .197 .000 .004 .647 .000 .000 .001 .000 .000 .000 .000 .003 .000 .012 .021 .000 .017 N 228 228 228 228 228 228 228 228 228 228 228 228 228 228 228 228 228 228 228 228 228 228 228 228 f
Pearson co ef. -.275 -.230 -.153 -.188 -.311 -.311 -.264 .347 .189 1 .203 -.258 -.001 .177 .066 .019 .411 -.313 -.185 -.189 -.302 .142 -.099 -.272 sig (2-tail) .000 .000 .021 .004 .000 .000 .000 .000 .004 .002 .000 .988 .007 .318 .781 .000 .000 .005 .004 .000 .032 .135 .000 N 228 228 228 228 228 228 228 228 228 228 228 228 228 228 228 228 228 228 228 228 228 228 228 228 g
Pearson co ef. .284 .244 .009 .155 -.037 -.044 -.038 -.181 -.030 .203 1 .348 .038 .240 .253 .246 -.038 -.051 .063 .058 -.115 .084 -.056 -.112 sig (2-tail) .000 .000 .898 .019 .576 .511 .563 .006 .647 .002 .000 .571 .000 .000 .000 .563 .439 .344 .385 .084 .208 .398 .093 N 228 228 228 228 228 228 228 228 228 228 228 228 228 228 228 228 228 228 228 228 228 228 228 228 h
Pearson co ef. .764 .672 .342 .455 .674 .543 .492 -.703 -.289 -.258 .348 1 -.009 -.424 -.072 -.030 -.573 .594 .432 .457 .584 -.255 .200 .472 sig (2-tail) .000 .000 .000 .000 .000 .000 .000 .000 .000 .000 .000 .891 .000 .281 .649 .000 .000 .000 .000 .000 .000 .002 .000 N 228 228 228 228 228 228 228 228 228 228 228 228 228 228 228 228 228 228 228 228 228 228 228 228 i
Pearson co ef. .120 .232 .229 .076 -.116 -.151 .078 .126 .735 -.001 .038 -.009 1 .314 .739 .646 .196 -.128 -.065 .512 -.003 .156 .499 -.014 sig (2-tail) .069 .000 .001 .254 .080 .023 .242 .058 .000 .988 .571 .891 .000 .000 .000 .003 .053 .332 .000 .959 .018 .000 .833 N 228 228 228 228 228 228 228 228 228 228 228 228 228 228 228 228 228 228 228 228 228 228 228 228 j
Pearson co ef. -.402 -.312 -.270 -.102 -.669 -.544 -.380 .413 .222 .177 .240 -.424 .314 1 .457 .677 .245 -.547 -.294 -.245 -.567 .352 -.126 -.552 sig (2-tail) .000 .000 .000 .125 .000 .000 .000 .000 .001 .007 .000 .000 .000 .000 .000 .000 .000 .000 .000 .000 .000 .057 .000 N 228 228 228 228 228 228 228 228 228 228 228 228 228 228 228 228 228 228 228 228 228 228 228 228 k
Pearson co ef. .042 .088 .038 .045 -.120 -.161 .079 .147 .488 .066 .253 -.072 .739 .457 1 .735 .210 -.151 -.090 .368 -.106 .104 .309 -.085 sig (2-tail) .531 .187 .565 .502 .070 .015 .234 .027 .000 .318 .000 .281 .000 .000 .000 .001 .022 .175 .000 .110 .116 .000 .203 N 228 228 228 228 228 228 228 228 228 228 228 228 228 228 228 228 228 228 228 228 228 228 228 228 l
Pearson co ef. .019 .083 -.008 .157 -.297 -.258 -.085 .214 .360 .019 .246 -.030 .646 .677 .735 1 .273 -.234 -.118 .220 -.210 .191 .248 -.190 sig (2-tail) .772 .212 .910 .018 .000 .000 .201 .001 .000 .781 .000 .649 .000 .000 .000 .000 .000 .077 .001 .001 .004 .000 .004 N 228 228 228 228 228 228 228 228 228 228 228 228 228 228 228 228 228 228 228 228 228 228 228 228 m
Pearson co ef. -.420 -.374 -.252 -.304 -.573 -.460 -.426 .710 .394 .411 -.038 -.573 .196 .245 .210 .273 1 -.438 -.250 -.162 -.463 .291 .024 -.362 sig (2-tail) .000 .000 .000 .000 .000 .000 .000 .000 .000 .000 .563 .000 .003 .000 .001 .000 .000 .000 .014 .000 .000 .724 .000 N 228 228 228 228 228 228 228 228 228 228 228 228 228 228 228 228 228 228 228 228 228 228 228 228 n
Pearson co ef. .601 .506 .412 .321 .779 .746 .414 -.473 -.256 -.313 -.051 .594 -.128 -.547 -.151 -.234 -.438 1 .464 .418 .763 -.372 .235 .694 sig (2-tail) .000 .000 .000 .000 .000 .000 .000 .000 .000 .000 .439 .000 .053 .000 .022 .000 .000 .000 .000 .000 .000 .000 .000 N 228 228 228 228 228 228 228 228 228 228 228 228 228 228 228 228 228 228 228 228 228 228 228 228 o
Pearson co ef. .327 .270 .223 .109 .389 .442 .292 -.371 -.196 -.185 .063 .432 -.065 -.294 -.090 -.118 -.250 .464 1 .247 .401 -.163 .092 .303 sig (2-tail) .000 .000 .001 .101 .000 .000 .000 .000 .003 .005 .344 .000 .332 .000 .175 .077 .000 .000 .000 .000 .014 .165 .000 N 228 228 228 228 228 228 228 228 228 228 228 228 228 228 228 228 228 228 228 228 228 228 228 228 p
Pearson co ef. .587 .531 .392 .219 .469 .394 .355 -.292 .265 -.189 .058 .457 .512 -.245 .368 .220 -.162 .418 .247 1 .597 -.159 .629 .426 sig (2-tail) .000 .000 .000 .001 .000 .000 .000 .000 .000 .004 .385 .000 .000 .000 .000 .001 .014 .000 .000 .000 .016 .000 .000 N 228 228 228 228 228 228 228 228 228 228 228 228 228 228 228 228 228 228 228 228 228 228 228 228 q
Pearson co ef. .569 .530 .481 .288 .763 .769 .394 -.503 -.165 -.302 -.115 .584 -.003 -.567 -.106 -.210 -.463 .763 .401 .597 1 -.342 .379 .810 sig (2-tail) .000 .000 .000 .000 .000 .000 .000 .000 .012 .000 .084 .000 .959 .000 .110 .001 .000 .000 .000 .000 .000 .000 .000 N 228 228 228 228 228 228 228 228 228 228 228 228 228 228 228 228 228 228 228 228 228 228 228 228 r
Pearson co ef. -.322 -.226 -.223 -.095 -.482 -.358 -.236 .287 .152 .142 .084 -.255 .156 .352 .104 .191 .291 -.372 -.163 -.159 -.342 1 -.111 -.356 sig (2-tail) .000 .001 .001 .152 .000 .000 .000 .000 .021 .032 .208 .000 .018 .000 .116 .004 .000 .000 .014 .016 .000 .094 .000 N 228 228 228 228 228 228 228 228 228 228 228 228 228 228 228 228 228 228 228 228 228 228 228 228 s
Pearson co ef. .256 .272 .257 .029 .326 .226 .171 -.102 .272 -.099 -.056 .200 .499 -.126 .309 .248 .024 .235 .092 .629 .379 -.111 1 .431 sig (2-tail) .000 .000 .000 .662 .000 .001 .010 .124 .000 .135 .398 .002 .000 .057 .000 .000 .724 .000 .165 .000 .000 .094 .000 N 228 228 228 228 228 228 228 228 228 228 228 228 228 228 228 228 228 228 228 228 228 228 228 228 t
Pearson co ef. .465 .416 .464 .214 .737 .807 .306 -.435 -.158 -.272 -.112 .472 -.014 -.552 -.085 -.190 -.362 .694 .303 .426 .810 -.356 .431 1 sig (2-tail) .000 .000 .000 .001 .000 .000 .000 .000 .017 .000 .093 .000 .833 .000 .203 .004 .000 .000 .000 .000 .000 .000 .000
N 228 228 228 228 228 228 228 228 228 228 228 228 228 228 228 228 228 228 228 228 228 228 228 228
from the National Emergency Management Agency. As a result, we observed that among 228 local governments (county level), the annual average of counties with the number of injured=0 was 9.8 and the annual average of counties with the death toll=0 was 79.8. The deviation between each variable was very big. In order to solve this big standard deviation, we divided the value of the an- nual average statistics by the population (unit: 10,000 people) registered in the records of National Statistical office and then drafted the dependent variables. The ad- opted value of the annual average statistics of the number of counties with the death toll=0 decreased to 7 and the rest of the dependent variables were reduced to 0 and were all deleted.
For the purpose of this study, we surveyed 226 official statistical data from local government units that are likely to be selected as the three kinds of the independent variables. To select the independent variable, we initially searched for the average value across the 226 official statistical data for 5 years, and then, after dividing it by 10,000 people, we converted the number to the variable.
Furthermore, we selected 17 statistical findings to be related to area size, such as land use data, and divided it by the area size of the administrative district, upon which we converted this ratio to a variable.
In order to select critical variables, we have to consider four aspects: ① consistency of statistics, ② represen- tativeness of statistics, ③ the degree of correlation to dependent variables, and ④ logical rationale. Based on
①, we excluded 24 statistical findings like the number of mountainous fire statistics, as many guns (regions at the county level) do not have the statistics. Based on ②, we selected one of the statistical findings from similar contents, the number of weak people to disaster from variables: physically disabled persons per 10,000, the number of those aged over 65 per 10,000, and foreigners per 10,000. For the compliance of ③, we ran correla- tion analysis for the variables. We selected variables of a significance level less than 0.1 for each tail (see the Table
1)1). For the logical reason that the richer the gun is, the better treatment for those injured by fire, we included local income tax and local property tax. The condition of health service should be included so we therefore selected the number of ambulance workers per 10,000 and the number of medical personnel per 10,000.
As a result of the correlation analysis, 22 independent variables were selected, these variables showing high cor- relation in comparison with similar candidate variables.
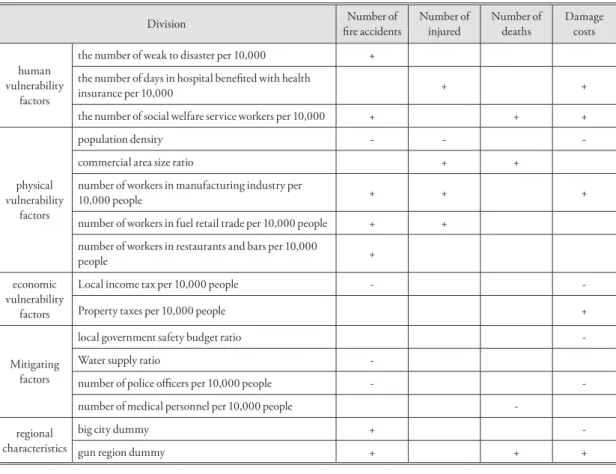
Twenty independent variables are composed in regard to fire as presented in <Table 2>. In the <Table 2>, the vulnerability factors define the variable that represent estimating the factor of increasing (+) relationship with fire damage in accordance to the previous research result.
The human vulnerability factor is the number of the weak to fire disaster per 10,000 people and is selected as a variable that includes weak people who, in the previ- ous research, were seen as aged population (over 65), preschool children, kindergarten students, elementary school students, disabled, registered foreigners and those registered as Korean by marriage. In these variables we can observe that the higher the number of the weak to disaster in a region is, the greater damage is made. Physi- cally weak people are likely to act carelessly with fire.
When a fire incident occurs, the number of victims (in- cluding deaths) may increase. The number of how many weak local residents there are (whether they are healthy or not) can be measured by the number of hospital-stay days benefited with health insurance per 10,000. This number is included in the human vulnerability factor. Also, as the number of social welfare service workers per 10,000 increases, the number of residents who will have difficul- ties in evacuation also increases. In this case, when a fire incident occurs, the number of victims (including deaths) can increase. Thus, the human vulnerability factor was selected as a variable.
Physical vulnerability factors include six variables.
In the process of analyzing the previous research, these variables were recognized to increase (+) fire damage.
Analyses on Related Factors with Fire Damage in Korea
Among physical vulnerability factors–the variable related to multi-use facilities or road condition–was a very high correlation to the “population density” variable, which led to problems while performing regression analysis.
For that reason the variable was excluded. Economic vulnerability factors consist of three variables related to fire-fighting resources and is estimated to have decreas- ing (-) impact in relations with the independent variable.
Regional characteristics are assigned as dummy variables having the value of either 1 or 0. To account regional
differentiation, big cities are selected as 1 and other local governments area are selected as 0; designating big cities as the “big cities dummy” and gun(county) region as 1, and other local government areas - “gun region dummy”
as 1.
Through the previous research review, it is estimated that the mitigating factors will be able to decrease (-) fire damage and they are applied to the all four independent variables as two factors: the common factors and death factor the latter being applied only to the death toll per Table 2. Independent variables and controlled variables
Division Name of independent variable Unit
vulnerability factors
Human factors
number of weak to disaster per 10,000 people/10,000people number of days in hospital benefited with health insurance
per 10,000 people/10,000people
number of social welfare service workers per 10,000 people/10,000people
Physical factors
population density People/administrative area size(km2)
commercial area size ratio km2/administrative area size(km2) industrial area size ratio km2/ administrative area size(km2) number of workers in manufacturing industry per 10,000
people people/10,000people
number of workers in fuel retail trade per 10,000 people people/10,000people number of workers in restaurants and bars per 10,000 people people/10,000people
Economic factors
financial independence rate km2
Local income tax per 10,000 people Thousand won/10,000 people Property taxes per 10,000 people Thousand won/10,000 people
mitigating factors
Common factors
local government safety budget ratio km2
number of fire-fighters per 10,000 people people/10,000 people number of fire stations per 10,000 people Stations/10,000 people
Water supply ratio km2
number of police officers per 10,000 people people/10,000 people number of police stations per 10,000 people Stations/10,000 people Death
factor
number of ambulance workers per 10,000 people People/10,000 people number of medical personnel per 10,000 people People/10,000 people
Local characteristics big city dummy Big city = 1
gun region dummy Gun region = 1
10,000. Among these mitigating factors (-) from the total local government budget (the fire-fighting budget or police budget, as well as natural disaster damage budget, etc.) is something called ‘local government safety budget ratio,’ and it will have negative impact (-) to fire dam- age. ‘Water supply ratio’ refers to safer areas where water is supplied to suppress fire; this will also have negative impact (-) to fire damage. Other statistics from the local government that refer to fire-fighting equipment are not available in any systematic way, but were included in the variables.
3) Basic Statistical Analysis
Four dependent variables and 22 independent vari- ables were analyzed through basic statistical analysis, Table 4 showing these results. 228 variables were collect- ed from local government data. However, the ‘number of ambulance workers,’ which are frequently published in the remaining 226 local governments, are missing from two local governments. The result of basic statisti- cal analysis excluded two dummy variables, and among the remaining 24 variables, there were a total of three variables with the minimal value 0. These three variables were examined in detail and it was observed that in the case of the dependent variable (‘number of deaths per 10,000 people’), the frequency of value 0 was 7. In the case of the independent variable (‘commercial area size ratio’), the frequency of value 0 was 1.
In the case of ‘industrial area size ratio,’ the frequency of value zero reached 31. Among the basic statistics, the
minimum value was 0.11, while the maximum value reached was 1,576,560.73. The deviation of average be- tween indicators was too big and the standard deviation occurred to be excessive, between 0.11 and 3,454,837.61.
Considering the average between indicators, as well as the result of standard deviation analysis, in the case of a linear multiple regression analysis, the likelihood that the determination coefficient (adjusted R2) would decrease was high. The value of the dependent variables was ana- lyzed through semi-log regression after being converted to natural logarithm; the dependent variables, as well as the independent variables, were all converted to the value of natural logarithm; and it was determined that there is a need to analyze them through a double-log regression analysis.
However, as there is a variable with a minimum value of 0, when the linear multiple regression analysis was performed, the sum of the degrees of freedom was 227.
And the regression analysis on the number of deaths is estimated to be reduced to 225. Also, it is considered that the dependent variables were converted to either the value of a natural logarithm or value of double-logarithm analysis. In both cases, we would have less degree of freedom as zero values in logarithm cannot be used. All the other dependent variables and independent variables were converted to the value of a natural logarithm, and while the double-log analysis was performed, the sum of the degrees of freedom is estimated to be highly reduced to 196 or 189.
In order to solve this problem, in this study, we first converted only the dependent variables to the root value Table 3. Regression analyses with methods
variables Linear semi-log double-log semi-root double-root
number of fire accidents per 10,000 people 0.708549 0.771911 0.765604 0.749238 0.751678 number of injured per 10,000 people 0.569178 0.605343 0.569482 0.594986 0.580241 number of deaths per 10,000 people 0.422394 0.490977 0.434147 0.357161 0.300175 damage costs per 10,000 people 0.280273 0.772880 0.790071 0.589574 0.625125
Analyses on Related Factors with Fire Damage in Korea
and conducted the quasi-root analysis and later. Later both the dependent variables and the independent variables were all converted to the root values and then analyzed also by the double root analysis. The most ap- propriate regression analysis methodology needs to be
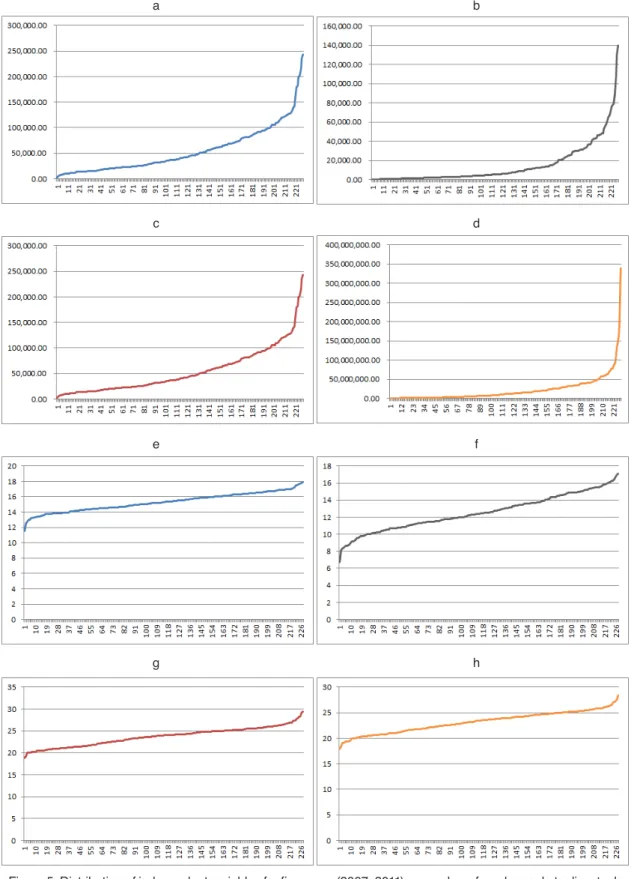
developed. It is necessary to plot the distribution of all dependent variables for the reason to have different re- gression methods, Figure 4 is for dependent variables and Figure 5 is for the examples of independent variables.
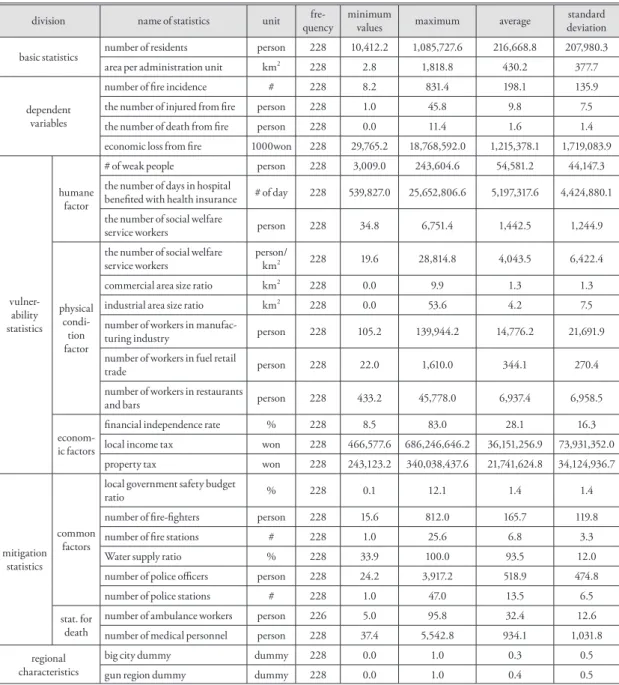
Table 4. Basic statistics for twenty-two variables
division name of statistics unit fre-
quency minimum
values maximum average standard
deviation basic statistics number of residents person 228 10,412.2 1,085,727.6 216,668.8 207,980.3
area per administration unit km2 228 2.8 1,818.8 430.2 377.7
dependent variables
number of fire incidence # 228 8.2 831.4 198.1 135.9
the number of injured from fire person 228 1.0 45.8 9.8 7.5
the number of death from fire person 228 0.0 11.4 1.6 1.4
economic loss from fire 1000won 228 29,765.2 18,768,592.0 1,215,378.1 1,719,083.9
vulner- ability statistics
humane factor
# of weak people person 228 3,009.0 243,604.6 54,581.2 44,147.3
the number of days in hospital
benefited with health insurance # of day 228 539,827.0 25,652,806.6 5,197,317.6 4,424,880.1 the number of social welfare
service workers person 228 34.8 6,751.4 1,442.5 1,244.9
physical condi-
tion factor
the number of social welfare
service workers person/
km2 228 19.6 28,814.8 4,043.5 6,422.4
commercial area size ratio km2 228 0.0 9.9 1.3 1.3
industrial area size ratio km2 228 0.0 53.6 4.2 7.5
number of workers in manufac-
turing industry person 228 105.2 139,944.2 14,776.2 21,691.9
number of workers in fuel retail
trade person 228 22.0 1,610.0 344.1 270.4
number of workers in restaurants
and bars person 228 433.2 45,778.0 6,937.4 6,958.5
econom- ic factors
financial independence rate % 228 8.5 83.0 28.1 16.3
local income tax won 228 466,577.6 686,246,646.2 36,151,256.9 73,931,352.0
property tax won 228 243,123.2 340,038,437.6 21,741,624.8 34,124,936.7
mitigation statistics
common factors
local government safety budget
ratio % 228 0.1 12.1 1.4 1.4
number of fire-fighters person 228 15.6 812.0 165.7 119.8
number of fire stations # 228 1.0 25.6 6.8 3.3
Water supply ratio % 228 33.9 100.0 93.5 12.0
number of police officers person 228 24.2 3,917.2 518.9 474.8
number of police stations # 228 1.0 47.0 13.5 6.5
stat. for death
number of ambulance workers person 226 5.0 95.8 32.4 12.6
number of medical personnel person 228 37.4 5,542.8 934.1 1,031.8
regional characteristics
big city dummy dummy 228 0.0 1.0 0.3 0.5
gun region dummy dummy 228 0.0 1.0 0.4 0.5
Eunmi Chang · Byungki Kang · Kyeong Park
Figure 4. Distribution of dependent variables for five years (2007~2011): a: number of fire incidence b: number of injured/damaged, c: number of death from fire incidence, d: economic loss from fire incidence, e: log(number
of fire incidence,2) f: log(number of injured/damaged,2), f: log(number of death from fire incidence,2), g:
a b
c d
e f
g h
Analyses on Related Factors with Fire Damage in Korea
Figure 5. Distribution of independent variables for five years (2007~2011): a: number of weak people to disaster b:
number of workers in manufacture: local income tax, d: property tax, e: log(number of weak people to disaster,2), f: log(number of workers in manufacture,2), g: log(local income tax,2), h: log(property tax,2)
a b
c d
e f
g h
4. Results and Discussions
1) Performing Regression Analysis
We performed five kinds of regression analyses be- tween four dependent variables and twenty (in case of the number of deaths: 22) independent variables accord- ing to the basic statistical analyses (Table 2). A total of 50 various regression analyses were performed and the variation in significance probability F in all regression analysis was 0.000000(<0.01), thus accepted as statisti- cally significant. According to the result of five types of the regression analyses, the semi-log analysis was found to be the most appropriate method to derive the critical factor of fire damage. In case of the dependent variable
“damage costs per 10,000 people”, the double-log analy- sis revealed the highest determination coefficient. In this case, the sum of the degrees of freedom was 196 (in case of “damage costs per 10,000 people” - 189), and the problem of excessive multi-collinearity in VIF value=10 appeared in three independent variables (the number of weak to disaster per 10,000, population density, number of police stations per 10,000 people).
According to the result of five types of analysis that are given, it is decided that the most appropriate analytic methodology to estimate fire damage is the semi-log analysis with the values of the dependent variables con- verted to the value of natural logarithm (Table 3). Thus, in this study, we decided to analyze local environment for critical factors of fire damage on the basis of semi-log analysis.
2) Deriving Critical Factors of Fire Damage
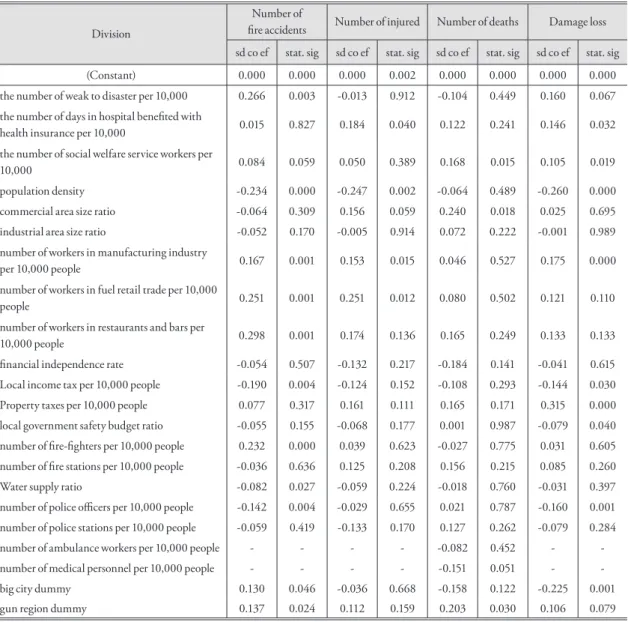
In this chapter we present the results of the analysis (Table 5) performed where semi-log analysis was applied.
We derived and summarized each local environmental factor that affects fire damage. <Table 5> presents fac-
tors affecting fire damage, rather than explaining the damage, thus non-standardized coefficients of the inde- pendent variables (B), standard deviation, t, collinearity statistics (Tolerance, VIF) are omitted. In all analysis the VIF value was below 10, thus the problem of multi- collinearity between the independents variables did not exist. As a result, from the total of 20 local environmental factors of local governments that are influential, 12 vari- ables were derived as critical. Firstly, In case of human vulnerability factors, ‘the number of weak to disaster per 10,000,’ was statistically significant on the level smaller 0.003 to 0.05, thus is included in the 95% significance level. However, ‘the number of social welfare service workers per 10,000’ was statistically significant on 0.059 to 0.05, higher than 0.1. Thus it seems that this variable can be included in the 90% significance level (table 5).
In case of the physical vulnerability factors, ‘popula- tion density,’‘number of workers in manufacturing industry per 10,000 people,’ ‘number of workers in fuel retail trade per 10,000 people,’ and ‘number of workers in restaurants and bars per 10,000 people’ are significant variables. The economic vulnerability factor, ‘local in- come tax per 10,000 people’ was statistically significant, and regional characteristics–‘big city dummy,’ ‘gun re- gion dummy’–were also statistically significant. Among mitigating factors, ‘water supply ratio’ appeared to be statistically significant. The ‘number of fire-fighters per 10,000 people’ was significant on the level 0.000(<0.05).
However, it is hard to see the number of fire-fighters as significant variable, because it is difficult to state a causal relationship between number of fire-fighters and the number of fire accidents.
Taking into consideration the results above, as the
‘number of weak to disaster per 10,000,’ the ‘number of social welfare service workers per 10,000,’ the ‘number of workers in manufacturing industry per 10,000 people,’
the ‘number of workers in fuel retail trade per 10,000 people,’ and the ‘number of workers in restaurants and bars per 10,000 people’ increases, the probability of fire
Analyses on Related Factors with Fire Damage in Korea
accident occurrence per 10,000 people increases in the big city region and gun region in the local governmental areas. Contrarily, within the same situation, as other vari- ables (‘population density,’ ‘Water supply ratio,’ ‘number of police officers per 10,000 people’) decrease, fire acci- dent occurrence per 10,000 people increases even more.
When each local government is observed, the fire damage in big city area is bigger than in other areas,
and in gun areas the fire damage is lower than in other areas (see the last two columns in Table 5). On the other hand, ‘population density,’ ‘local income tax per 10,000 people,’ ‘local government safety budget ratio,’ ‘number of police officers per 10,000 people’ influence damage loss per 10,000 people at a higher rate, as the local gov- ernment is smaller.
Also, among 10 factors that influence damage loss per
Table 5. Significances of analyses (sd co ef.: standardized coefficients. stat. sig: statistical significance) Division
Number of
fire accidents Number of injured Number of deaths Damage loss sd co ef stat. sig sd co ef stat. sig sd co ef stat. sig sd co ef stat. sig
(Constant) 0.000 0.000 0.000 0.002 0.000 0.000 0.000 0.000
the number of weak to disaster per 10,000 0.266 0.003 -0.013 0.912 -0.104 0.449 0.160 0.067 the number of days in hospital benefited with
health insurance per 10,000 0.015 0.827 0.184 0.040 0.122 0.241 0.146 0.032 the number of social welfare service workers per
10,000 0.084 0.059 0.050 0.389 0.168 0.015 0.105 0.019
population density -0.234 0.000 -0.247 0.002 -0.064 0.489 -0.260 0.000 commercial area size ratio -0.064 0.309 0.156 0.059 0.240 0.018 0.025 0.695 industrial area size ratio -0.052 0.170 -0.005 0.914 0.072 0.222 -0.001 0.989 number of workers in manufacturing industry
per 10,000 people 0.167 0.001 0.153 0.015 0.046 0.527 0.175 0.000
number of workers in fuel retail trade per 10,000
people 0.251 0.001 0.251 0.012 0.080 0.502 0.121 0.110
number of workers in restaurants and bars per
10,000 people 0.298 0.001 0.174 0.136 0.165 0.249 0.133 0.133
financial independence rate -0.054 0.507 -0.132 0.217 -0.184 0.141 -0.041 0.615 Local income tax per 10,000 people -0.190 0.004 -0.124 0.152 -0.108 0.293 -0.144 0.030 Property taxes per 10,000 people 0.077 0.317 0.161 0.111 0.165 0.171 0.315 0.000 local government safety budget ratio -0.055 0.155 -0.068 0.177 0.001 0.987 -0.079 0.040 number of fire-fighters per 10,000 people 0.232 0.000 0.039 0.623 -0.027 0.775 0.031 0.605 number of fire stations per 10,000 people -0.036 0.636 0.125 0.208 0.156 0.215 0.085 0.260 Water supply ratio -0.082 0.027 -0.059 0.224 -0.018 0.760 -0.031 0.397 number of police officers per 10,000 people -0.142 0.004 -0.029 0.655 0.021 0.787 -0.160 0.001 number of police stations per 10,000 people -0.059 0.419 -0.133 0.170 0.127 0.262 -0.079 0.284
number of ambulance workers per 10,000 people - - - - -0.082 0.452 - -
number of medical personnel per 10,000 people - - - - -0.151 0.051 - -
big city dummy 0.130 0.046 -0.036 0.668 -0.158 0.122 -0.225 0.001
gun region dummy 0.137 0.024 0.112 0.159 0.203 0.030 0.106 0.079