193 http://dx.doi.org/10.4196/kjpp.2012.16.3.193
ABBREVIATIONS: TC, tuberculous colitis; UC, ulcerative colitis;
2-DE, 2-dimentional elextrophoresis; IBD, inflammatory bowel disease;
CD, crohn’s disease; MS, mass spectrometry; MALDI TOF/TOF, matrix-assisted laser desorption ionization time-of-flight/time-of- flight spectrometry; EDTA, ethylenediaminetetraacetic acid; H&E, hematoxylin & eosin; CHAPS, 3-[(3-cholamidopropyl)dimethylammo- nio]-1-propanesulfonate; IPG, immobilized pH gradient; IEF, isoelec- tric focusing; SDS, sodium dodecyl sulfate; ACN, acetonitrile; DDT, dichloro-diphenyl-trichloro-ethane; TFA, trifluoroacetic acid; MS, mass spectrometry, CID, channel iron deposits; PAGE, polyacrylamide gel electrophoresis; CRTH2, chemoattractant receptor of T 2 cells.
Received March 15, 2012, Revised May 21, 2012, Accepted June 8, 2012
Corresponding to: Koon Hee Han, Department of Internal Medicine, University of Ulsan College of Medicine, Gangneung Asan Hospital, 415, Bangdong-li, Sacheon-myon, Gangneung 210-711, Korea. (Tel) 82-33-610-3133, (Fax) 82-33-641-8130, (E-mail) [email protected]
*These authors contributed equally to this work.
This is an Open Access article distributed under the terms of the Creative Commons Attribution Non-Commercial License (http://
creativecommons.org/licenses/by-nc/3.0) which permits unrestricted non-commercial use, distribution, and reproduction in any medium, provided the original work is properly cited.
Proteomic Analysis of Colonic Mucosal Tissue from Tuberculous and Ulcerative Colitis Patients
Seong-Chun Kwon1,*, Kyung Jong Won2,*, Seoung Hyo Jung2, Kang Pa Lee2, Dong-Youb Lee2, Eun-Seok Park2, Bokyung Kim2, Gab Jin Cheon3, and Koon Hee Han3
1Department of Physiology, Kwandong University College of Medicine, Gangneung 210-701, 2Department of Physiology, School of Medicine, Konkuk University, Chungju 380-701, 3Department of Internal Medicine, University of Ulsan College of Medicine, Gangneung Asan Hospital, Gangneung 210-711, Korea
Changes in the expression profiles of specific proteins leads to serious human diseases, including colitis. The proteomic changes related to colitis and the differential expression between tuberculous (TC) and ulcerative colitis (UC) in colon tissue from colitis patients has not been defined. We therefore performed a proteomic analysis of human TC and UC mucosal tissue. Total protein was obtained from the colon mucosal tissue of normal, TC, and UC patients, and resolved by 2-dimensional electrophoresis (2-DE). The results were analyzed with PDQuest using silver staining. W e used matrix-assisted laser desorption ionization time-of-flight/time-of-flight spectrometry (MALDI TOF/TOF) to identify proteins differentially expressed in TC and UC. Of the over 1,000 proteins isolated, three in TC tissue and two in UC tissue displayed altered expression when compared to normal tissue. Moreover, two proteins were differentially expressed in a comparative analysis between TC and UC. These were identified as mutant β-actin, α-enolase and Charcot-Leyden crystal protein. In particular, the expression of α- enolase was significantly greater in TC compared with normal tissue, but decreased in comparison to UC, implying that α-enolase may represent a biomarker for differential diagnosis of TC and UC.
This study therefore provides a valuable resource for the molecular and diagnostic analysis of human colitis.
Key Words: Colitis, Tuberculous, Ulcerative, MALDI, Proteomics
INTRODUCTION
Colitis is a human inflammatory disease caused by a va- riety of factors including infection, reduced blood supply, and inflammatory bowel disease (IBD) [1]. Tuberculous col- itis (TC), an extrapulmonary tuberculosis, is a rare chronic disease present in immunosuppressed patients and indivi- duals from developing countries. TC is similar to Crohn’s disease (CD) in terms of its pathological and roentgeno- graphical findings [2,3]. In this disease, colonoscopy shows characteristic mucosal changes including mucosal nodules and ulcers [3]. Ulcerative colitis (UC) is associated with pathological mucosal damage and ulceration of the colon with general inflammatory processes [4]. UC belongs to a
type of IBD along with Crohn’s disease [4]. Although nu- merous studies have attempted to reduce and treat UC and TC occurrences, their precise pathogenesis remains unclear.
Further studies are therefore required to improve our path- ophysiological understanding of colitis and for the develop- ment of novel therapeutic targets.
The relative levels of cellular proteins have a direct effect on disease initiation and progression. Hence, an under- standing of protein expression and modification is crucial for the identification of the key cellular pathways and func- tional modulators associated with colitis. Proteomics is use- ful for the identification of proteins involved in various pathophysiological conditions and for developing strategies related to disease progression [5-7]. This technology in- volves the use of several experimental methods, including 2-dimensional electrophoresis (2-DE) and mass spectrome-
try (MS), to isolate and identify changes in protein ex- pression and modification under defined conditions, such as disease or drug treatments [8-10]. Previous studies used proteomics to elucidate the changes in the host cell pro- teome between both UC and normal colon mucosa and CD and UC [11,12]. However, to our knowledge no full proteo- mic analysis of the colonic mucosa tissue of TC and UC patients has been conducted. In the present study, we aimed to identify proteomic alterations in mucosal TC and UC tissue in comparison to healthy colon tissue using 2-DE and matrix-assisted laser desorption ionization time-of-flight/
time-of-flight spectrometry (MALDI TOF/TOF). Further- more, we performed a comparative analysis of TC and UC to clarify the diagnostic classifications of these diseases.
METHODS Materials
Materials for 2-DE and MS were purchased from BioRad (Hercules, CA, USA) or Applied Biosystems (Foster City, CA, USA).
Preparation of mucosal tissue from colitis patients All experiments were performed in accordance with the institutional guidelines of Ulsan University and were ap- proved by the Institutional Review Board of Ulsan Univer- sity Gangneung Asan Hospital, Gangneung-city, Korea.
Mucosal tissue samples from normal volunteers (n=6) and patients with TC (n=6) and UC (n=6) were removed by co- lonic biopsy or mucosal resection and rinsed in physiological salt solution (in mM; NaCl 136.9, KCl 5.4, CaCl2 1.5, MgCl2
1.0, NaHCO3 23.8, EDTA 0.01). Samples were then snap- frozen in liquid N2 for proteomic analyses.
Measurement of morphological changes
Isolated tissue was fixed in 4% paraformaldehyde and embedded in paraffin for histological analysis. Tissues were sliced into 6∼8 μm-thick sections, and stained using hema- toxylin and eosin (H&E). Images were captured using a con- focal microscope (FV-1000 spectral, Olympus, Japan).
Two-dimensional electrophoresis
Isolated colon tissue was homogenized in 2-DE lysis buf- fer (8 M urea, 2 M thiourea, 65 mM dithiothreitol, 2%
CHAPS, and 1× complete protease inhibitor cocktail) (Roche Applied Science, Germany) and centrifuged at 12,000× g for 10 min at 10oC. Supernatants were harvested and the samples diluted in rehydration buffer containing 8 M urea, 0.28% dithiothreitol, 0.5% CHAPS, 10% glycerol, 0.5% ap- propriate ampholyte, and 0.002% bromophenol blue. IPG strips (pH 3∼10 nonlinear) were rehydrated at 50 V for 12 h at 20oC in 120 μg of whole cell protein extract. IEF was performed sequentially using a Bio-Rad Protein IEF Cell at 100 V for 2 h, 250 V for 1 h, 500 V for 1 h, 1,000 V for 1 h, 3,000 V for 1 h, 5,000 V for 1 h, and 8,000 V for 9 h at 20oC. Following IEF, individual strips were equili- brated for 20 min in 10 ml of equilibration buffer containing 50 mM Tris-HCl (pH 6.8), 6 M urea, 20% glycerol, 2% so- dium dodecyl sulfate (SDS), 0.01% bromophenol blue, and 5 mM tributylphosphine. Second-dimension separation was
performed on 12% SDS-polyacrylamide gels at 30 V for 1 h followed by 80 V until the bromophenol blue dye reached the bottom of the gel. To visualize proteins, gels were fixed with 50% methanol, 12% acetic acid for 1 h, and washed twice for 20 min in 50% ethanol. Gels were then sensitized for 1 min in 0.02% Na2S2O3 followed by washing three times for 20 sec in distilled water. Gels were labeled with 0.2%
silver nitrate solution containing 0.075% formaldehyde for 20 min, and rinsed twice in distilled water. Development was performed in 0.0002% Na2S2O3, 0.025% formaldehyde, and 3% Na2CO3 for 10 mins. The reaction was terminated by addition of 1.5% EDTA. Gels were silver-stained and vi- sualized using a densitometer (Versa Doc Imaging System 1000TM; Bio-Rad). The densities of silver-stained spots from three different experimental sets were detected and counted by both automation and manual spot-detection, and statistically analyzed using PDQuest software (version 7.1.1, Bio-Rad).
In-gel digestion and mass spectrometry
Protein spots were excised from silver-stained gels and destained with freshly prepared 15 mM K3[Fe(CN)6]/50 mM Na2S2O3 for 10 min. Gel pieces were then washed three times with distilled water for 15 min at room temperature.
After dehydrating the spot with ACN for 15 min, each spot was dried in a SpeedVac centrifuge for 10 min. Samples were then reduced with DTT and subsequently alkylated with iodoacetamide in a dark chamber. The gel pieces were washed three times with distilled water for 15 min, dehy- drated with ACN for 15 min, and dried in a SpeedVac cen- trifuge for 10 min. Proteins were then digested overnight in 20-μl digestion buffer (12.5 ng/μl trypsin in 20 mM NH4HCO3) at 37oC for a minimum of 16 h. Peptide samples were extracted three times with 50 μl of 50% ACN/0.1%
formic acid and dried in a SpeedVac centrifuge. Extracts were resuspended in 10 μl of 0.5% TFA, and desalted using ZipTip C18 microtips (Millipore, Billerica, MA, USA), ac- cording to the manufacturer’s instructions. Peptide samples were eluted in 2 μl of α-cyano-4 hydroxycinnamic acid sol- ution prepared in 50% ACN/0.5% TFA, and 0.5 μl was load- ed onto stainless steel sample target plates. Peptide mass spectra were acquired using a MALDI-TOF/TOF mass spec- trometer (AB4700, Applied Biosystems) in the positive ion reflector mode. For precursor ion selection, all fractions were measured by single MS prior to MS/MS. The 10 most-abundant precursor ions per sample were selected for subsequent fragmentation by high-energy CID. The colli- sion energy was set to 1 keV and air was used as the colli- sion gas. The criterion for precursor selection was a mini- mum signal-to-noise ratio of 20. The mass accuracy was within 100 ppm of the mass measurement and within 0.2 Da for CID experiments. Other search parameters were:
trypsin, one missed cleavage, variable modification of car- bamidomethyl, oxidation, propionamide and pyro-glu (N-term), peptide charge of 1+ and monoisotopic. Spectra were processed and analyzed using the Global Protein Server Explorer 3.0 software (Applied Biosystems). We used internal MASCOT (Matrix Science, London, UK) pro- grams to match MS and MS/MS data against the database information. The data obtained were screened against rat databases downloaded from both NCBI (http://www.ncbi.
nlm.nih.gov) and the Swiss-Prot/TrEMBL homepage (http://
www.expasy.ch/sprot).
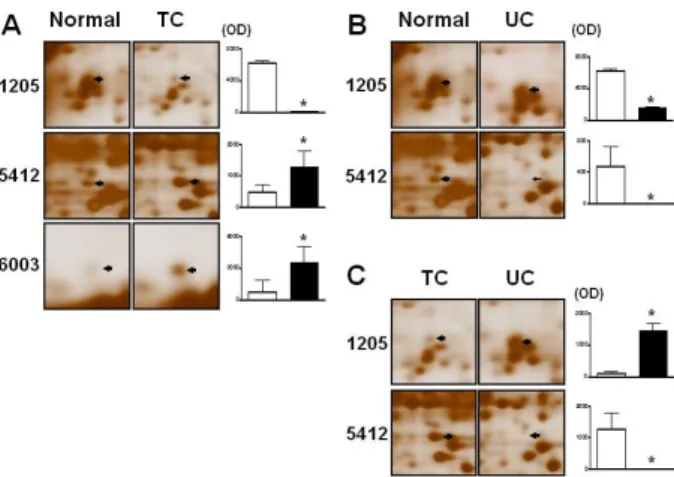
Fig. 3. Silver-stained 2-DE images of proteins differentially expressed in tuberculous and ulcerative colitis patients. Enlarged images of proteins found to be differentially expressed by silver- stained 2-DE from Fig. 1. Arrows indicate spots downregulated or upregulated and numbers correspond to the spot numbers shown in Table 1. Graphs show numerical data obtained from images in the left panel. Data were analyzed using the PDQuest software (n=3) *p<0.05 normal tissue vs. TC or UC tissues. TC, tuberculous colitis; UC, ulcerative colitis; OD, optical density.
Fig. 1. Muscosal tissue changes in normal, tuberculous and ulcerative colitis patients. Mucosa tissue was visualized using H&E staining.
Arrows and arrow heads in TC show multinucleated giant cells and granuloma with necrosis, UC show crypt abscess, respectively.
Fig. 2. Silver-stained 2-DE gels of the colonic proteome of normal, tuberculous and ulcerative colitis patients. Proteins from the colonic mucosa of patients were loaded on IPG pH 3∼10 nonlinear (NL) strips and separated by 12% (w/v) polyacrylamide SDS-PAGE.
Protein spots were visualized by silver staining. Arrows and num- bers correspond to Table 1. 2-DE, 2-dimensional electrophoresis;
SDS-PAGE, sodium dodecyl sulfate-polyacrylamide gel electropho- resis; TC, tuberculous colitis; UC, ulcerative colitis.
Data analyses
Data are expressed as the means±standard errors.
Student’s t-test was used for data comparisons. A value of p<0.05 was considered to indicate statistical significance.
RESULTS Morphological characteristics of colitis
To confirm the morphological changes observed during colitis, the histology of colonic mucosal tissue from the nor- mal, TC and UC groups were compared using H&E staining. TC group tissues exhibited typical multinucleated giant cells and granuloma with necrosis. UC group show crypt abscess, respectively (Fig. 1).
Proteomic profiles of normal, TC and UC tissue Proteomic analysis was used to investigate changes in the cellular proteome during colitis. Total proteins isolated from the colonic mucosal tissue of the normal, TC and UC groups were focused on non-linear IPG strips (pH 3∼10), separated by 12% SDS-polyacrylamide gel electrophoresis (PAGE), and visualized by silver staining. Protein spots were analyzed using the PDQuest software. The average matching ratios were approximately 76∼82% within groups and 67∼70% between groups. More than 1,000 proteins were detected per silver-stained gel. Moreover, the ex- pression profiles of TC and UC mucosa were similar com- pared to healthy tissue (Fig. 2).
Comparative analysis of differentially expressed proteins To further compare the protein spots on 2-DE gels, we compared TC and UC colonic mucosal protein gels to those
of normal mucosa. Three protein spots showed differential expression in the TC tissue compared with healthy controls (Fig. 2, 3). Of these, spots 5412 and 6003 showed increased expression, whilst that of spot 1205 decreased (Table 1; Fig.
3A). Two protein spots were differentially expressed in UC and normal colonic mucosal tissue (Fig. 3B). These spots, 1205 and 5412, were weakly expressed in UC compared with the normal mucosa (Table 1).
Differential protein expression between mucosal TC and UC tissue
We next compared the protein spot changes between TC and UC mucosa. Two protein spots were differentially ex- pressed; spot 5412 showed low expression in UC mucosa compared with TC (Table 1; Fig. 3C), whilst spot 1205 was
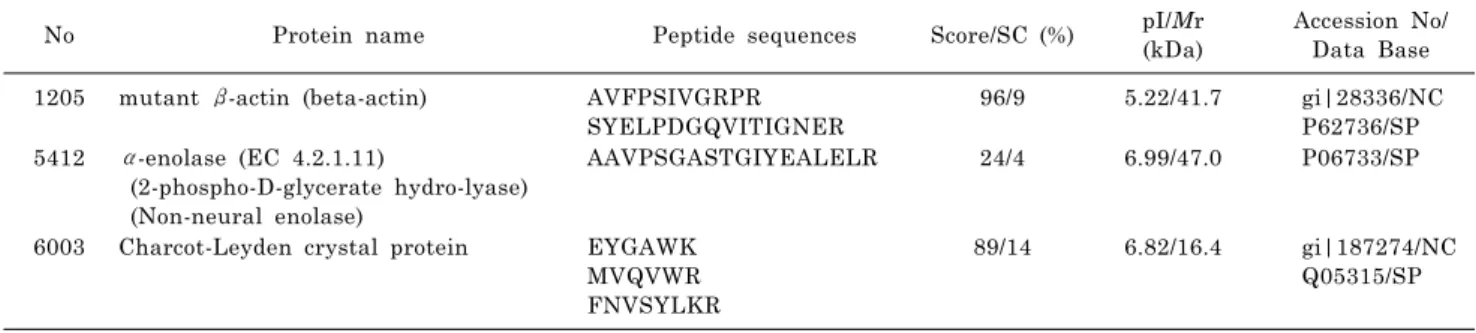
Table 2. Summary of proteins prominently expressed in human colitis as identified by MALDI-TOF/TOF. The names of the proteins, pI and Mr values, accession numbers in both the NCBI (NC) and SWISS-PROT (SP) databases, probability score (Score), and the sequence coverage (SC), peptides representative of the identified sequences are presented. MALDI TOF/TOF; matrix-assisted laser desorption/ionization time of flight
No Protein name Peptide sequences Score/SC (%) pI/Mr
(kDa)
Accession No/
Data Base 1205 mutant β-actin (beta-actin) AVFPSIVGRPR
SYELPDGQVITIGNER 96/9 5.22/41.7 gi|28336/NC
P62736/SP 5412 α-enolase (EC 4.2.1.11)
(2-phospho-D-glycerate hydro-lyase) (Non-neural enolase)
AAVPSGASTGIYEALELR 24/4 6.99/47.0 P06733/SP
6003 Charcot-Leyden crystal protein EYGAWK MVQVWR FNVSYLKR
89/14 6.82/16.4 gi|187274/NC Q05315/SP Table 1. Differential expression of colitic mucosal protein from
tuberculous and ulcerative colitis patients compared with normal condition
No Normal
(OD)
Tuberculous colitis (OD)
Ulcerative colitis (OD)
1205 6224.3 3.6* 1452.0*,#
5412 471.4 1276.4* 5.1*,#
6003 760.5 3510.6* 966.7
*p<0.05 normal tissue vs tuberculous colitis or ulcerative colitis. #p<0.05 tuberculous colitis vs ulcerative colitis.
Fig. 4. MALDI MS/MS spectra of proteins from the mucosal tissue of colitic patients. Spectra of A (mutant β-actin), B (α-enolase), and C (Char- cot-Leyden crystal protein) were obtained using MALDI TOF/TOF.
expressed at lower levels in TC compared to UC mucosa (Table 1).
Identification of proteins associated with colitis We next sought to identify the nature of the differentially expressed protein spots by MALDI-TOF/TOF analysis.
Protein spots 1205, 5412, 6003 were identified as mutant
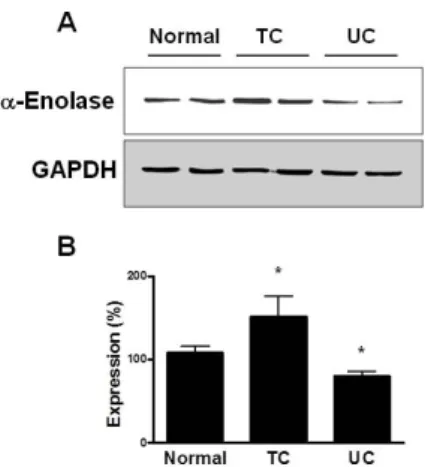
β-actin, α-enolalse, and charcot-Leyden cystal protein, re- spectively (Table 2), implying their association with colitis pathogenesis. Fig. 4 shows the MALDI MS/MS spectra of these proteins in the mucosal tissue of colitic patients. We additionally confirmed the expression of α-enolase in mu- cosal tissue from TC and UC samples by immunoblot analysis. The expression levels of α-enolase were signifi- cantly higher in TC compared with normal tissue, but were lower in UC mucosal tissue (Fig. 5).
DISCUSSION
In this study, we identified proteins differentially ex- pressed in colonic mucosal tissues from UC and TC pa- tients, compared with those from the normal colon. More than 1,000 proteins were detected on silver-stained gels of whole protein extracts from each mucosal sample. The ex- pression of three protein spots differed between TC tissue and normal controls; two (5412, 6003) displayed increased expression, while one (1205) exhibited decreased levels. In a comparison of normal and UC tissue, two protein spots
Fig. 5. Expression of α-enolase in human TC and UC mucosal tissue. (A) Western blot analysis was performed to determine α- enolalse expression in mucosal tissues from TC and UC patients.
(B) Statistical data were obtained from the upper panel. Expression levels in normal tissue are expressed as 100% (n=4). TC, tuberculous colitis; UC, ulcerative colitis.
displayed decreased expression. These results imply that protein changes are common in colitic mucosa and that these altered pathways may be closely related to the occur- rence or development of UC and TC [11]. A previous proteo- mic analysis of UC and normal colon mucosa suggested dif- ferential expression profiles in CD and UC tissues [12].
Thus, proteomic analysis is a powerful tool that can provide new insights into the pathogenesis of various systemic dis- eases, including intestinal inflammation, allowing the iden- tification of potential targets for novel therapeutic drugs.
The symptoms and signs of TC are vague and nonspecific.
Nonspecific chronic abdominal pain is the most common complaint, occurring in 80 to 90% of TC patients [13].
Anorexia, fatigue, fever, night sweats, weight loss, diar- rhea, constipation, or blood in the stools may be present [14]. Patients with UC display fever, abdominal pain, weight loss, and bloody stools [14,15]. For therapeutic and prognostic purposes, these symptoms are typically classi- fied as mild, moderate, or severe. The severity of these symptoms often correlates with the anatomical extent of the disease, parameters that will ultimately guide therapy.
The Mayo scoring system has been used both to judge dis- ease severity and monitor patients during therapy [16].
Colonoscopic findings of TC are varied, and include ulcers, strictures, nodules, pseudopolyps, fibrous bands, fistulas and deformed ileocecal valves [17]. The main differential diagnosis at endoscopy is CD [2]. This distinction is im- portant as the use of steroids for the misdiagnosis of CD may lead to disastrous consequences in patients with TC enteritis [18]. The colonoscopic findings of UC include a loss of vascular marking, petechiae, exudates, touch friability, and frank hemorrhage [4]. In the advanced stages of UC and TC, the clinical manifestations and colonoscopic find- ings differ to such an extent that they can be easily differ- entiated [3]. However, in the early stages of UC and TC, differential diagnosis is difficult as both the clinical mani- festations and colonoscopic findings are similar. New diag- nostic strategies to clarify the diagnosis are therefore required. In this study, we demonstrate that α-enolase (Spot 5412) levels decrease in UC mucosa compared with normal mucus, and increase in TC compared with normal
tissue. Consistent with this finding, it has been reported that α-enolase mRNA levels are upregulated in IBD [19]
and down-regulated at the protein level in UC [20].
Moreover, α-enolase reactive antibodies were found in ap- proximately 10% of patients with UC [21]. High concen- trations of α-enolase have been reported in the cere- brospinal fluid and strongly correlated to astrocytoma [22].
Increased levels of α-enolase were also identified in pa- tients suffering from recent myocardial infarction or cere- brovascular accidents [23,24], implying a prognostic value for α-enolase levels. These results indicate this protein may be related to the pathological events of colitis. Furthermore, α-enolase displayed increased expression levels in TC com- pared to UC, which was upregulated three-fold in TC com- pared with normal tissue. Therefore, this protein may play a more important role in TC pathophysiology, implicating it as an important biomarker candidate for the differential diagnostic classification of UC and TC, and as a therapeutic target for colitis.
We additionally identified the differential expression of Charcot-Leyden crystal protein and mutant β-actin, both of which were increased in TC. Charcot-Leyden crystals protein is a hallmark of eosinophilic inflammatory reactions such as asthma and parasitic infection, and is often present in inflamed tissue and patients with allergies [25]. Although its overall biological function is unknown, it possesses lyso- phospholipase activity and displays genomic similarity with galectin-10 [26]. Several reports suggest that phospholi- pases and galectins are strongly related to colitis pro- gression in a variety of cells, and Charcot-Leyden crystal protein represents a biomarker of CRTH2 activation in the blood [27,28]. In addition, actin plays a central role in cell motility, including cytokinesis, cell locomotion, exocytosis and endocytosis, through formation of the actin cytoskele- ton. Actin mutations are related to physiological functions and disorders in a variety of cells [29,30]. Moreover, the mutant β-actin resulted from a single amino acid exchange resulting in high β-actin levels that induced diminution of the myoblast cell surface [31]. From these results, the mu- cosal proteins Charcot-Leyden crystal and mutant β-actin, represent a marker of TC and UC.
In conclusion, we identified three proteins in TC and two in UC whose levels were altered compared to normal tissue.
Two of these proteins were differentially expressed between TC and UC. The expression of α-enolase were significantly increased in TC but decreased in UC compared with the normal mucosa. These findings suggest a valuable resource for the molecular analysis of the pathophysiology of human colitis and new biomarkers for the differential diagnosis of TC and UC.
REFERENCES
1. Horn AE, Ufberg JW. Appendicitis, diverticulitis, and colitis.
Emerg Med Clin North Am. 2011;29:347-368.
2. Rasheed S, Zinicola R, Watson D, Bajwa A, McDonald PJ.
Intra-abdominal and gastrointestinal tuberculosis. Colorectal Dis. 2007;9:773-783.
3. Brenner SM, Annes G, Parker JG. Tuberculous colitis simula- ting nonspecific granulomatous disease of the colon. Am J Dig Dis. 1970;15:85-92.
4. Danese S, Fiocchi C. Ulcerative colitis. N Engl J Med. 2011;
365:1713-1725.
5. Page MJ, Amess B, Rohlff C, Stubberfield C, Parekh R.
Proteomics: a major new technology for the drug discovery
process. Drug Discov Today. 1999;4:55-62.
6. Mayr U, Mayr M, Yin X, Begum S, Tarelli E, Wait R, Xu Q.
Proteomic dataset of mouse aortic smooth muscle cells.
Proteomics. 2005;5:4546-4557.
7. Pinet F, Poirier F, Fuchs S, Tharaux PL, Caron M, Corvol P, Michel JB, Joubert-Caron R. Troponin T as a marker of diffe- rentiation revealed by proteomic analysis in renal arterioles.
FASEB J. 2004;18:585-586.
8. Won KJ, Lee P, Jung SH, Jiang X, Lee CK, Lin HY, Kang H, Lee HM, Kim J, Toyokuni S, Kim B. 3-morpholinosydnonimine participates in the attenuation of neointima formation via inhibition of annexin A2-mediated vascular smooth muscle cell migration. Proteomics. 2011;11:193-201.
9. Lee CK, Han JS, Won KJ, Jung SH, Park HJ, Lee HM, Kim J, Park YS, Kim HJ, Park PJ, Park TK, Kim B. Diminished expression of dihydropteridine reductase is a potent biomarker for hypertensive vessels. Proteomics. 2009;9:4851-4858.
10. Lee CK, Kim HJ, Lee YR, So HH, Park HJ, Won KJ, Park T, Lee KY, Lee HM, Kim B. Analysis of peroxiredoxin decrea- sing oxidative stress in hypertensive aortic smooth muscle.
Biochim Biophys Acta. 2007;1774:848-855.
11. Hsieh SY, Shih TC, Yeh CY, Lin CJ, Chou YY, Lee YS.
Comparative proteomic studies on the pathogenesis of human ulcerative colitis. Proteomics. 2006;6:5322-5331.
12. Shkoda A, Werner T, Daniel H, Gunckel M, Rogler G, Haller D. Differential protein expression profile in the intestinal epithelium from patients with inflammatory bowel disease. J Proteome Res. 2007;6:1114-1125.
13. Nagar AB. Isolated colonic ulcers: diagnosis and management.
Curr Gastroenterol Rep. 2007;9:422-428.
14. Kühbacher T, Schreiber S, Fölsch UR. Ulcerative colitis:
conservative management and long-term effects. Langenbecks Arch Surg. 2004;389:350-653.
15. Minami M, Hasegawa T, Ando T, Maeda O, Ohkura T, Ohta M, Goto H. Post-colonoscopic Listeria septicemia in ulcerative colitis during immunosuppressive therapy. Intern Med. 2007;46:
2023-2027.
16. Schroeder KW, Tremaine WJ, Ilstrup DM. Coated oral 5-aminosalicylic acid therapy for mildly to moderately active ulcerative colitis. A randomized study. N Engl J Med. 1987;317:
1625-1629.
17. Alvares JF, Devarbhavi H, Makhija P, Rao S, Kottoor R. Clinical, colonoscopic, and histological profile of colonic tuberculosis in a tertiary hospital. Endoscopy. 2005;37:351-356.
18. Kapoor VK. Abdominal tuberculosis. Postgrad Med J. 1998;74:
459-467.
19. Vermeulen N, Arijs I, Joossens S, Vermeire S, Clerens S, Van den Bergh K, Michiels G, Arckens L, Schuit F, Van Lommel
L, Rutgeerts P, Bossuyt X. Anti-alpha-enolase antibodies in patients with inflammatory Bowel disease. Clin Chem. 2008;54:
534-541.
20. Zhao X, Kang B, Lu C, Liu S, Wang H, Yang X, Chen Y, Jiang B, Zhang J, Lu Y, Zhi F. Evaluation of p38 MAPK pathway as a molecular signature in ulcerative colitis. J Proteome Res.
2011;10:2216-2225.
21. Roozendaal C, Zhao MH, Horst G, Lockwood CM, Kleibeuker JH, Limburg PC, Nelis GF, Kallenberg CG. Catalase and alpha-enolase: two novel granulocyte autoantigens in inflamma- tory bowel disease (IBD). Clin Exp Immunol. 1998;112:10-16.
22. Royds JA, Timperley WR, Taylor CB. Levels of enolase and other enzymes in the cerebrospinal fluid as indices of pathological change. J Neurol Neurosurg Psychiatry. 1981;44:1129-1135.
23. Roine RO, Somer H, Kaste M, Viinikka L, Karonen SL.
Neurological outcome after out-of-hospital cardiac arrest. Pre- diction by cerebrospinal fluid enzyme analysis. Arch Neurol.
1989;46:753-756.
24. Hay E, Royds JA, Davies-Jones GA, Lewtas NA, Timperley WR, Taylor CB. Cerebrospinal fluid enolase in stroke. J Neurol Neurosurg Psychiatry. 1984;47:724-729.
25. Grigoriadis G, Anderson MA, Whitehead S. Charcot-Leyden crystals. Intern Med J. 2010;40:792.
26. Di Sabatino A, Battista N, Biancheri P, Rapino C, Rovedatti L, Astarita G, Vanoli A, Dainese E, Guerci M, Piomelli D, Pender SL, MacDonald TT, Maccarrone M, Corazza GR. The endogenous cannabinoid system in the gut of patients with inflammatory bowel disease. Mucosal Immunol. 2011;4:574-583.
27. Ackerman SJ, Liu L, Kwatia MA, Savage MP, Leonidas DD, Swaminathan GJ, Acharya KR. Charcot-Leyden crystal protein (galectin-10) is not a dual function galectin with lysophospho- lipase activity but binds a lysophospholipase inhibitor in a novel structural fashion. J Biol Chem. 2002;277:14859-14868.
28. Lin TA, Kourteva G, Hilton H, Li H, Tare NS, Carvajal V, Hang JS, Wei X, Renzetti LM. The mRNA level of Charcot-Leyden crystal protein/galectin-10 is a marker for CRTH2 activation in human whole blood in vitro. Biomarkers. 2010;15:646-654.
29. Fujita M, Ichinose S, Kiyono T, Tsurumi T, Omori A. Establish- ment of latrunculin-A resistance in HeLa cells by expression of R183A D184A mutant beta-actin. Oncogene. 2003;22:627-631.
30. Nunoi H, Yamazaki T, Tsuchiya H, Kato S, Malech HL, Matsuda I, Kanegasaki S. A heterozygous mutation of beta- actin associated with neutrophil dysfunction and recurrent infection. Proc Natl Acad Sci USA. 1999;96:8693-8698.
31. Schevzov G, Lloyd C, Gunning P. High level expression of transfected beta- and gamma-actin genes differentially impacts on myoblast cytoarchitecture. J Cell Biol. 1992;117:775-785.