Insulin resistance, which implies impairment of insulin signaling in the target tissues, is a common cause of type 2 diabetes. Adipose tissue plays an important role in insulin resistance through the dysregulated production and secretion of adipose-derived proteins, including tumor necrosis factor- ,α plasminogen activator inhibitor-1, leptin, resistin, angioten- sinogen, and adiponectin. Adiponectin was estimated to be a protective adipocytokine against atherosclerosis, and also to have an anti-inflammatory effect. In this study, the relationship between fasting plasma adiponectin concentration and adi- posity, body composition, insulin sensitivity (ITT, HOMAIR, QUICK), lipid profile, fasting insulin concentration were examined in Korean type 2 diabetes. The difference in the adiponectin concentrations was also examined in diabetic and non-diabetic subjects, with adjustment for gender, age and body mass index. 102 type 2 diabetics and 50 controls were examined. After a 12-h overnight fast, all subjects underwent a 75gram oral glucose tolerance test. Baseline blood samples were drawn for the determinations of fasting plasma glucose, insulin, adiponectin, total cholesterol, triglyceride, LDL-cho- lesterol, and HDL-cholesterol. The body composition was estimated using a bioelectric impedance analyzer (Inbody 2.0).
The insulin sensitivity was estimated using the insulin toler- ance test (ITT), HOMAIRand QUICK methods. In the diabe- tic group, the fasting adiponectin concentrations were signifi- cantly lower in men than in women. They were negatively correlated with BMI (r=-0.453), hip circumference (r=-0.341), fasting glucose concentrations (r=-0.277) and HOMAIR (r=
-0.233). In addition, they were positively correlated with systolic blood pressure (r=0.321) and HDL-cholesterol (r=
0.291). The systolic blood pressure and HDL-cholesterol were
found to be independent variables, from a multiple logistic regression analysis, which influenced the adiponectin con- centration. Compared with the non-diabetic group, the adi- ponectin concentrations were significantly lower in the diabetic group, with the exception of obese males. In conclusion, the plasma adiponectin concentrations were closely related to the insulin resistance parameters in Korean type 2 diabetic patients.
Key Words: Diabetes mellitus, insulin resistance, adiponectin
INTRODUCTION
Insulin resistance, which implies impairment of insulin signaling in the target tissues, is a common cause of type 2 diabetes. Adipose tissue plays an important role in insulin resistance through the secretion of adipose-derived proteins, including tumor necrosis factor-α (TNF-α), plasminogen activator inhibitor-1, leptin, resistin, angiotensino- gen and adiponectin.
1,2Adiponectin was known as ACRP30, apM1, AdipoQ and GBP28. Recently, the plasma adiponectin levels were implicated in obesity and insulin resistance.
3-6The plasma adi- ponectin concentrations were inversely correlated with fasting glucose, fasting insulin concentra- tions, triglyceride, and body mass index, but posi- tively correlated with HDL-cholesterol.
7,8The role of adiponectin has been considered to have anti-inflammatory and anti-atherogenic effects. It accumulates in injured vessel walls, and dose-dependently inhibits the TNF-α signaling pathway in human aortic endothelial cells and reduces the TNF-α production in macrophages.
5,9Plasma Adiponectin and Insulin Resistance in Korean Type 2 Diabetes Mellitus
Mi-Jin Kim
1, Kwang-Ha Yoo
1, Hyung-Suk Park
1, Sang-Man Chung
1, Choon-Jo Jin
1, Yoen Lee
2, Young-Goo Shin
2, and Choon-Hee Chung
21Division of Endocrinology and Metabolism, Department of Internal Medicine, College of Medicine, Konkuk University, Seoul, Korea;
2Division of Endocrinology and Metabolism, Department of Internal Medicine, Wonju College of Medicine, Yonsei University, Wonju, Korea.
Received July 14, 2004 Accepted September 22, 2004
Reprint address: requests to Dr. Choon Hee Chung, Department of internal Medicine, Yonsei University, Wonju College of Medi- cine, 162 Ilsan-dong, Wonju, Kangwon-do, Korea. Tel: 82-33-761- 0506, Fax: 82-33-731-5884, E-mail: [email protected]
The plasma adiponectin concentrations were de- creased in obese and type 2 diabetic subjects and closely related to cerebro-vascular disease.
6,7In this study, our intension was to observe the dif- ference in the plasma adiponectin levels in dia- betic and non-diabetic subjects, with adjustment for gender, age and body mass index. The rela- tionship between fasting plasma adiponectin con- centrations and insulin resistance parameters were also examined.
MATERIALS AND METHODS Subjects
The subjects of this study were 102 type 2 dia- betic and 50 control subjects with normoglycemic conditions. All subjects were ambulatory patients seen at the Won-ju Christian Hospital between October 2002 and January 2003. Diabetes was de- fined according to the diagnostic criteria recom- mended by ADA in 1997.
Anthropometric and biochemical measurement All the subjects' heights, weights, and waist and hip circumferences were recorded, and their adi- posity checked by a bioelectrical method (Inbody 2.0, Biospace ). The body mass index (BMI) was defined as weight (kg)/height (m
2).
A dietitian asked about their daily protein, car- bohydrate and fat intakes using a Food Ques- tionnaire. All subjects had their blood pressure measured. No subjects was using any antihyper- tensive, antihyperglycemic, or lipid-lowing drugs before the study evaluation. After 10 hours, all subjects were given a 75g oral glucose tolerance test (OGTT). The plasma insulin levels were measured with a radioimmunoassay kit (Linco Research Inc., Missouri, USA) and the plasma adiponectin levels an enzyme-linked immunosor- bent assay by human adiponectin ELISA kit (B- Bridge International, Inc., San Jose, CA, USA). The intra and inter assay coefficients of variation for adiponectin were 4.6 and 3.2% respectively. The total cholesterol, HDL-cholesterol, LDL-choleste- rol and triglyceride were checked after 10 hours fasting.
Insulin resistance measurement
The insulin resistance was measured by the in- sulin tolerance test (ITT), HOMA
IR(Homeostasis model assessment) and QUICK (Quantitative in- sulin sensitivity check).
Insulin tolerance test
After 12 hours fasting, all subjects were admin- istrated a bolus of Humulin R 0.1 units per kilo- gram into an antecubital vein, with blood sampled from a vein on the dorsum of the same hand. To arterialize the venous blood, the hand was placed in a water bath held at a constant temperature of 43 for 20 min prior to the start of the infusion and kept there until the end of the study.
Sampling was carried out 0, 3, 6, 9, 12, and 15 minute after the insulin injection. After 15 minutes of sampling, the test was terminated by injection of glucose (20% D/W). Blood samples were analyzed for whole blood glucose using a Yellow Springs analyzer (YSI, Yellow Springs, OH, USA).
Linear regression was used to estimate the slope of the decline in the log transformed blood glucose concentration. The slope was multiplied by -100 to derive the glucose disposal rate (Kitt).
The Kitt was equivalent to the percentage decline in blood glucose per min, as calculated by the for- mula: 69.3/t
1/2. Where t
1/2was the time taken for the blood glucose to fall from a certain value at 3 minutes to half that value Kitt(%/min)=0.693t1/
2 × 100 . HOMA
IRwas applied to estimate the de- gree of insulin resistance HOMA
IR=Insulin/
22.5e
-In(glucose). QUICK
10was applied to estimate the degree of insulin resistance 1/log(fasting insulin) + log(fasting glucose) , where the insulin and glucose were expressed in μ U/mL and mmol/L, respectively.
Statistical analysis
All data were expressed as the mean ± SD. The
SPSS 10.0 (Chicago, USA) programs were used for
the statistical analyses. Differences in the means of
the plasma adiponectin between the male and
female groups were tested by the Mann-Whitney
U test. Correlations of the adiponectin and meta-
bolic parameters were calculated by Pearson's
correlation method. Multiple linear regression
analyses were used to identify independent deter- minants of adiponectin. A significant level of 5%
was chosen for all the tests (p value < 0.05).
RESULTS
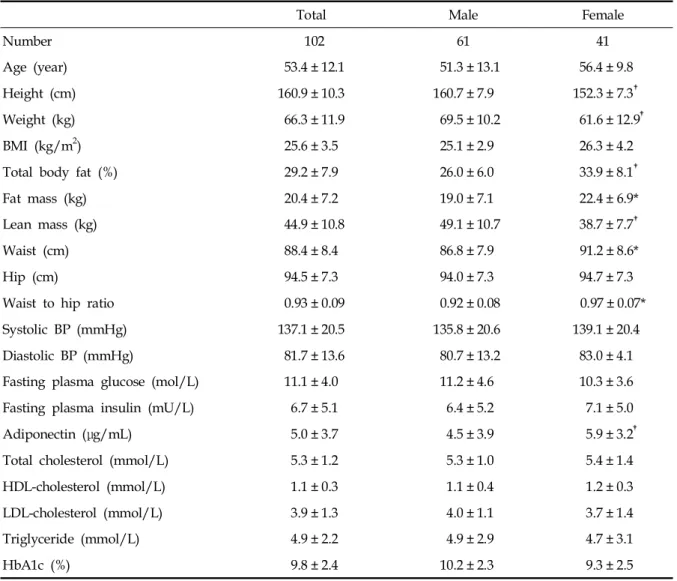
Clinical data and basic laboratory parameters in diabetes
The height, weight, total body fat percent, fat mass, lean mass, waist circumference, and waist to hip ratio measurements and plasma adiponectin
levels were significantly different between the male and female groups (Table 1).
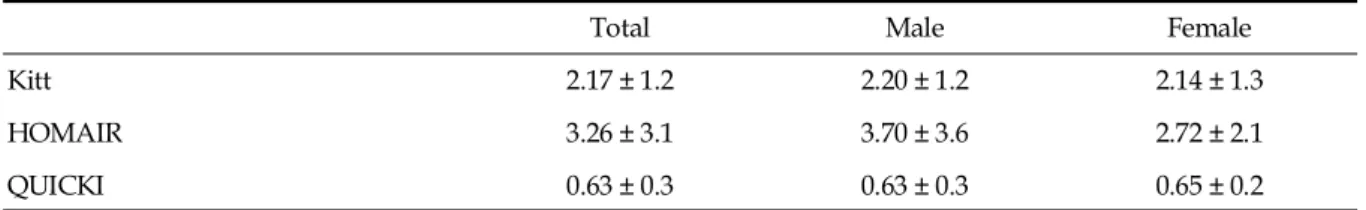
Insulin resistance parameters in diabetes
There were no differences in the insulin toler- ance test, HOMAIR, and QUICK between the male and female groups (Table 2).
Daily protein, carbohydrate and fat intake in diabetes
The daily protein, carbohydrate and fat intakes
Table 1. Clinical and Biochemical Characteristics in Diabetic Patients
Total Male Female
Number 102 61 41
Age (year) 53.4 ± 12.1 51.3 ± 13.1 56.4 ± 9.8
Height (cm) 160.9 ± 10.3 160.7 ± 7.9 152.3 ± 7.3
Weight (kg) 66.3 ± 11.9 69.5 ± 10.2 61.6 ± 12.9
BMI (kg/m2) 25.6 ± 3.5 25.1 ± 2.9 26.3 ± 4.2
Total body fat (%) 29.2 ± 7.9 26.0 ± 6.0 33.9 ± 8.1
Fat mass (kg) 20.4 ± 7.2 19.0 ± 7.1 22.4 ± 6.9*
Lean mass (kg) 44.9 ± 10.8 49.1 ± 10.7 38.7 ± 7.7
Waist (cm) 88.4 ± 8.4 86.8 ± 7.9 91.2 ± 8.6*
Hip (cm) 94.5 ± 7.3 94.0 ± 7.3 94.7 ± 7.3
Waist to hip ratio 0.93 ± 0.09 0.92 ± 0.08 0.97 ± 0.07*
Systolic BP (mmHg) 137.1 ± 20.5 135.8 ± 20.6 139.1 ± 20.4
Diastolic BP (mmHg) 81.7 ± 13.6 80.7 ± 13.2 83.0 ± 4.1
Fasting plasma glucose (mol/L) 11.1 ± 4.0 11.2 ± 4.6 10.3 ± 3.6
Fasting plasma insulin (mU/L) 6.7 ± 5.1 6.4 ± 5.2 7.1 ± 5.0
Adiponectin (μg/mL) 5.0 ± 3.7 4.5 ± 3.9 5.9 ± 3.2
Total cholesterol (mmol/L) 5.3 ± 1.2 5.3 ± 1.0 5.4 ± 1.4
HDL-cholesterol (mmol/L) 1.1 ± 0.3 1.1 ± 0.4 1.2 ± 0.3
LDL-cholesterol (mmol/L) 3.9 ± 1.3 4.0 ± 1.1 3.7 ± 1.4
Triglyceride (mmol/L) 4.9 ± 2.2 4.9 ± 2.9 4.7 ± 3.1
HbA1c (%) 9.8 ± 2.4 10.2 ± 2.3 9.3 ± 2.5
Data express mean ± SD.
BMI, Body mass index; BP, blood pressure; HDL, high-density lipoprotein; LDL, low-density lipoprotein.
* p<0.05 between male and female groups.
p<0.001 between male and female groups.
in the diabetics were 14.5 ± 2.8, 66.6 ± 8.5 and 19.4 ± 7.8%, respectively (Table 3). Diabetic pa- tients ate more carbohydrate than recommended by the ‘Korea Diabetes Diet Guideline’: 15 - 20%
protein, 55 - 60% carbohydrate, and 20 - 25% fat.
11There was no intake difference between the male and female groups, regardless of obesity (Table 4).
The daily protein intake was significantly cor- related with HOMA
IR(r=0.370, p < 0.001) and QUICK (r=-0.289, p < 0.05). Neither the daily carbo- hydrate nor fat intakes were significantly corre- lated with the Kitt, HOMA
IRor QUICK, nor the daily protein, carbohydrate and fat intakes with the plasma adiponectin concentration.
Insulin resistance parameters and adiponectin The Kitt value was highly correlated with the hemoglobin A1c (r=-0.404, p < 0.001), and corre- lated with the fasting glucose, hip circumference, and HDL-cholesterol. HOMA
IRwas highly cor- related with QUICK (r=-0.594, p < 0.001), and cor-
related with the lean mass, daily protein intake, weight, height, age, plasma adiponectin concen- tration, body mass index and fat mass. QUICK was highly correlated with HOMA
IR(r=-0.594, p< 0.001), fat mass (r=-0.447, p< 0.001), and waist circumference (r=-0.429, p< 0.001), and correlated with the body mass index, weight, hip circum- ference, daily protein intake, hemoglobin A1c, and lean mass.
Correlation of adiponectin and metabolic parameters in type 2 diabetes
The plasma adiponectin concentration was negatively correlated with the body mass index (r=-0.453, p< 0.001), hip circumference (r=-0.341, p< 0.001), fasting glucose (r=-0.277, p< 0.001) and HOMA
IR(r=-0.233, p< 0.05), and positively corre- lated with the systolic blood pressure (r=0.321, p< 0.001) and HDL-cholesterol (r=0.291, p< 0.001).
In the multiple logistic regression analysis, the systolic blood pressure and HDL-cholesterol were
Table 2. Insulin Resistance Parameters in Type 2 DiabetesTotal Male Female
Kitt 2.17 ± 1.2 2.20 ± 1.2 2.14 ± 1.3
HOMAIR 3.26 ± 3.1 3.70 ± 3.6 2.72 ± 2.1
QUICKI 0.63 ± 0.3 0.63 ± 0.3 0.65 ± 0.2
Table 3. Daily Protein, Carbohydrate, and Fat Intakes of the Type 2 Diabetics
Total Male Female
Protein (%) 14.5 ± 2.8 13.9 ± 2.7 15.0 ± 2.7*
Carbohydrate (%) 66.6 ± 8.5 66.8 ± 8.5 66.1 ± 8.7
Fat (%) 19.4 ± 7.8 19.8 ± 8.3 19.0 ± 7.1
*p<0.05 between male and female groups.
Table 4. Daily Protein, Carbohydrate and Fat Intakes of the Type 2 Diabetics in Relation to Obesity
Male Female
BMI < 25kg/m3 BMI 25kg/m3 BMI < 25kg/m3 BMI 25kg/m3
Protein (%) 14.1 ± 3.2 14.0 ± 2.6 14.7 ± 2.2 15.9 ± 2.6
Carbohydrate (%) 65.0 ± 9.1 66.2 ± 7.9 66.9 ± 6.0 64.9 ± 10.3
Fat (%) 21.0 ± 6.4 21.1 ± 10.0 18.6 ± 5.0 19.1 ± 8.5
significant independent variables for the plasma adiponectin concentration (Table 5).
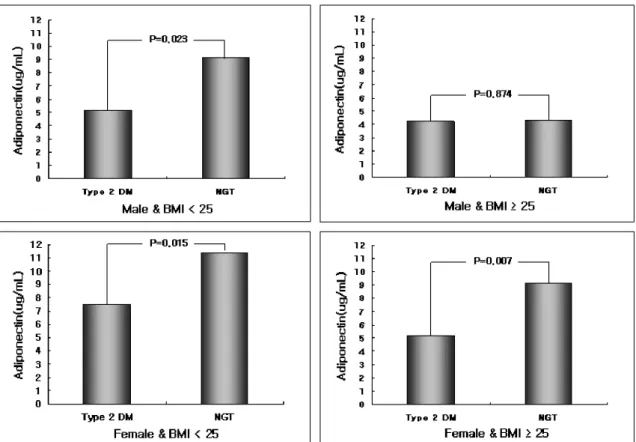
Plasma adiponectin concentrations according to obesity
The plasma adiponectin concentration was sig- nificantly lowered in the diabetic group compared to the non diabetic group, with the exception for obese males, after adjustment for age, gender and BMI (Fig. 1).
DISCUSSION
Obesity is commonly associated with insulin resistance and hyperinsulinemia, and is a major risk factor in the development of type 2 diabetes and cardiovascular disease. Free fatty acids, de- rived from adipose tissue, have long been impli- cated in the development of these obesity-related complications.
12TNF-α, which is also derived from adipose tissue, has direct effects on the insulin signaling cascade, and inhibits GLUT4 gene
expression.
1,2,12,13Plasminogen activator inhibitor type
1,11,14interleukin 6
15and complement 3
16cause insulin resistance and diabetes related cardio-vas- cular complications.
Adiponectin is a 244-amino acid protein, with high structural homologies to collagen VIII, X and complement C1q
17-20as well as TNF-α.
21Although the physiological role of adiponectin remains to be fully determined, this protein accumulates in in- jured vessel walls, and dose-dependently inhibits TNF- induced cell adhesion in human aortic α endothelial cells.
5,8Furthermore, adiponectin has recently been reported to have an inhibitory effect on the proliferation of myelomonocytic progeni- tors, as well as on the phagocytic activity and TNF-α production by macrophage.
22The plasma adiponectin levels were decreased in obese Caucasians
23and Japanese
6,7with type 2 diabetes. Recently, an intra venous injection of the c-terminus globular domain of the mouse homo- logue of adiponectin was demonstrated to reduce the plasma fatty acid levels and diet induced weight gain in mice.
24This indicated that adipo- nectin may participate in fatty acid metabolism
Table 5.Multiple Linear Regression Analysis for the Fasting Adiponectin Concentration, and the Anthropometric, and Metabolic Parameters in the DiabeticsIndependent variable Standardized coefficient(Beta) t
Sex 0.311 1.582
Age 0.064 0.336
Weight 0.121 0.279
BMI -0.244 -0.851
Lean mass -0.111 -0.488
Waist 0.007 0.037
Hip -0.013 -0.062
Systolic BP 0.297 2.081*
Fasting glucose 0.015 0.122
HDL-cholesterol 0.450 3.299*
HOMAIR -0.127 -0.892
R2 0.548
F 3.526*
Dependent variables: Fasting adiponectin concentration.
*p < 0.05.
and energy homeostasis.
24Treatment of adiponec- tin increased muscle free fatty acid β-oxidation and decreased gluconeogenesis in the liver.
9,24,25The plasma adiponectin level was found to be lower in obese human subjects.
9,19,26In ob/ob mice, the steady state mRNA of adipoQ was also found to be down regulated.
19The expression of adiponectin is considered to be activated during adipogenesis, but a feedback inhibition of its pro- duction may be imposed in the development of obesity. Yang et al.
26reported a change in the plasma adiponectin levels with body weight reduction among 22 obese patients who received gastric portion surgery. A 46 percents increase in the mean plasma adiponectin levels was accom- panied by a 21% reduction in the mean body mass index. As a result, the plasma triglyceride was significantly decreased and the insulin resistance recovered. They insisted that weight reduction of obese patients increased the adiponectin levels and has a protective effect against cardio-vascular disease and diabetes related complications.
Nishizawa et al.
27indicated that androgens de- creased the plasma adiponectin level and that androgen-induced hypoadiponectinemia may be related to a high risk of insulin resistance and atherosclerosis in men. In our study, the plasma adiponectin concentration was observed to be lowered further in men than in women (4.5 ± 3.9 vs. 5.9 ± 3.2μ/mL). Hypoadiponectinemia in men is thought to be partially responsible for the effect of androgen. However, the total body fat may affect the plasma adiponectin levels. So there is a need to carefully interpret only the androgen effects on hypoadiponectinemia in men.
DeFranzo et al.
28reported that the hyperinsu- linemic euglycemic clamp technique is currently regarded as the gold standard for measuring insulin sensitivity. However, this method requires a proficient technique and highly trained per- sonnel. The insulin tolerance test (ITT) is a well known technique for measuring insulin resis- tance.
29-31Park et al.
32reported highly significant correlations between the Kitt value, which is
Fig. 1.Adiponectin concentration difference between diabetic and non-diabetic patients, with adjustment for age, gender and BMI.
derived from the ITT and the M (kg/kg/min) or M/I (mg/kg/min/μU/mL × 100) derived from the hyperglycemic euglycemic clamp test. QUICK is also known as a reliable index of insulin sensi- tivity.
10In our study, neither Kitt, HOMA
IR, nor QUICK was significantly different between males and females. For the purpose of data accuracy, Kitt must be checked repeatedly. However, the Kitt value was not repeated checked in this study, which is a possible limitation of the data accuracy.
Our study showed that the hemoglobin A1c was correlated with Kitt, and inversely correlated with the fasting insulin concentrations, but not significantly. The body mass index, fat amount, and waist circumference were significantly corre- lated HOMA
IRand QUICK, which were same results previously reported by Laaksonen.
33Kitt was significantly correlated with fasting glucose and hemoglobin A1c; therefore, the fasting glu- cose and glucose control status were considered good parameters for insulin resistance measure- ments in this study.
Neither the daily protein, carbohydrate nor fat intakes was correlated with the plasma adiponec- tin concentrations. However, these intakes were affected by age, gender, diet habit and seasonal variation, so there is a limit to the interpretation.
Separate studies found the adiponectin concentra- tion in the plasma correlated negatively with the fasting insulin levels in Caucasian,
34Pima Indian
34and Japanese.
7In addition, the plasma adiponectin levels was negatively correlated with the plasma triglyceride concentration as well as the fasting and postprandial plasma glucose concentration.
Christian et al.
3also reported that hypoadiponec- tinemia was correlated with hyperinsulinemia and insulin resistance. Berg et al.
25showed that treat- ment of thiazolidinedione, a PPARγ agonist, to db/db mice increased the plasma adiponectin concentration and improved insulin resistance. In our study, the plasma adiponectin concentration was negatively correlated with the body mass index, hip circumference, fasting glucose and HOMA
IR, but was not significantly correlated with abdominal obesity, has represented by the waist circumference. Park et al.
35reported that the serum adiponectin levels was inversely correlated with the subcutaneous adipose tissue area (SAT),
visceral adipose tissue area (VAT), and waist to hip ratio (WHR). This study agrees with the result published by Yatagai et al.,
36which showed that hypoadiponectinemia was associated with visceral fat accumulation. It seems likely that the discrep- ancies among this and several other studies may have resulted from the different degrees of obesity of subjects, as well as the difference in gender, degree of hyperglycemia, and duration of dia- betes. Additional studies are necessary to eluci- date the association the adiponectin concentration with the abdominal obesity determined by com- puted tomography.
The plasma adiponectin level was positively correlated with the HDL-cholesterol and systolic blood pressure. In multiple regression analyses, the systolic blood pressure and HDL-cholesterol were significant independent variables for adipo- nectin. The correlations between adiponectin and blood pressure was different from those of other studies. Hypoadiponectinemia has been reported in essential hypertensive patients.
37However, Mallamari et al.
38reported that hypertensive men had significantly higher plasma adiponectin levels than normotensive men. They explained that the hyperadiponectinemia in hypertensive men was likely due to the expression of high levels of es- sential hypertensives as a counter-regulatory re- sponse aimed at mitigating the endothelial dam- age and cardiovascular risk associated with high arterial pressure. The plasma adiponectin levels may be affected by arterial pressure, but may also be affected by total body fat, hormones and so on.
Adiponectin, derived from adipose tissue, was inversely correlated with the amount of body fat.
3,19,23
Furthermore, the adiponectin level was cor-
related with leptin resistance.
9Both hyperlepti-
nemia and leptin resistance inhibit adiponectin
synthesis in the adipose tissue.
9Miyao et al.
39found an inversely correlation between the plas-
ma adiponectin and leptin concentrations in both
normal weight and obese women. The correlation
between adiponectin and leptin was also reported
by a recent genomic scan study, which revealed
a linkage of the metabolic syndrome to both a
region on chromosome 3q27, where the gene
encoding adiponectin is located, and to regions on
chromosome 17q12 that are strongly linked to the
plasma leptin concentration.
20In this study, the adiponectin concentrations, in relation to the glucose levels, was lower in the diabetic than non-diabetic subjects, with the ex- ception of obese males. Some of the obese male group with a high body mass index had only a little amount of fat. To obtain exact data, the total body fat as well as body mass index must be adjusted in future studies.
In conclusion, the plasma adiponectin concen- tration was closely related to the insulin resistance parameters in Korean type 2 diabetic patients, but further study will be needed to clarify the rela- tionship between the adiponectin level and dia- betes related complications.
REFERENCES
1. Shimomura I, Funahashi T, Takahashi M, Maeda K, Kotani K, Nakamura T, et al. Enhanced expression of PAI-1 in visceral fat: possible contributor to vascular disease in obesity. Nat Med 1996;2:800-2.
2. Spiegelman BM, Flier JS. Adipogenesis and obesity:
rounding out the big picture. Cell 1996;87:377-89.
3. Christian W, Tohru F, Sachiyo T, Kikuko H, Yuji M, Richard E, et al. Hypoadiponectinemia in obesity and type 2 diabetes: close association with insulin resistance and hyperinsulinemia. J Clin Endocrinol Metab 2001;86:
1930-5.
4. Wei-shiung Y, Yuji M, Chi-Yuan J, Jao-Ping W, Ta-Jen W, Chi-Ling C, et al. Synthetic peroxisome proliferator activated receptor-α agonist, rosiglitazone, increase plasma levels of adiponectin in type 2 diabetic patients.
Diabetes Care 2002;25:376-80.
5. Ouchi N, Kihara S, Arita Y, Maeda Kuriyama H, Okamoto Y, Hotta Nishida M, et al. Novel modulator for endothelial adhesion molecules: adipocyte derived plasma protein adiponectin. Circulation 1999;100:2473- 6.
6. Arita Y, Kihara S, Ouchi N, Takahashi M, Maeda K, Miyagawa J, et al. Paradoxical decrease of an adipose- specific protein, adiponectin, in obesity. Biochem Bio- phys Res Commun 1999;257:79-83.
7. Hotta K, Funahashi T, Arita Y, Takahashi M, Matsuda M, Okamoto Y, et al. Plasma concentrations of a newel, adipose-specific protein, adiponectin, in type 2 diabetic patients. Arterioscler Throm Vasc Biol 2000;20:1595-9.
8. Yamauchi T, Kamon J, Waki H, Terauchi Y, Kubota N, Hara K, et al. The fat-derived hormone adiponectin reverses insulin resistance associated with both lipoa- trophy and obesity. Nat Med 2001;7:941-6.
9. Ouchi N, Kihara S, Arita Y, Okamoto Y, Maeda K, Kuriyama H, et al. Adiponectin, an adipocyte-derived plasma protein, inhibits endothelial NF-kappa B sig- naling through a cAMP-dependent pathway. Circula-
tion 2000;102:1296-301.
10. Katz A, Nambi SS, Mather K, Baron AD, Follmann DA, Sullivan G, et al. Quantitative insulin sensitivity check index: a simple, accurate method for assessing insulin sensitivity in humans. J Clin Endocrinol Metab 2000;
85:2402-10.
11. Kim EJ, Min HK, Choi YK, Huh KB, Shin SH. Diabetes.
2th ed. Korean Diabetes Association: Korea medical publishing co; 1998.
12. Hotamisligil GS, Spiegelman BM. Tumor-necrosis factor α: a key component of the obesity-diabetes link. Dia- betes 1994;43:1271-8.
13. Hotamisligil GS, Murray DL, Choy LS, Spiegelman BM.
Tumor necrosis factor-α inhibits signaling from the insulin receptor. Proc Natl Acad Sci 1994;91:4854-8.
14. Alwssi MC, Peiretti F, Morange P, Henry M, Nalbone G, Juhan-vague I. Production of plasminogen activator inhibitor 1 by human adipose tissue: possible line between visceral fat accumulation and vascular disease.
Diabetes 1997;46:860-7.
15. Yudkin JS, Kumari M, Humphries SE, Mohammed-Ali V. Inflammation, obesity, stress and coronary heart disease: is interleukin-6 the link? Atherosclerosis 2000;
148:209-14.
16. Weyer C, Tataranni PA, Pratley RE. Insulin action and insulinemia are closely related to the fasting comple- ment C3, but not acylation-stimulating protein con- centration. Diabetes Care 2000;23:779-85.
17. Maeda K, Okubo K, Ahimomura I, Funahashi T, Matsuzawa Y, Matsubara K. cDNA cloning and expres- sion of a novel adipose-specific collagen-like factor, apM1 (adipose most abundant gene transcript 1). Bio- chem Biophys Res Commun 1996;221:286-9.
18. Scherer PE, Williams S, Fogliano M, Baldini G, Lodish HF. A novel serum protein similar to C1q, produced exclusively in adipocytes. J Biol Chem 1995;270:26746-9.
19. Hu E, Liang P, Spiegelman BM. Adipo Q is a novel adipose-specific gene dysregulated in obesity. J Biol Chem 1996;18:10697-703.
20. Takahashi M, Arita Y, Yamagata K, Matsukawa Y, Okutomi K, Horie M, et al. Genomic structure and mutations in adipose-specific gene, adiponectin. Int J Obes Relat Metab Disord 2000;24:861-8.
21. Shapiro L, Scherer PE. The crystal structure of a complement-1q family protein suggests an evolutionary link to tumor necrosis factor. Curr Biol 1998; 12:335-8.
22. Yokota T, Oritani K, Takahashi I, Ishikana J, Matsuyama A, Ouchi N, et al. Adiponectin, a new member of the family of soluble defense collagens, negatively regulates the growth of myelomonocytic progenitors and the function of macrophages. Blood 2000;96:1723-32.
23. Statnick MA, Beavers LS, Conner LJ, Corominola H, Johnson D, Hammond CD, et al. Decreased expression of apM1 in omental and subcutaneous adipose tissue of humans with type 2 diabetes. Int J Exp Diabetes Res 2000;1:81-8.
24. Fruebis J, Taso TS, Javorschi S, Ebbets-Reet D, Erickson
MR, Yen FT, et al. Proteolytic cleavage product of 30 kd adipocyte complement-related protein increase fatty acid oxidation in muscle and causes weight loss in mice. Proc Natl Acad Sci 2001;98:2005-10.
25. Berg AH, Combs TP, Du X, Brownlee M, Scherer P. The adipocyte-secreted protein Acrp 30 enhances hepatic insulin action. Nat Med 2001;7:947-53.
26. Yang WS, Lee WJ, Funahashi T, Tanaka S, Matsuzawa Y, Chao CL, et al. Weight reduction increases plasma levels of an adipose-derived anti-inflammatory protein, adiponectin. J Clin Endocrinol Metab 2001;86:3815-9.
27. Nishizawa T, Shimomura I, Kishida K, Maeda N, Kuriyama H, Nagaretani H, et al. Androgens decrease plasma adiponectin, an insulin-sensitizing adipocyte derived protein. Diabetes 2002;51:2734-41.
28. DeFronzo RA, Tobin JD, Andres R. The glucose clamp technique: a method for quantifying insulin secretion and resistance. Am J Physiol 1979;237:E214-23.
29. Akinmokun A, Selby PL, Ramaiya K, Alberti KGMN.
The short insulin tolerance test for the determination of insulin sensitivity: A comparison with the euglycemic clamp. Diabet Med 1992;9:432-7.
30. Hirst S, Phillips DIW, Vines SK, Clark PM, Hales CN.
Reproducibility of the short insulin tolerance test. Dia- bet Med 1993;10:839-42.
31. Grulet H, Durlach V, Hecart AC, Gross A, Leutenegger M. Study of the rate of early glucose disappearance following insulin injection: insulin sensitivity index.
Diabetes Res Clin Pract 1993;20:201-7.
32. SW Park, YS Yun, CW Ahn, SH Kwon, JH Nam, SH Han, et al. Short insulin tolerance test (SITT) for the determination of in vivo insulin sensitivity- a compari- son with euglycemic clamp test. J Korean Diabetes
Assoc 1999;22:199-208.
33. Laaksonen DE, Lakka HM, Niskanen LK, Kaplan GA, Salonen JT, Lakka TA. Metabolic syndrome and devel- opment of diabetes mellitus: application and validation of recent suggested definitions of the metabolic syn- drome in a prospective cohort study. Am J Epidemiol 2002;156:1070-7.
34. Weyer C, Funahashi T, Tanaka S, Hotta K, Matsuzawa Y, Pratley RE, et al. Hypoadiponectinemia in obesity and type 2 diabetes: close association with insulin resis- tance and hyperinsulinemia. J Clin Endocrinol Metab 2001;86:1930-5.
35. Park KG, Park KS, Kim MJ, Kim HS, Suh YS, Ahn JD, et al. Relationship between serum adiponectin and leptin concentrations and body fat distribution. Dia- betes Res Clin Pract 2004;63:135-42.
36. Yatagai T, Nagasaka S, Taniguchi A, Fukushima M, Nakamura T, Kuroe A, et al. Hypoadiponectinemia is associated with visceral fat accumulation and insulin resistance in Japanese men with type 2 diabetes mellitus. Metabolism 2003;52:1274-8.
37. Adamczak M, Wiecek A, Funahashi T, Chudek J, Kokot F, Matsuzawa Y. Decreased plasma adiponectin con- centration in patients with essential hypertension. Am J Hypertens 2003;16:72-5.
38. Mallamaci F, Zoccali C, Cuzzola F, Tripepi G, Cutrupi S, Parlongo S, et al. Adiponectin in essential hyper- tension. J Nephrol 2002;15:507-11.
39. Matsubara M, Maruka S, Katayose S. Inverse relation- ship between plasma adiponectin and leptin concentra- tion in normal-weight and obese women. Eur J Endo- crinol 2002;147:173-80.