INTRODUCTION
Microchimerism including donor-derived cell-free DNA (ddcfDNA) can be used for predicting organ rejection after transplantation [1]. For the analysis of transplant rejection, it is necessary to distinguish between the donor and the
recipient, hence, there is need to select a marker from single nucleotide polymorphisms (SNPs), short tandem re- peats (STRs), or human leukocyte antigen (HLA) testing [2].
STRs are highly polymorphic and are used as markers to distinguish between individuals; however, disadvantages of STR analysis include high cost as it involves sequenc-
Comparison of single nucleotide
polymorphisms and short tandem repeats as markers for differentiating between donors and recipients in solid organ transplantation
Hyun-Ji Lee
1, Kyoung-Hwa Shin
2, Su Jeong Jeong
1, In Suk Kim
11 Department of Laboratory Medicine, and Research Institute for Convergence of Biomedical Science and Technology, Pusan National University Yangsan Hospital, Yangsan, Korea
2Department of Laboratory Medicine, Pusan National University Hospital, Busan, Korea
Background: To analyze transplant rejection and to distinguish between donor and recip- ient, it is necessary to select a marker from single nucleotide polymorphism (SNP), short tandem repeat (STR), and human leukocyte antigen (HLA) testing. SNPs are bi-allelic and the polymerase chain reaction method used for SNP testing has the advantage of lower cost than sequencing methods. In this study, we aimed to distinguish donors from recipi- ents using a combination of existing commercialized STRs and the SNPs identified.
Methods: All selected SNPs complied with the following criterion: known and validated minor allele frequency (MAF) ≥43% in Korean and reported ethnicities from global pop- ulations (HapMap, 1000 Genomes, and the Korean Reference Genome project). The STR assays were performed for 16 tetranucleotide repeat loci.
Results: DNA from the 52 donor/recipient pairs were tested for informative markers. The median age of the recipients was 47 years. MAF in the 52 pairs was 1.0%–76.0%. The probability of informative genotypes (I) was 0.001–0.124. The summation of I was 0.680.
In the 52 donor recipient pairs, the selected SNPs showed a 0.031 average probability of being informative. The probability of identity in our study was 0.122–0.348. SNP panel configuration distinguished 100% of 52 donors/recipient pairs.
Conclusions: Donors and recipients were distinguished by STR and 22 SNPs with MAF identified from SNP databases. Seventeen SNPs were able to distinguish between do- nors and recipients (I value=0.039).
Keywords: Organ transplantation; Single nucleotide polymorphism; Short tandem repeats; Chimerism
Received August 14, 2020 Revised November 12, 2020 Accepted December 10, 2020 Corresponding author: Hyun-Ji Lee Department of Laboratory Medicine, and Research Institute for Convergence of Biomedical Science and Technology, Pusan National University Yangsan Hospital, 20 Geumo-ro, Mulgeum-eup, Yangsan 50612, Korea
Tel: +82-55-360-1875 Fax: +82-55-360-1880 E-mail: [email protected]
© The Korean Society for Transplantation This is an Open Access article distributed under the terms of the Creative Commons Attribution Non-Commercial License (http://creativecommons.org/licenses/
by-nc/4.0/) which permits unrestricted non-commercial use, distribution, and reproduction in any medium, provided the original work is properly cited.
pISSN 2671-8790
eISSN 2671-8804
ing and longer duration than polymerase chain reaction (PCR) analysis [3]. SNPs are bi-allelic and can be used as a combination of several useful SNP markers; they have an advantage of reduced cost compared to sequencing methods as PCR is used for SNP analysis. The develop- ment of the highly sensitive droplet digital PCR (ddPCR) method enables cheaper and faster analysis compared to sequencing [2]. ddcfDNA can be detected by ddPCR using a SNP marker to predict early rejection after transplanta- tion [4].
Serial inspection using markers of acute injury must be performed for early detection of rejection after solid organ transplantation. Therefore, it is practical to use an inex- pensive PCR-based method with performance similar to the STR analysis method. This is a study to select markers to differentiate donor and recipient to measure ddcfDNA and recipient-derived cell free DNA. In order to compare the usefulness of SNPs to STR, we selected SNPs that enabled us to distinguish donor-recipient and compared them with commercially available STR.
METHODS
The study’s protocol was reviewed and approved by the Institutional Review Board of Pusan National University Yangsan Hospital (IRB No. 04-2019-006) and written in- formed consent was obtained from all participants.
Patients
We tested DNA of patients from January 2016 to May 2019, comprising 52 donors and 52 recipients of solid or- gan transplantation, with organ transplants including liver, kidney, heart, lung, and pancreas. SNP markers were se- lected to differentiate donor DNA from recipient DNA. The study was conducted in compliance with the principles of
the Declaration of Helsinki.
Genomic DNA Extraction
Whole blood samples were collected from the donors and recipients. Extraction of genomic DNA from peripheral blood was performed using the QIAamp DNA blood mini kit (Qiagen, Hilden, Germany) according to the manufac- turer's instructions.
SNP Assays
All selected SNPs complied with the following criterion:
known and validated minor allele frequency (MAF) ≥43% in Korean and all reported ethnicities (data from public data- bases: HapMap, 1000 Genomes, and the Korean Reference Genome project). Assuming Hardy-Weinberg equilibrium, a SNP with a MAF between 0.4 and 0.5 would be homo- zygous for each allele in both donor and recipient about 22% to 25% of the time. The probability of both donor and recipient having a different allele is therefore 11.5% to 12.5%, using accepted estimation models for calculation of exclusion probabilities [5]. A set of 22 assays targeting different SNPs were performed for 52 donor and recipient pairs. A TaqMan probe labeled with fluorescein amidite at the 5′-end nucleotide, and with a quencher (Black Hole Quenchers; Sigma-Aldrich, St. Louis, MO, USA) at the 3′-end nucleotide was used. SNP genotyping was performed us- ing the QuantStudio real-time PCR (qPCR) instrument. The 20 μL PCR mixture contained Taqman Genotyping Master Mix (10 μL), Taqman Genotyping Assay (20X, 1 μL), DNase- free, RNase-free water (7.5 μL), and genomic DNA (1.5 μL). The reaction conditions were as follows: (95°C for 10 minutes)/(95°C for 15 seconds and 60°C for 1 minute) 40 cycles.
STR Assays
STR assays were performed using the AmpFLSTR Iden- tifiler Plus PCR Amplification Kit (Applied Biosystem, Foster City, CA, USA) consisting 16 tetranucleotide repeat loci (D3S1358, vWA, D8S1179, D21S11, D18S51, D5S818, D13S317, D7S820, CSF1PO, TH01, D16S539, D2S1338, D19S433, TPOX, and FGA) and the Amelogenin gen- der-determining marker (AMEL). Each PCR reaction was performed with a final volume of 25 μL containing 10 μL Identifiler Plus Master mix, 5 μL Identifiler Plus Primer Set, and 10 μL genomic DNA (10 μL, 0.1 ng/μL) or control (10 μL, 0.1 ng/μL). The PCR reaction conditions were as follows: 11 minutes at 95°C; followed by 20 seconds at 94°C, 3 minutes at 59°C, and 10 minutes at 60°C for 29 cy- HIGHLIGHTS
• DNA from 52 organ transplantation donor-recipient pairs was used for single nucleotide polymorphism (SNP) and short tandem repeat (STR) analysis.
• Informative STR and SNP markers were identified.
• Seventeen SNPs to differentiate between Korean do-
nors and recipients were identified.
cles; and a final hold at 4°C. A 10 μL sample contained 8.7 μL Hi-Di Formamide, 0.3 μL gene scan 500 LIZ Size Standard, and 1 μL of PCR product or an allelic ladder denatured at 95°C for 3 minutes. PCR products were analyzed on an ABI Prism 3500 DNA sequencer (Applied Biosystems, Foster City, CA, USA) using the GeneMapper software 5 (Thermo Fisher Scientific, Waltham, MA, USA). The PCR products, which were 280–312 bp in size were analyzed with the GeneScan software.
Analysis of SNP Marker Performance
We counted the number of markers showing informative genotypes. The SNP haplotypes of a minor DNA contribu- tor that are nonshared with the major DNA represents the DNA profile that can be detected in the mixture of donor and recipient DNAs. Based on Hardy-Weinberg assump- tions, the probability of informative genotypes (I) at a giv- en SNP marker can be calculated as I=2a
2b
2+2a
3b+2ab
3, where a and b are the frequencies of the A and B alleles, 2a
2b
2is the probability that the major and minor DNA
contributors are homozygous for the opposite allele (a
2b
2+a
2b
2), and 2a
3b+2ab
3are the probabilities that the major DNA contributor is homozygous (either A or B) and the minor DNA contributor is SNP heterozygous, respec- tively ([a
2[2ab]+b
2[2ab]). The I value for the SNP markers is reported in Table 1. If the I value is 0.5, there is a 50%
chance of distinguishing the donor/recipient at the type I level of that SNP. The higher the I of the SNP, the less the number of SNPs required, and the donor/recipient can be distinguished only with the type I marker.
Analysis of STR
The probability of identity (Pi), also referred to as the matching probability, is the chance that two unrelated people selected at random will have the same genotype and was first described by George Sensabaugh in 1982.
The Pi value of a single locus is determined by summing the square of the observed genotype frequencies:
∑
ni 1=xi
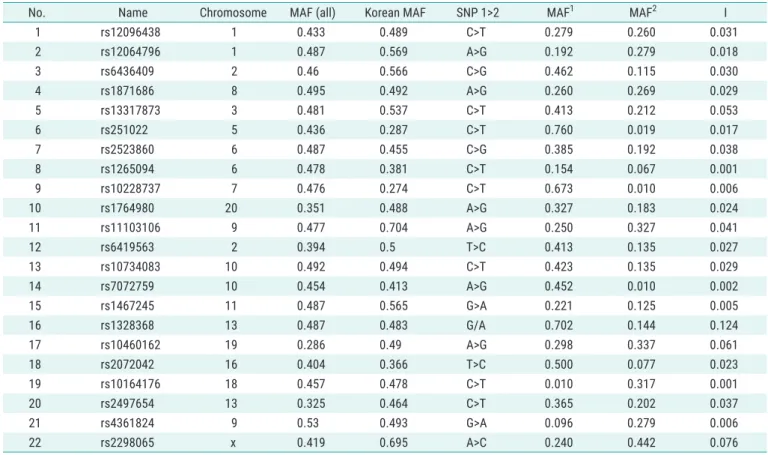
2Table 1. Allele frequencies and probability of informative genotypes in the 52 solid organ transplant donor and recipient pairs
No. Name Chromosome MAF (all) Korean MAF SNP 1>2 MAF
1MAF
2I
1 rs12096438 1 0.433 0.489 C>T 0.279 0.260 0.031
2 rs12064796 1 0.487 0.569 A>G 0.192 0.279 0.018
3 rs6436409 2 0.46 0.566 C>G 0.462 0.115 0.030
4 rs1871686 8 0.495 0.492 A>G 0.260 0.269 0.029
5 rs13317873 3 0.481 0.537 C>T 0.413 0.212 0.053
6 rs251022 5 0.436 0.287 C>T 0.760 0.019 0.017
7 rs2523860 6 0.487 0.455 C>G 0.385 0.192 0.038
8 rs1265094 6 0.478 0.381 C>T 0.154 0.067 0.001
9 rs10228737 7 0.476 0.274 C>T 0.673 0.010 0.006
10 rs1764980 20 0.351 0.488 A>G 0.327 0.183 0.024
11 rs11103106 9 0.477 0.704 A>G 0.250 0.327 0.041
12 rs6419563 2 0.394 0.5 T>C 0.413 0.135 0.027
13 rs10734083 10 0.492 0.494 C>T 0.423 0.135 0.029
14 rs7072759 10 0.454 0.413 A>G 0.452 0.010 0.002
15 rs1467245 11 0.487 0.565 G>A 0.221 0.125 0.005
16 rs1328368 13 0.487 0.483 G/A 0.702 0.144 0.124
17 rs10460162 19 0.286 0.49 A>G 0.298 0.337 0.061
18 rs2072042 16 0.404 0.366 T>C 0.500 0.077 0.023
19 rs10164176 18 0.457 0.478 C>T 0.010 0.317 0.001
20 rs2497654 13 0.325 0.464 C>T 0.365 0.202 0.037
21 rs4361824 9 0.53 0.493 G>A 0.096 0.279 0.006
22 rs2298065 x 0.419 0.695 A>C 0.240 0.442 0.076
MAF, minor allele frequency; SNP, single nucleotide polymorphism; MAF
1, minor allele frequency of first allele on SNP; MAF
2, minor allele frequency of
second allele on SNP; I, probability of informative genotypes.
where Xi is the genotype frequency.
Lower Pi values indicate more variability of the genet- ic marker in the measured population because there are more genotypes occurring at a lower frequency.
Informative Maker Analysis
The SNP or STR loci of informative markers were ana- lyzed. Type I markers, or loci type I, were defined as loci or alleles presenting a homozygous genotype in the recipi- ent and an alternative homozygous genotype in the donor.
Conversely, type II markers were defined as loci or alleles presenting a homozygous genotype in the recipient and a heterozygous in the donor. Type III markers were those that did not fulfil the criteria for type I or type II markers.
RESULTS
DNA from 52 donor recipient pairs were tested for informa- tive markers. The number of deceased donors was 28 and
the number of living donors was 24. Males (n=30, 57.7%) outnumbered females in the total number of recipients (Table 2) and the median age of recipients was 47 years.
The MAF of SNPs in the 52 pairs were 1.0%–76.0% (Table 1). The probability of informative genotypes (I) ranged from 0.001–0.124 and the summation of I was 0.680. In all donor recipient pairs, the selected SNP markers had an average probability of being informative of 0.031. After the exclusion of the least polymorphic markers (rs1265094, rs10228737, rs7072759, rs1467245, rs10164176), the av- erage probability of being informative increased to 0.039.
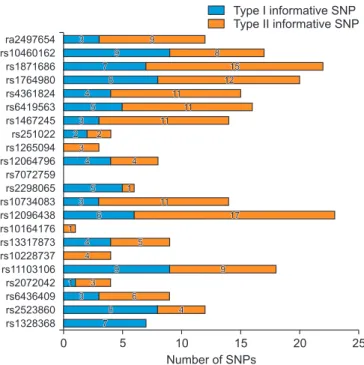
The most selected type I informative markers were rs10460162 and rs11103106, observed in 9 donor recip- ient pairs (17.3%), followed by rs2523860. Four SNPs, rs10228737, rs10164176, rs7072759, and rs1265094, had no discriminatory power as type I informative markers. The most selected type II informative marker was rs12096438 observed in 17 donor recipient pairs (32.7%) (Fig. 1).
The Pi or matching probability is the chance of the same genotype in two unrelated people selected at ran- dom. The Pi of the present study ranged from 0.122 to 0.348 (Table 3). AMEL was not an optimal marker for the determination of mixed chimeras due to the sharing of alleles between donor and recipient. Except AMEL, the 15 STR loci were informative markers with a discrimination
Table 2. Baseline characteristics of 52 donors and recipientsVariable Number
Organ
Kidney 25
Heart 13
Pancreas 11
Liver 3
Sex
Male 30
Female 22
Relationship Unrelated
Deceased 28
Spouse 10
Family in law 3
Related
Parent/child 8
Brother/sister 2
Uncle 1
Rejection
AMR 2
TCMR 9
Age (yr), median (range) 47 (26–66) AMR, antibody-mediated rejection; TCMR, T-cell–medicated rejection.
0 5 10 15 20
ra2497654 rs10460162 rs1871686 rs1764980 rs4361824 rs6419563 rs1467245 rs251022 rs1265094 rs12064796 rs7072759 rs2298065 rs10734083 rs12096438 rs10164176 rs13317873 rs10228737 rs11103106 rs2072042 rs6436409 rs2523860 rs1328368
25 Number of SNPs
Type I informative SNP Type II informative SNP 3
3 99
8 8
15 15 12 12 11
11 4
4 5 5
2 2 3 3
1 1
17 17 7
7 8 8
2 2
11 11 11 11
3 3 4
4 44
5 5
1 1
1 1 3 3
8 8 7 7
9 9 9
9 4 4 4 4
5 5 3
3 1111
6 6
3 3
6 6
4 4 9
9
Fig. 1. Number of informative single nucleotide polymorphism (SNP) loci
identified in the 52 donor and recipient pairs. The histogram shows the
number of informative SNP loci identified in the donors and recipients.
power of 42.9%–92.9%. The selection rate of type I infor- mative markers among 16 alleles was 17.1% to 56.1%, with D2S1338 observed in 27 donor recipient pairs (Fig. 2).
There were no type I alleles in two mother-child pairs, one sister-sister pair, and one uncle-nephew pair.
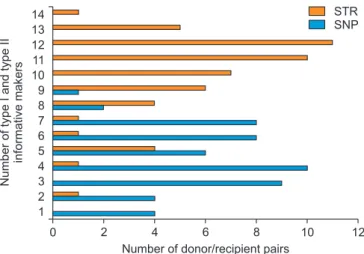
In 52 pairs of donors and recipients, the median values of type I SNPs were 2 and the median values of type II SNPs were 3. The median value of type I STR was 6 and type II STR was 5. The sum of meaningful markers on combining type I and type II was median 4 (range, 1–9) in
SNP and median 11 (range, 2–15) in STR (Fig. 3).
DISCUSSION
The development of rejection after transplantation is a very important event leading to loss of organ transplant, and hence, early detection of rejection is important for organ transplant survival. The use of noninvasive and sen- sitive test methods for diagnosis of rejection have shown that an increase in amount of ddcfDNA beyond a certain level after organ transplantation can be used as a predic- tor of transplant rejection [5,6]. This is a preliminary study
Table 3. Loci sorted by Pi valuesAllele Observed allele type Pi
AMEL X,Y 0.348
CSF1PO 9,10,11,12,13 0.217
D13S317 8,9,10,11,12,13,14 0.147
D16S539 9,10,11,12,13,14 0.186
D18S51 12,13,14,15,16,17,18,19,20,22,23 0.156 D19S433 11.2,12,13,13.2,14,14.2,15,15.2,16.2 0.205 D21S11 27,28,28.2,29,29.2,30,30.2,31,31.2,32.2,33.2 0.206 D2S1338 17,18,19,20,21,22,23,24,25,26,27 0.125
D3S1358 14,15,16,17,18,19 0.221
D5S818 8,9,11,12 0.249
D7S820 7,9,10,11,12,13 0.192
D8S1179 10,11,12,13,14,15,16,17 0.141
FGA 18,19,20,21,22,23,24,25,26,27 0.122
TH01 6,7,8,9,9.3,10 0.191
TPOX 8,9,11,12 0.249
vWA 14,15,16,17,18,19,20 0.178
Total Pi 2.6478E-12
Pi, probability of identity.
AMEL
CSF1POD13S317D16S539D18S51D19S433D21S1 1
D2S1338D3S1358D5S818D7S820D8S1
179 FGA TH01 TPOX vW A 60
50
40
30
20
Numberofinformativemakers 10
STR loci 0
Type III Type II Type I
52 25
12
15 16
11
25 18
16 12
18
22 18
13 14 4
31
14 17
9 13
27 31
19
19
12 22
20
19 17
12 21
22 18
12
14 13 9
17 23 19 18
9 27 17 20
Fig. 2. Informative short tandem repeat (STR)
loci in the 52 solid organ transplant donor and recipient pairs.
0 2 4 6 8 10
14 13 12 11 10 9 8 7 6 5 4 3 2 1
12 Number of donor/recipient pairs
STR SNP
NumberoftypeIandtypeII informativemakers
Fig. 3. Comparison of the number of informative alleles of single nucleo-