Vol. 18, No. 3, pp. 29-35, June 2014
Characterization of Chemical Sludge inside Pipes Using Torsional Guided Waves
Kyung-Jo Park*†
(received 06 January 2014, revised 01 May 2014, accepted 01 May 2014)
Abstract: A new method is presented that uses guided wave techniques for sludge and blockage detection in long-range pipelines. Existing techniques have the limitations that the sludge position needs to be known a priori and the area to be inspected needs to be accessible. A novel guided wave technique has been developed that allow the sludge or blockages to be detected remotely without the need to access the specific location where the pipe is blocked, nor to open the pipe. The technique measures the reflection of guided waves by sludge that can be used to accurately locate the blocked region. The effectiveness of the proposed technique is demonstrated and confirmed by experimental measurements.
Key Words:Sludge, Torsional Mode, Reflection Coefficient,, Energy Flow
*†Kyung-Jo Park(corresponding author) : Department of Mechanical Design Engineering, Chonnam National University.
E-mail : [email protected], Tel : 061-659-7221
1. Introduction
The accumulation of sludge inside pipelines is a problem that commonly occurs in the chemical, process, oil and food industries. Ultimately blockages can result from the accumulation of sludge1,2). The presence of sludge or blockages in pipelines has an impact on several of the factors that affect the plant operation. The efficiency of the plant may be reduced in terms of product flow rate, owing to the reduction in pipe diameter. The quality of the product may also be compromised as a result of changes in the processing conditions. In addition, the product may become contaminated by pieces of sludge that detach from the pipe.
An effective sludge and blockage detection
system is very important since it can reduce production down time and costs. Current techniques to detect sludge inside pipes are limited or intrusive3~7). It would be very useful if guided waves could be used to detect sludge inside pipes, because the inspection based on the guided waves can non-intrusively and remotely detect and measure materials within pipelines. Guided waves can be excited from the outside of the pipe wall at one location and propagate along the length of the pipe for long distances. They are partially reflected when they encounter features in the pipe (such as welds, corrosion, and cracks) that locally cause a discontinuity of the pipe wall. Technologies employing ultrasonic guided waves have been well developed for the long-range inspection of pipelines
8~10).
This work primarily aims at developing a method to detect the sludge inside pipes by using fundamental torsional guided waves. The investigation starts with an introduction of the propagation of torsional waves in bi-layered pipes, followed by a detailed analysis of their energy flow distribution. The physical insight gained from this analysis enables the design of the guided wave measurement concepts to characterize the coating layer inside the pipe. These are demonstrated and confirmed by experimental measurements.
2. Torsional waves in a bilayered pipe
The characteristics of the torsional waves propagating in the bilayered pipe need to be studied to understand the nature of the scattered field of the T(0,1) mode from the discontinuity where the free pipe meets the bilayered pipe.
Let us consider a hollow, elastic and isotropic cylinder coated with an axi-symmetric elastic layer inside. The cylindrical coordinates (r, θ, z) are appropriate here to represent the geometry of the system(r, θ, z denote the radial, angular and axial position, respectively). The Fourier transformed wave equation describing the propagation of distortional waves in a homogeneous medium is given as11)
∇ (1)
where is the vector potential that is parallel to z and is the velocity of shear waves, which can be described as follows
(2)
where ρ and μ are the density of pipe material
and Lam constants, respectively.
The generic solution to Eq. (1) will be of the form
(3)
where A and B are the arbitrary constants, kr and k are the projections of the wave vector along the r and z directions, and J0 and Y0 are the Bessel functions of the first and second kind. The displacement field can be obtained by applying the curl operator to , thus
(4)
where and , the displacement field being tangential. The phase velocity of a guided mode is defined as . The nonzero components of the stress tensor are therefore
(5)
(6)The displacement field associated with a torsional mode propagating in a bilayered pipe can be expressed according to Eq. (4) where the constants C and D are different in the pipe wall and the internal layer, leading to four unknown constants.
The unknown can be determined by using the global matrix method when imposing suitable boundary conditions12). In particular, we assume a good bond state between the pipe and the coating layer, which means the continuity of the displacement and the stress component at the interface. Also the zero traction condition is imposed on both the free surface of the pipe and
the internal layer. Moreover, if the pipe is completely filled, the constant D has to vanish in order to remove the singularity of Y1 at .
The solution can be obtained by using Disperse, which solves the exact secular equation obtained with the global matrix approach numerically.
Figure1(a) shows the group velocity dispersion curves over the frequency range 0~300 ㎑ for a 101.6 ㎜ bore diameter(nominal 4 inch) cast iron pipe with a wall thickness of 2.1 ㎜ and a length of 2 m. The material properties for the pipe and the coating layer are summarized in Table 1. The modes of the bilayered pipe are labeled as T1, T2, T3. For comparison, the torsional mode in the free pipe labeled as T(0,1) is also given. This shows that in the same frequency range there are many more modes occurring in the bilayered pipe compared to the single T(0,1) mode in the free pipe. Note that although only one torsional mode can propagate in the free pipe in the frequency range considered in Fig. 1(a), higher order modes will occur at higher frequencies. With the occurrence of the new modes, new cutoff frequencies labeled as F2, F3 are generated accordingly. Also, the modes of the bilayered pipe are very dispersive, unlike the T(0,1) mode of the free pipe that always keeps a constant velocity value for all frequencies.
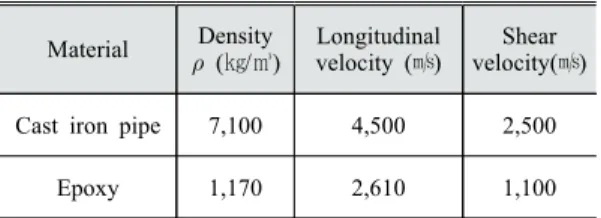
Table 1 Material properties Material Density
(㎏/㎥) Longitudinal
velocity (㎧) Shear velocity(㎧) Cast iron pipe 7,100 4,500 2,500
Epoxy 1,170 2,610 1,100
The energy flow distribution is useful to help understand the energy distribution of guided waves in multiple layer waveguides. Specifically for torsional modes in the bilayered pipe, the energy flow density in the axial direction(z) at any radial
position r can be expressed as13)
(7)
Total time-averaged axial energy flow in the pipe wall(Ep) and in the coating layer(El) can be obtained by integrating Eq. (7) over the pipe wall thickness and the coating thickness
(8)
(9)Here, R1 and R2 represent the inner and outer radius of the pipe and R0 is the inner radius of the coating layer. The subscripts 1 and 2 refer to the pipe and the layer respectively. The energy flow ratio(EFR) is similarly defined as the ratio of the energy flow in the pipe to that in the layer
(10)
The EFR spectra calculated for the modes shown in Fig. 1(a) are given in Fig. 1(b).
When a torsional wave T(0,1) that is incident from the free end of a pipe, the incident T(0,1) mode is partly reflected back into the free pipe(reflected signal) at the point where a coating layer starts inside the pipe. Also the incident mode is partly transmitted into the multiple torsional modes in the bilayered pipe (local signal) and then further converted back into the T(0,1) mode after the bilayered pipe (transmitted signal). It also needs to be mentioned that, since the layer is axially symmetric, no mode conversion into longitudinal or flexural modes occurs. Since all the reflected, local
(a) Group velocity dispersion curves
(b) Energy flow ratio
Fig. 1 Group velocity and energy flow ratio curves of torsional modes in a bilayered pipe
and the transmitted signals are caused by the presence of the layer, their characteristics should depend on the layer properties and the nature of the guided wave behavior.
In the case of a plane wave incident at the interface between two different media, we would analyze the reflection and transmission by studying the change of impedance between two media. The situation for guided waves is more complex, but it is the extent to which the modes in the free pipe match those in the bilayered pipe, which determines the strength of the reflection, according to modal analysis theory [11]. In particular, if the energy flow associated with the mode shape of T(0,1) in the free pipe matches well that of a bilayered mode within the pipe wall, the mode is transmitted with little energy being reflected. Conversely, if the matching is poor, a strong reflection occurs. The extent of the mode matching can be assessed by
(a) Mode shape of point A on the T2 mode
(b) Mode shape of point B on the T1 mode
(c) Mode shape of point C on the T2 mode Fig. 2 Energy flow density mode shapes for the
bilayered pipe
studying the EFR spectrum.
Let us consider the T(0,1) mode incident at the cutoff frequency of T2(Fig. 1). The EFR of T2 is always larger than that of T1(as it can be deduced from Fig. 2(a) and (b), which shows the normalized energy flow distribution through the thickness of the bilayered pipe), which means that T2 tends to carry more energy in the pipe wall than T1. Therefore, it is expected that T(0,1) in the free pipe will transmit more energy into T2 rather than T1. However, it can
be observed that as the frequency increases, the EFR of T2 increases up to a maximum value labeled C in Fig. 1(b), where the amount of energy traveling in the pipe wall is maximum(see Fig.
2(c)). As a result, as the frequency increases from the cutoff frequency of to C, T(0,1) tends to transmit more energy into T2; conversely the reflected energy tends to decrease by the energy conservation law. If the frequency increases further, the EFR of T2 starts decreasing together with the transmitted energy from T(0,1), since the matching of the energy flow mode shape deteriorates. When the frequency reaches the cutoff of T3 a transition occurs and the energy of T(0,1) starts to be mostly transmitted into T3, since it will have a larger EFR than T1 and T2 afterwards. The same phenomenon will repeat periodically as the frequency increases. It can be concluded that the frequencies where a maximum EFR occurs will approximate the minimum of the reflection coefficient, whereas the maximum of the reflection coefficient should occur at the frequencies close to the cutoff frequencies of the bilayered pipe modes.
The incident T(0,1) mode transmits into the multiple dispersive torsional modes in the bilayered pipe region. These modes are converted back to the transmitted T(0,1) propagating past the bilayered region and reflected from pipe end. The transmitted T(0,1) carries information about the dispersion characteristics of the torsional modes in the bilayered pipe. Both the transmitted and local signal essentially make use of this layer-induced dispersion, however, the transmitted signal has the advantage compared to the local signal as the location of the bilayered pipe region cannot be known a priori in practical situations.
3. Experimental results
Experiments have been carried out to validate the
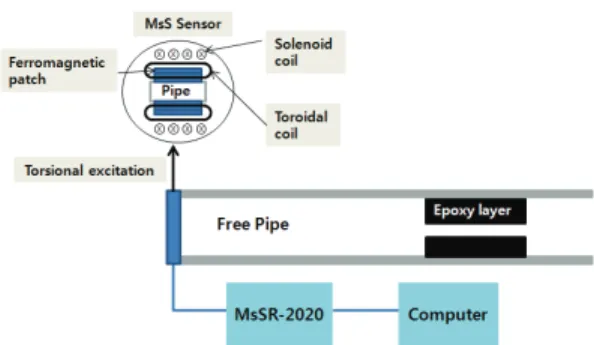
analysis that the location of sludge becomes known by EFR spectra. The general setup for the experiments is shown in Fig. 3. A cast iron pipe with the same dimensions of the one used to calculate dispersion curves was used. It was a 2 m long pipe, 0.5 m of which from the pipe end was coated inside with a 5 ㎜ thickness epoxy resin layer to represent the model studied in this paper.
Due to application difficulty, the epoxy layer built inside the pipe was not perfectly symmetrical along its length. The epoxy resin employed is a commercial adhesive, Araldite 2020, whose acoustic properties were determined using the conventional ultrasonic time of flight method and are listed in Table 1.
Fig. 3 Schematic diagram of the experimental setup
An instrument incorporated with a crossed-coil magnetostrictive sensor (MsS)14) was used for generating and detecting the torsional guided waves.
These sensors utilize magnetostrictive effects that refer to Joule and its inverse Villari effects. The sensor consists of a ferromagnetic patch and two coils, a solenoid and a toroidal coil. The toroidal coil generates a magnetic field in the circular direction, and the solenoid coil does so in the axial direction. If a ferromagnetic material is subjected to an oscillatory driving induction in either the axial or the circular directions, in conjunction with a bias induction in the respective orthogonal direction, it will oscillate in torsion due to the Wiedemann
effects. The signal output from the crossed-coil MsS instrument was a 3-cycle, 128 ㎑ tone-burst, modulated by a Hanning window. We adopted a pulse-echo technique, which receives the reflected signal from the bilayered region and the pipe end using the same transducers used in the excitation.
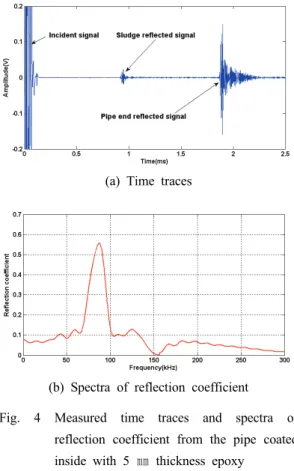
The time domain signal from the experiments is shown in Fig. 4(a). The time trace shows the incident wave on its way to the bilayered pipe region, and the reflection from the entry point of the epoxy layer. The reflection coefficient is calculated by dividing the frequency spectrum of the measured reflected signal by that of the incident signal. The reflection coefficient amplitude spectrum obtained from the pipe partially coated on the inside surface with a 5 ㎜ thickness epoxy layer is plotted in Fig, 4(b). We can see that the reflection
(a) Time traces
(b) Spectra of reflection coefficient
Fig. 4 Measured time traces and spectra of reflection coefficient from the pipe coated inside with 5 ㎜ thickness epoxy
coefficient spectrum displays the characteristic peak and trough. The most important feature of the reflection coefficient spectrum is that the first peak occurs at the frequency of 87 ㎑, which is very close to the predicted cutoff frequency (85 ㎑) of the mode of the corresponding bilayered pipe.
The cutoff frequency of the T3 mode is 194 ㎑ and it can be seen in Fig. 4(b) that the second peak occurs around this frequency. However it is clear that the magnitude of the reflection coefficient spectrum is small and not as sharp as that of the first peak. This is due to the fact that the energy of the T(0,1) mode is mostly transmitted into T2 mode.
Since these cutoff frequencies are, for an assigned pipe, uniquely determined by the epoxy layer thickness and bulk shear velocity, the shear acoustic properties or thickness of the coating layer can be characterized by measuring the peak positions of the reflection coefficient spectrum.
4. Conclusions
In this work, a method is presented that uses guided wave techniques for sludge and blockages detection in long-range pipelines. When the T(0,1) mode is incident at the local bilayered pipe region, due to the mismatch of its mode shape with that of the modes in the bilayered region, the T(0,1) mode is scattered: part of it is reflected back and part is transmitted into the multiple torsional modes in the bilayered pipe and then reflected from the pipe end.
Such phenomena can be used to develop a method to detect and characterize the properties of a layer inside a pipe. The method makes use of the reflected T(0,1) mode that can effectively locate the layer inside the pipe. The amplitude spectrum of the reflection coefficient of the T(0,1) is found to exhibit peaks at the cutoff frequencies of the modes in the bilayered pipe. Since the cutoff frequencies depend on the thickness and bulk shear velocity of
the layer, the peak positions of the reflection coefficient spectrum can be used to determine the thickness of the coating layer.
It can be concluded that the proposed method allow the characterization of the layer to be executed remotely i.e. without the need to access the bilayered region.
Acknowledgement
The work described in this paper was supported by the Ministry of Education, Science Technology (MEST), and the Korean Institute for Advancement of Technology (KIAT) through the Regional Innovation Center Program.
References
1. R. C. Sarmento, G. S. Ribbe, and L. A.
Azevedo, 2004, “Wax blockage removal by inductive heating of subsea pipelines”, Heat Transfer Engineering, Vol. 25, pp. 2-12.
2. P. J. Rathbone, 2005, “Sludge characterization for ultrasonic wave guide blockage testing”, Technical Report of BFNL Nexia Solutions, pp.
180-187.
3. T. P. Bott, 1995, “Fouling of Heat Exchangers”, Elsevier, New York.
4. C. Kuchpil, M. Gonalves and L. Marquez, 2002,
“Blockage location and remediation in subsea pipelines”, Deep Offshore Technology Conference, New Orleans, Louisiana, pp.
691-700.
5. M. F. Salis and D. J. Oldham, 2001, “The development of a rapid single spectrum method for determining the blockage characteristics of a finite length duct”, Journal of Sound and Vibration, Vol. 243, pp. 625- 640.
6. J. B. Kim, S. H. Jung J. H. Moon, T. Y. Kwon and G. S. Cho, 2010, “Development of
tomographic gamma-ray san method for industrial plants” Journal of Nondestructive Testing, Vol. 30, pp. 20-30.
7. IAEA, 2008, “Industrial Gamma Process Tomography”, TEC DOC-1589.
8. R. Caradente, J. Ma and P. Cawley, 2010, “The scattering of the fundamental torsional mode from axisymmetric defect with varying depth profile in pipes”, Journal of Acoustical Society of America, Vol. 127, pp. 3440-3448.
9. J. Hua, J. Mu and J. Rose, 2011, “Guided wave propagation in single and double layer hollow cylinders embedded in infinite media”, Journal of Acoustical Society of America, Vol. 129, pp.
691-700.
10. K. J. Park and C. Y. Kim, 2013, “Identification of the properties of soils and defect detection of buried pipes using torsional guided waves”, Journal of the Korean Society for Power System Engineering, Vol. 17, pp. 56-62.
11. J. L. Rose, 1999, “Ultrasonic Waves in Solid Media”, Cambridge University Press, Cambridge.
12. B. N. Pavlakovic, M. J. Lowe, D. N. Alleyne and P. Cawley, 1997, “DISPERSE: A general program for creating dispersion curves”, Review of Progress in Quantitative NDE Vol. 16, pp.
185-192.
13. J. Ma, F. Simonetti and M. J. Lowe, 2006,
“Scattering of the fundamental torsional mode by an axisymmetric layer inside a pipe”, Journal of the Acoustic Society of America, Vol. 120, pp. 1871-1880.
14. K. J. Park, W. S. Kang and D. J. Kang, 2010,
“Flaw detection of petrochemical pipes using torsional waves”, Journal of the Korean Society for Power System Engineering, Vol. 14, pp.
46-51.