♾
지리정보시스템과 원격탐사자료를 이용한 도시공간구조의 파악 -대구광역권 사례연구-김재익
1※
ᆞ권진휘1
Identifying Urban Spatial Structure through GIS and Remote Sensing Data
-The Case of Daegu Metropolitan Area-
Jae-Ik KIM
1※
ᆞJin-Hwi KWON1
ABSTRACT
The main purpose of this study is to identify urban spatial structure by applying geographic information system and remote sensing data. This study identifies the urban spatial structure of non-megalopolis by analyzing the spatial distribution of population and employment in the case of Daegu metropolitan area. For this purpose, multi-temporal satellite image data (Landsat TM; 1995, 2000 and 2005) were utilized through the geographic information system. The distance-decay estimations in terms of population and employment density show that Daegu region as a whole shows monocentric urban characteristics. However, some evidences of polycentricism such as low explanation power of monocentric urban model, rises in multiple employment centers, decentralization of employment are emerging.
KEYWORDS : Spatial Structure, Distance-decay Estimation, Urban Growth Model
요 약
본 연구는 지리정보시스템과 원격탐사자료를 이용하여 도시공간구조를 파악하는데 목적이 있다.
특히 본 연구는 거대도시와 중소도시의 중간규모인 대도시의 공간구조를 대구광역시와 그 주변지 역을 단위로 하는 대구광역권을 사례지역으로 선정하였다. 도시구조는 인구 및 직업밀도를 기준으 로 분석하였다. 이 분석을 위하여 1995, 2000, 2005년도의 Landsat TM 5 위성영상자료를 지리정보 시스템과 연계하여 피복분석을 통하여 활용되었다.
공간구조는 인구밀도와 직업밀도의 거리조락함수를 추정함으로써 파악되었다. 분석결과 대구광 역권의 차원에서는 단핵도시구조를 보이고 있다. 그러나 단핵도시모형의 설명력이 점차 감소하는
2009년 4월 9일 접수 Received on April 9, 2009 / 2009년 6월 4일 수정 Revised on June 4, 2009 / 2009년 6월 12일 심사완료 Accepted on June 12, 2009
* Early version of this paper was presented at ASIAGIS 2008, held in Busan, Korea, September 26-27, 2008.
1 계명대학교 도시공학과 Dept. of Urban Planning, Keimyung University
※ 연락저자 E-mail : [email protected]
점, 부도심의 형성 및 성장 등의 추세를 감안하면 분석범위를 대구광역시에 한정할 경우 다핵심도 시구조로 이행하고 있다.
주요어: 공간구조, 거리조락함수, 도시성장모형
Introduction
Urban structure reflects the efficiency of urban spatial settings by bringing activity centers, land uses, networks together. It also provides considerable insight into the nature and functioning of the city. For these reasons, the analysis of urban structure is prerequisite for various urban and regional plan makings in Korea. However, studies of urban structure have a strong tendency to focus only on Seoul, the polycentric world city (Jun, 2002; Kim et al, 2008). Therefore, research attentions to other cities such as Busan and Daegu have not been given. For these reasons, the urban spatial structure of many metropolis, be it may monocentric or polycentric structure, is described without clear theoretical basis and defined without proper empirical analysis.
Many empirical studies in USA and European cities prove that a megalopolis (population over 5 million) is considered as a policentric city, while a small and medium sized city is considered as a monocentric city. Then the cities between the two types of city must be in transformation stage, i.
e., from monocentric city to polycentric city.
Of course, location and relocation decisions of households and firms are the main forces of the urban transformation. Such decisions based upon economic reason lead population and employment suburbanization (Carlino and Chatterjee, 2002). Furthermore, high
portions of the suburbanized firms tend to locate close to each other. This spatial concentration of economic activities forms a sub-center, and lead polycentric urban structure(Klaassen and Paelinck, 1979;
McDonald, 1987; Small and Song, 1994;
McMillen, 2001). The common problems concerning sub-centering are definition of the sub-center and measurement standard in determining the boundary of a sub-center.
Many studies suggest various standards to define s sub-center (Gordon et al, 1986;
Heikkila et al, 1989; Giuliano and Small 1991 Lee, 2007). Common approach to determine the urban structure is to estimate the market rent gradient with distance decay function based on the monocentric assumptions. For the case of polycentric structure, the marker gradient is estimated with non-linear regression model. This study estimates population and employment density gradient, rather than market rent gradient, due to the lack of land price data based on the common monocentric assumptions. One step further, the shape of employment center and their density are depicted by utilizing map functions of the GIS for visual understandings (Yun and Park, 2008).
Therefore, the primary purpose of this
study is to identify the spatial structure of
the Daegu metropolitan area through the
estimation of population and employment
density gradients using the distance-decay
function in the year of 1995, 2000 and 2005.
Data and Approach
Daegu metropolitan city contains 2.5 million inhabitants in an area of 811 km2 for population density of 3,005.9 person/km2. The city functions as a regional center. This study extents the analysis area up to the vicinity of the city since the city and hinterlands illustrate a wide range of interactions in terms of population, employment, traffic flows. As a result, there are seven Gus(District, the primary self-governing body in the greater city area), two cities and six Guns(the primary self-governing body in rural areas. The study area contains 3,112,179 persons (Daegu city=2,464,547 and vicinities=647,632) and 916,632 jobs (Daegu=714,703 and vicinities=201,929) in 2005.
Data used for this analysis include the 1995, 2000 & 2005 population data from the Census Bureau of Korean government. The sources of data for this study of employment distribution are Report on the Census on Basic Characteristics of Establishment conducted by each administration unit(Gu) in the end of 1995, 2000 and 2005. These data were used because the report provided more complete coverage of total employment by industry and by place of employment than did alternative sources of data. Because the data contain geographic feature, geographic information system (GIS) is constructed. The system allows to manipulate data easy and fast. Monitoring land use change is very important for urban and regional planning.
However, continuous updating of land use information within a city is not economically efficient.Remote sensing technology can provide a method for acquiring regular, recent information for land use change. For
this reason, this study utilizes Landsat TM 5 imagery of 1995, 2000 and 2005 of Daegu metropolitan area to identify changes of urban extents. The satellite data were examined using standard image processing software, ERDAS IMAGINE(v.9.1) and the results of the digital processing were presented with ArcGIS Desktop(v.9.2). The statistical analyses were performed by SAS package. The satellite image was transformed into Transverse Mercado(TM) coordinate system by using 1/25000-scale standard topographic maps. Geometric correction was based on the first order polynomial equations.
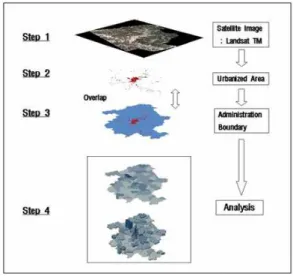
The process of identification of urban structure is illustrated in Figure 1. Step 1 reads the satellite images (Landsat TM 5) after geometric correction. Step 2 processes the images to identify urbanized areas through land cover analysis. Step 3 overlaps the identified urbanized areas over administration boundary map. Step 4 analyzes urban structure in various ways.
FIGURE 1. Process of identification of
urban structure
Region District 1995 2000 2005
Daegu Central 6.38 6.64 6.70
East 17.71 19.92 25.50
West 13.06 14.03 14.33
South 9.08 9.54 9.69
North 20.62 24.85 27.89
Suseong 17.88 20.44 22.75
Dalseo 23.18 30.46 33.79
Dalsung-gun 14.13 17.93 26.38
Subtotal 122.04 143.79 167.03
Youngcheon city 7.76 9.22 13.70
Gyungsan city 14.20 18.83 28.74
Gunwi-gun 2.91 3.13 3.68
Cheongdo-gun 3.73 3.99 6.02
Goryung-gun 5.39 6.11 8.97
Seongju-gun 4.71 5.46 7.52
Chilgok-gun 8.79 11.18 15.09
Changnyung-gun 13.58 14.67 18.01
Subtotal 61.07 72.59 101.75
Total 183.11 216.38 268.78
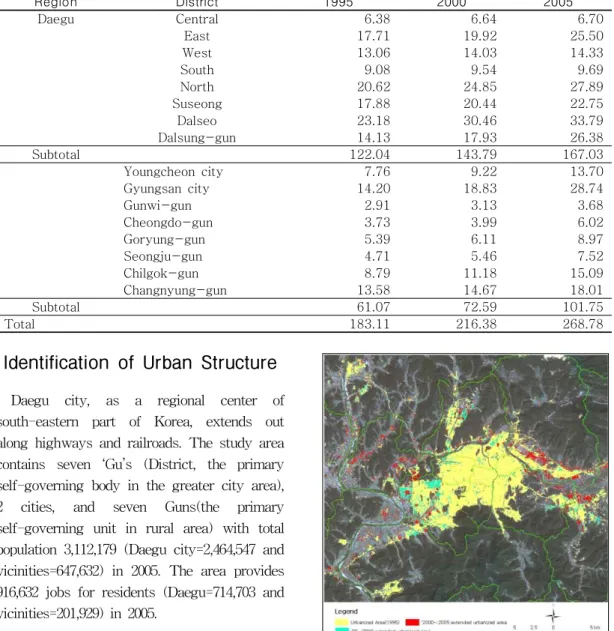
TABLE 1. Urban extents: 1995-2005(unit: ㎢)
Identification of Urban Structure
Daegu city, as a regional center of south-eastern part of Korea, extends out along highways and railroads. The study area contains seven ‘Gu’s (District, the primary self-governing body in the greater city area), 2 cities, and seven Guns(the primary self-governing unit in rural area) with total population 3,112,179 (Daegu city=2,464,547 and vicinities=647,632) in 2005. The area provides 916,632 jobs for residents (Daegu=714,703 and vicinities=201,929) in 2005.
1. Urban growth pattern
Statistics performed on classified images for Daegu metropolitan area showed a progressive increase in urban or built-up land occurring largely at the expense of farmland and forested area as shown in Figure 2, and Table 1.
FIGURE 2. Urban extents: 1995-2005
According to the satellite image analysis,
the urbanized area expanded from 183.11km2
in 1995 to 268.78km2 in 2005. According to
Figure 2, most of newly urbanized areas
between 1995 and 2000 arefound near
existing developed lands. However, the location and size of new development was changed severely between 2000 and 2005.
The urbanized area was well found at the outer side of the core city as vacant lands were not available inside core city. Heavy developments were undergone in western, eastern and northern parts of the city.
2. Urban Density Gradients
A density gradient is estimated by a simple two-variable regression model with population(employment) density as the dependent variable and distance from the CBD as the independent variable. The standard specification is the negative exponential, which takes the form:
(1) where Do is the model's estimate of the level of density at the center, d is the distance from the CBD, and βis the estimate of the coefficient on distance. For statistical estimation, the equation must be transformed into a linear expression by taking the natural log of both sides of the equation, which yield:
(2) 1) Population Density
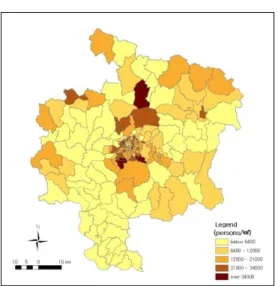
Density in this study refers net density rather than gross density. For example, the net population density can be calculated by dividing population by urbanized area ( ). Population density of the study area is 11,578.9 persons per square kilometer in 2005.
FIGURE 3. Population density: 2005 Estimating equation(2) using 1995, 2000 and 2005 population densities yield the Table 2, in which population density decreases about 15%
for each additional kilometer from CBD. The model explains 75.6-77.2 percent of the variation in population densities. All coefficients are statistically significant at α=0.01. As shown in Table 2, the population density in the CBD has decreased over time and the gradients have fluctuated slightly. These trends imply that the central city definitely loses its population and other areas gain/lose population over time depending on their locations.
A b N R2
1995 9.82
(80.26)
-0.15366
(-26.28) 225 0.756
2000 9.77
(82.84)
-0.15234
(-27.04) 225 0.766
2005 9.73
(82.85)
-0.15461
(-27.48) 225 0.772 NOTES: t-value in parentheses.
TABLE 2. Population density gradients from
monocentric density function: 1995~2005
(The dependent variable is in natural
logarithm form.)
2) Employment Density
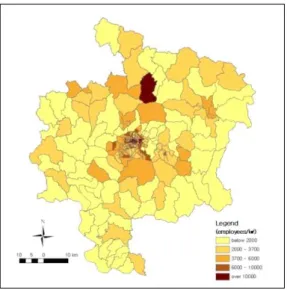
Figure 4 displays employment density for 225 zones(Up-Myeon-Dong, the primary administration units) in Daegu metropolitan area in 2005. Employment density is calculated by dividing the number of employment by
urbanized area ( ). The
average employment density across study area is 3,410.3 jobs per square kilometer in 2005 but varies widely. There is a general decline in employment density with distance.
Such spatial setting can be explained by a monocentric model. Empirically, we can measure the relationship between employment density anddistance, known as employment density gradients with a typical monocentric model.
FIGURE 4. Employment density: 2005 Employment density gradients of 1995, 2000 and 2005 estimated with equation (2) are presented in Table 3. The employment density gradients decrease about 16% for each additional kilometer from CBD. The
explanation power of employment density modelis similar with that of population with all coefficients are statistically significant at α =0.01.
A b N R2
1995 8.53
(62.46)
-0.16616
(-25.48) 225 0.744
2000 8.43
(66.38)
-0.15955
(-26.29) 225 0.756
2005 8.49
(68.40)
-0.16068
(-27.09) 225 0.767 NOTES: t-value in parentheses.
TABLE 3. Employment density gradients from monocentric density function: 1995-2005 (The dependent variable is in natural logarithm form.)
3. Identification of Employment centers There are many ways to define a center in an urban area. However, in general, a center can be defined as employment-dense area that exerts a significant influence on the urban area. Guiliano and Small(1991) set three standards for a center - employment density, the quantity of employment and continuity of zones. We follow their algorithm to identify a center, but with different cutoff criteria. According to them, 10 employment per acre and a minimum total employment of 10,000 are appropriate for the Los Angeles. We used 10,000 employment/km2as the density cutoff and 4,000 employees as the total employment cutoff because the density in Daegu city is much higher than that of in Los Angeles.
The identified a center and sub-centers of
2005 is shown in the following figures(Figure
5, 6, and 7). The three-dimensional map
(Figure 7) shows the relative density differences among zones. There are two centers –one in traditional central business district and another in newly emerging subcenter as result of employment susurbanization in study area. No employment center is found in hinterlands.
FIGURE 5. Employment density distribution: 2005
FIGURE 6. Identified employment centers: 2005
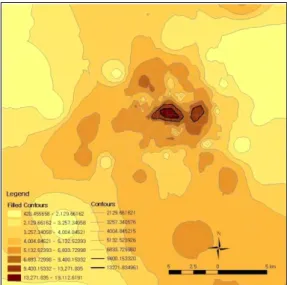
FIGURE 7. Contours of employment density : 2005
FIGURE 8. Employment density distribution in 3-D: 2005
Conclusion
So far, this study identifies spatial
structure of Daegu metropolitan city by
incorporating attribute data and spatial data
utilizing geographic information system
technique. In a wider perspective, spatial
structure of Daegu metropolitan area is well
explained by monocentric density function
with some coefficient variations. However, if
we limit analysis region to core city, the result of this study proves that Daegu metropolitan city as a non-megalopolis is in transition period in terms of urban structure with one dominant center and one emerging sub-center. Among many indices of center/sub-center identification, this study adopts employment density. The size and location of center and sub-center may have different shapes if other indices were employed. The better descriptionof urban spatial structure can be achieved through more rigorous examination by applying various indices. We keep this task as near future task.
References