• 검색 결과가 없습니다.

Genetic and phenotypic relationships of live body measurement traits and carcass traits in crossbred pigs of Korea

N/A
N/A
Protected

Academic year: 2021

Share "Genetic and phenotypic relationships of live body measurement traits and carcass traits in crossbred pigs of Korea"

Copied!
8
0
0

로드 중.... (전체 텍스트 보기)

전체 글

(1)

Genetic and phenotypic relationships of live body measurement traits and carcass traits in crossbred pigs of Korea

Chang-hee Do

1

*, Chan-hyuk Park

1

, Nidarshani Wasana

1

, Jae-gwan Choi

2

, Su-Bong Park

2

, Si-dong Kim

2

, Gyu-ho Cho

2

, Dong-hee Lee

3

1

Chungnam National University, Daejeon 305-764, Republic of Korea

2

National Institute of Animal Science, R.D.A., Chungnam, 331-801, Republic of Korea

3

University of Seoul, Seoul, 151-742, Republic of Korea

Received on 5 June 2014, revised on 21 July 2014, accepted on 7 August 2014

Abstract : This study presents the estimates of heritabilities of body measurement traits and carcass traits, and genetic and phenotypic correlations of those traits for crossbred pigs in Korea. Body and ultrasound (A mode: Piglog 105) measurements in 221 pigs including body weight, length, height and width, three back fat thickness at the points of 4th, 14th rib and chine bone, eye muscle area and lean meat percent were collected at the ages of 70, 145 and 180 days and then slaughtered to measure carcass weight, back fat, belly, collar butt, spare rib, picnic shoulder, hind leg, loin, tenderloin, lean meat yield and intramuscular rough fat content in loin. Genetic analysis was done using a multi-trait animal model. Heritabilties of the body measurements were ranged from 0.331 to 0.559 and three measurements of back fat thickness were also high as range varying from 0.402 to 0.475 for the ages of 145 and 180 days. However, eye muscle area was moderate (0.296) at the age of 180 days. Heritabilities of retail cut yields were also high as ranged from 0.387 to 0.474 and of IMF content in loin was 0.499. Heritabilities of the cut percent traits were ranged from 0.249 to 0.488. Important positive genetic and phenotypic correlations were noted for all carcass yield traits (0.298 to 0.875 and 0.432 to 0.922, respectively). IMF showed low negative genetic correlations with carcass yield traits, such as carcass weight, picnic shoulder, hind leg, loin, tenderloin and lean meat yield whereas low positive genetic correlations with back fat, belly, collar butt and spare rib. Loin, tenderloin and lean meat percent showed negative genetic correlations with carcass weight, back fat thickness, collar butt, spare rib and picnic shoulder percent. The four body measurements at the ages of 70, 145 and 180 days had positive genetic correlations with belly, shoulder butt, spare rib, picnic shoulder and hind leg percent, but negative genetic correlations were shown with loin and tenderloin percent except body measurements at 70 days. The results suggest that carcass yield are negatively correlated with intramuscular fat content, which is a major factor deciding pork quality and the yield of loin and tenderloin are not increased as much as increase in body size. However, the proportions of belly and collar butt are increased with the body size. In conclusion, selection strategy should be designed according to the preference on composition of carcass in each country.

Key words : Pork retail cuts, Body measurement, Genetic correlation, Heritability, Selection, Ultrasound A mode

*Corresponding author: Tel: +82-42-821-5784 E-mail address: [email protected]

I. Introduction

Preference on a cut among retail pork cuts is different in each country. Although loin is considered as the most popular pork cut in many countries (Fortomaris et al., 2006) pork belly is still the popular portion in domestic pork market (Cho et al., 2007) and its value is high as twice of loin in Korea. It is hardly achieved the balance

of consumption and production in retail cuts of pig in any country. Since growing lean to fat ratio of pig carcasses has been one of main objectives in breeding programs for many years, sub stantial increase in the b ody composition of pigs have been gained through genetic selection (Latorre et al., 2008).

Even though interests in improving preference

composition of carcass and better meat quality traits

have been increased due to the demand of consumers

and industry,( Dransfield et al., 2005; Ngapo et al.,

(2)

2007a,b; Vidal et al., 2005), the selection is being practiced mainly based on the growth traits in republic of Korea.

Therefore, an optimum selection strategy should aim at increasing the rate of growth and improving carcass composition and pork quality simultaneously.

Therefore, animal breeders are interested in the relationship among those traits. Thus the objective of this study was to estimate the heritabilities, genetic and phenotypic correlations of body measurements traits and carcass traits to understand the relationship of those traits of crossbred pigs (YLD, YLB and DB) in Korea.

II. Materials and Method

1. Data

The data was collected from commercial experimental farms for assessing crossbred YLD (Yorkshire, Landrace and Duroc), YLB (Birkshire) and DB in 2007 in South Korea, and data of 221 pigs with pedigree information were used after preliminary selection and restrictions.

The Body measurements including body weight, body length, body height, body width, ultrasound (A mode:

Piglog 105) measurements of three back fat thicknesses at the points of 4th rib (BF1), 14th rib (BF2) and chine bone (BF3), eye muscle area (EMA) and lean meat percent (Lean %) were collected according to the ages of 70, 145 and 180 days as shown in Table 1. Then, slaughtered after last body measurements. The carcass was split down the midline and the head was removed.

Carcasses were placed in a chiller (4°C) approximately 1h postmortem where they were held overnight. At 24-h postmortem, cold carcass weight was recorded, and carcass measurements were obtained from the left side of each carcass such as back fat, belly, collar butt, spare rib, picnic shoulder, hind leg, loin, tenderloin and lean meat yield. Moreover, intramuscular rough fat (IMF) content in loin was measured as follows.

Adhering adipose and connective tissue was removed from the longissimus muscle which was then ground and analyzed for moisture and fat (Association of Official Analytical Chemists, 1997). Moisture was determined gravimetrically by drying at 102 C for 24 h. Petroleum ether fat extractions were conducted for 10 min on the resultant dried product using a Tecator Soxtec Extraction System (Tecator AB, Hoganas, Sweden).

2. Statistical analysis

Genetic parameters were estimated using the multi- traits restricted maximum likelihood (MTREML) procedure based on an animal model, using the Wombat program (Meyer, 2010). The statistical model for the traits was as follows.

 

 

 

where 

is the vector of observations for the i

th

trait, and 

is the vector of fixed effects, including the breed, herd, sex, and a covariate of age days at measurement, which adjust the effects of age on the measurements. Sex includes gilts, and castrated. For random effects, 

is the vector of random animal effects for the i

th

trait, and 

is the vector of random residual effects. X and Z are incidence matrices relating records of a trait to fixed effects and random effects. If a

i

represents the vector of animal genetic effects for the traits, and represents the vector of residual effects, then the random effects can b e assumed to follow a normal distribution with zero mean and the following distribution parameters,



 

    

 

⊗ 

 ⊗

where A is the numerator relationship matrix; G is

a matrix accounting variance and covariance of the

genetic effect between traits and matrix I is the

(3)

Table 1. Genetic (upper diagonal) and phenotypic (lower diagonal) correlations and heritabilities of body and ultrasound measurements at the ages of 70, 145 and 180 days.

Body

weight Body length Body height Body width BF1 BF2 BF3 EMA Lean %

Body weight 0.559 0.803 0.720 0.779

70 days Body length 0.768 0.396 0.600 0.630

Body height 0.679 0.565 0.517 0.584 Body width 0.768 0.632 0.548 0.581

Body weight 0.347 0.781 0.682 0.724 0.514 0.511 0.554 -0.511

145 days Body length 0.708 0.331 0.586 0.455 0.356 0.406 0.480 -0.387 Body height 0.518 0.420 0.442 0.407 0.274 0.275 0.246 -0.271 Body width 0.627 0.329 0.226 0.529 0.422 0.535 0.431 -0.481

BF1 0.539 0.361 0.166 0.375 0.428 0.616 0.647 -0.634

BF2 0.453 0.366 0.154 0.460 0.547 0.431 0.624 -0.702

BF3 0.571 0.489 0.124 0.369 0.616 0.532 0.475 -0.693

Lean % -0.476 -0.360 -0.131 -0.408 -0.521 -0.563 -0.584 0.411

Body weight 0.544 0.537 0.540 0.606 0.370 0.359 0.293 0.039 -0.407 180 days Body length 0.564 0.546 0.363 0.156 0.202 0.188 0.143 -0.011 -0.245

Body height 0.615 0.387 0.655 0.252 0.145 0.155 0.127 -0.040 -0.166 Body width 0.570 0.185 0.276 0.531 0.429 0.421 0.328 0.099 -0.435

BF1 0.405 0.326 0.197 0.415 0.406 0.731 0.568 -0.206 -0.693

BF2 0.390 0.376 0.244 0.373 0.665 0.402 0.611 -0.173 -0.747

BF3 0.272 0.225 0.138 0.301 0.516 0.582 0.413 -0.119 -0.603 EMA -0.039 -0.052 -0.060 0.132 -0.100 -0.120 -0.146 0.296 0.342 Lean % -0.400 -0.380 -0.227 -0.389 -0.601 -0.678 -0.556 0.239 0.399

identity matrix of appropriate dimension in each case, and R is the covariance matrix of residual effects.

III. Results and Discussion

Generally, the heritability estimates of both body and ultrasound measurements (Table 1) were moderate to high ranging from 0.31 to 0.655 except for eye muscle area where heritability was 0.296 which is in the range of estimates done by Salces et al., (2006). The heritability of body weight, length, height and width at age of 70 days through 180 days were increased with age. Three ultrasound measurements of b ack fat thickness at the age of 145days are 0.428, 0.431, and 0.475 and minor deviations observed at the age at

180days. Lean percent has heritabilities of 0.411 and 0.399 at the age of 145days and 180 days respectively.

Marja et al., (2008) have estimated much similar

heritabilities for body weight traits. However, estimates

of Marja et al., (2008), Johnson and Nugent (2003) and

Tomiyama et al., (2009)  for body length, body height

and body width are considerably low values than estimates

of the present study. For the heritability of back fat

thickness, Marja et al., (2008) and Suzuki et al., (2005)

have found higher values between 0.72 and 0.65 whereas

Sánchez et al., (2013) has low estimation (0.23 to 0.29)

than the present study.  Moreover, our estimates are

according to the Ciob anu et al., (2011). Medium

heritability of Eye muscle area and Lean meat

percentage are in the range of previous estimations of

(4)

Table 2. Genetic (upper diagonal) and phenotypic (lower diagonal) correlations and heritabilities of retail cut yields and intramuscular rough fat content in loin.

Carcass

weight Back fat Belly Collar butt

Spare rib

Picnic shoulder

Hind

leg Loin Tenderloin Lean meat IMF Carcass weight 0.450 0.488 0.878 0.776 0.658 0.815 0.749 0.706 0.568 0.902 0.083 Back fat 0.417 0.474 0.457 0.251 0.274 0.174 0.160 0.209 0.072 0.289 0.197 Belly 0.832 0.365 0.444 0.648 0.559 0.713 0.579 0.571 0.432 0.804 0.237 Collar butt 0.727 0.207 0.553 0.448 0.606 0.839 0.748 0.729 0.544 0.873 -0.017 Spare rib 0.565 0.151 0.485 0.507 0.455 0.572 0.543 0.440 0.432 0.675 0.128 Picnic shoulder 0.770 0.087 0.633 0.741 0.506 0.408 0.809 0.741 0.620 0.922 -0.063 Hind leg 0.691 0.144 0.433 0.629 0.437 0.696 0.436 0.763 0.703 0.914 -0.140 Loin 0.629 0.149 0.431 0.637 0.298 0.596 0.700 0.418 0.615 0.847 -0.191 Tenderloin 0.527 0.095 0.377 0.420 0.360 0.498 0.638 0.485 0.407 0.690 -0.193 Lean meat 0.890 0.235 0.744 0.814 0.612 0.871 0.875 0.785 0.627 0.387 -0.030 IMF -0.007 0.059 0.205 0.035 0.182 -0.052 -0.134 -0.216 -0.110 -0.025 0.499

Salces et al., (2006) and Suzuki et al., (2005) and much higher heritability was estimated by Escriche et al., (2011) and Marja et al., (2008). All the traits are positively correlated with each trait and lean percentage negatively correlated with all the other traits.

Additionally, loin eye area showed a slight negative genetic correlation with traits other than lean meat percentage proving that Loin eye is associated with the lean growth of the pigs. Moreover, all the correlations at the age of 180days become comparatively low than early ages of pigs.

Moderate Heritability values were obtained for all the retail cut yields, IMF range varying from 0.48 (Picnic shoulder) to 0.474 (back fat) (Table 2) and reasonable results were reported by Newcom et al., (2002), Sánchez et al., (2013). As explained by Sellier, (1998) IMF found a moderate to high heritability (0.499) in the present study. S á nchez et al., (2013) and Suzuki et al., (2005) found heritabilities for IMF as 0.54, 0.48 and 0.46 respectively. Lean meat yield had a heritability of 0.387 which is fairly low than the results of Escriche et al., (2011). All retail cut traits are genetically and phenotypically correlated positively. However, important low genetic correlations were observed in Back fat with all retail cut traits indicating that increase in Back fat thickness causes reduction in meat yield. In contrast, the

Belly which is theoretically relative to the amount of back fat, showed a positive correlation with Back fat.

Present study obtained a low genetic and phenotypic correlation between IMF and other retail cut traits. Our estimates of genetic and phenotypic correlation between IMF and lean meat percentage were -0.03 and -0.25 respectively. Hovenier et al., (1992) reported -0.44 and -0.31 for Duroc and Dutch Large White pigs and Sonesson et al., (1998) examined 0.02 and -0.05 for Large White pigs. Therefore, we assume that lean meat percentage correlates negatively with IMF.

Heritabilities of percent retail cuts (Table 3) which

were obtained by taking it as a percentage of carcass

weight ranged from 0.249 (Tenderloin) to 0.500 (Belly)

and no considerable difference with the data in table

2 except percent Tenderloin. When considering the

genetic correlation between percent traits and carcass

weight, it showed large positive genetic correlation

with percentage Belly followed by Collar butt, Sparerib,

Picnic shoulder and Hind leg. That moderate with

percent Back fat thickness which needs to manage in

order to increase leanness and improve carcass con-

formation (Sanchez et al., 2013). As previously mentioned,

belly is the most expensive and demanding portion of

pork meat in Korea and people don’t concern much

about loin compared to US and Europe. Therefore,

(5)

Table 3. Genetic (upper diagonal) and phenotypic (lower diagonal) correlations and heritabilities of percentages of retail cuts from carcass weight and intramuscular rough fat content in loin.

Carcass

weight Back fat Belly Collar butt

Spare rib

Picnic

shoulder Hind leg Loin Tenderloin Lean meat IMF Carcass weight 0.523 0.484 0.882 0.791 0.680 0.824 0.740 -0.022 -0.270 -0.139 0.010 Back fat 0.569 0.488 0.458 0.257 0.270 0.161 0.152 -0.234 -0.378 -0.441 0.177 Belly 0.926 0.541 0.500 0.653 0.593 0.709 0.541 -0.129 -0.330 -0.149 0.196 Collar butt 0.866 0.452 0.739 0.411 0.620 0.826 0.741 0.241 -0.106 0.257 -0.046 Spare rib 0.843 0.325 0.874 0.728 0.320 0.607 0.554 -0.043 -0.114 0.095 0.115 Picnic shoulder 0.877 0.261 0.792 0.731 0.892 0.384 0.807 0.207 -0.044 0.296 -0.126 Hind leg 0.704 0.224 0.464 0.696 0.621 0.759 0.479 0.364 0.151 0.457 -0.221 Loin -0.312 -0.461 -0.523 -0.074 -0.390 -0.212 0.286 0.479 0.403 0.724 -0.396 Tenderloin -0.529 -0.494 -0.644 -0.448 -0.392 -0.319 0.127 0.554 0.249 0.552 -0.295 Lean meat -0.495 -0.665 -0.603 -0.277 -0.239 -0.179 0.201 0.766 0.772 0.467 -0.256 IMF -0.066 0.115 0.154 0.059 0.262 -0.135 -0.338 -0.570 -0.257 -0.184 0.582

swine breeders aim is to maximize belly portion in a carcass compare with other cuts. However, in the present study, lean meat percentage showed moderate to high positive genetic correlation varying from 0.257(Collar butt) to 0.724(Loin) yet negative with Back fat, Intramuscular fat and also Belly. Therefore, further studies are needed on those relationships.

However, high positive correlations were observed for IMF with all yield traits (Table3). As far as the pork quality is concerned IMF is an important trait that is related to the taste and intra-oral smoothness of meat (Suzuki et al., 2005).

Table 4 and 5 presents the genetic correlation of Body and Ultrasound measurements and Carcass yield traits and percentage traits respectively. As shown in tables, all body measurement traits such as Body weight, length, height and width are positively highly correlated with carcass weight and it increases with the age in both yield and percentage traits. There were relatively low genetic correlations ranged from 0.096 to 0.457 between body size traits and back fat yield while low to slightly high genetic correlations (0.143 to 0.669) between body size and Back fat percentage trait. Moderate to high genetic correlation (0.256 to 0.817) observed in Belly yield and body size traits and the correlation was similar to that of belly

percentage and body size traits (0.291 to 0.888). Both yield and percentage traits of Shoulder butt, Spare rib, Picnic shoulder and Hind leg showed moderate to high correlation with Body size traits and correlations are larger in percentage traits than yield traits while increasing them all with the increase of age.

However, Loin, Tenderloin and Lean meat percentage traits are negatively correlated with body measurements traits and negative relationships become weak with the growth of animals. In contrast, yield Loin, Tender loin and Lean meat are positively correlated with high to moderate values and positive relationships turn into strong with the growth of animals. Both yield and percentage IMF traits are low and negatively correlated with body measurements. Overall a significant decrease in that correlation could be observed when age increases.

In general, the thickness of the pork belly is related to the back fat content in a carcass. Similarly Belly is highly correlated with Ultrasound back fat thickness above all other carcass yield and percentage traits.

Moreover, when animals are grown correlations of back

fat thickness with both yield and percent traits become

weak. However, correlations of yield Loin and Tenderloin

with ultrasound Back fat are fluctuating around zero

whereas its percentage traits show high negative

correlation and decreases with age. Low, positive

(6)

Table 4. Genetic correlations of body measurements traits and yield traits in carcass.

Carcass weight

Back

fat Belly Shoulder butt

Spare rib

Picnic

shoulder Hind leg Loin Tenderloin Lean meat yield IMF Body weight 0.470 0.230 0.287 0.379 0.221 0.314 0.327 0.359 0.226 0.383 -0.337 70 days Body length 0.455 0.161 0.298 0.380 0.184 0.317 0.309 0.385 0.192 0.381 -0.312 Body height 0.596 0.148 0.415 0.469 0.371 0.511 0.464 0.485 0.403 0.552 -0.349 Body width 0.380 0.278 0.256 0.269 0.153 0.221 0.232 0.290 0.110 0.289 -0.294 145 days Body weight 0.842 0.366 0.728 0.613 0.531 0.617 0.456 0.478 0.437 0.703 -0.032 Body length 0.619 0.241 0.585 0.427 0.333 0.411 0.253 0.371 0.313 0.487 0.002 Body height 0.409 0.096 0.331 0.263 0.362 0.384 0.198 0.163 0.249 0.337 -0.003 Body width 0.593 0.373 0.521 0.418 0.392 0.448 0.311 0.270 0.185 0.481 0.067 BF1 0.457 0.438 0.406 0.267 0.196 0.147 0.040 0.077 0.147 0.218 0.076 BF2 0.401 0.413 0.392 0.176 0.144 0.133 0.008 -0.019 0.133 0.166 0.110 BF3 0.508 0.414 0.514 0.366 0.208 0.195 0.050 0.172 0.106 0.289 0.086 Lean % -0.430 -0.413 -0.358 -0.245 -0.168 -0.105 -0.055 -0.054 -0.060 -0.191 -0.183 180 days Body weight 0.956 0.326 0.817 0.748 0.600 0.795 0.715 0.657 0.602 0.864 -0.172 Body length 0.607 0.097 0.586 0.488 0.338 0.484 0.368 0.418 0.409 0.527 -0.096 Body height 0.584 0.161 0.472 0.374 0.336 0.460 0.453 0.423 0.492 0.518 -0.260 Body width 0.548 0.457 0.535 0.365 0.253 0.411 0.338 0.357 0.257 0.455 -0.090 BF1 0.437 0.473 0.396 0.269 0.191 0.199 0.139 0.144 0.182 0.254 -0.023 BF2 0.438 0.494 0.413 0.238 0.116 0.181 0.123 0.135 0.161 0.237 0.020 BF3 0.261 0.371 0.304 0.113 0.069 0.036 -0.039 0.003 -0.005 0.079 0.126 EMA -0.017 0.115 -0.028 0.053 -0.029 0.034 0.084 0.120 0.108 0.059 -0.099 Lean % -0.426 -0.452 -0.410 -0.172 -0.143 -0.174 -0.066 -0.078 -0.106 -0.196 0.056 Table 5. Genetic correlations body measurements and percentage traits in carcass.

Carcass weight

Back

fat Belly Shoulder butt

Spare rib

Picnic

shoulder Hind leg Loin Tenderloin Lean meat

yield IMF

Body weight 0.562 0.266 0.318 0.522 0.294 0.446 0.371 0.087 -0.487 -0.305 -0.481

70 days Body length 0.642 0.278 0.395 0.636 0.315 0.504 0.454 0.156 -0.482 -0.277 -0.534

Body height 0.890 0.228 0.711 0.799 0.664 0.802 0.674 0.120 -0.464 -0.198 -0.523

Body width 0.441 0.472 0.291 0.363 0.160 0.233 0.232 0.092 -0.503 -0.354 -0.425

145 days Body weight 0.944 0.557 0.887 0.821 0.766 0.797 0.527 -0.384 -0.648 -0.616 -0.020

Body length 0.834 0.551 0.860 0.701 0.619 0.566 0.356 -0.407 -0.691 -0.691 0.073

Body height 0.629 0.312 0.642 0.427 0.638 0.613 0.343 -0.444 -0.249 -0.412 0.087

Body width 0.795 0.664 0.723 0.636 0.657 0.654 0.459 -0.406 -0.631 -0.566 0.059

BF1 0.759 0.651 0.719 0.654 0.431 0.482 0.204 -0.465 -0.753 -0.841 -0.051

BF2 0.678 0.702 0.674 0.545 0.399 0.357 0.130 -0.624 -0.739 -0.883 0.182

BF3 0.716 0.586 0.741 0.679 0.420 0.402 0.122 -0.409 -0.840 -0.804 0.045

Lean % -0.723 -0.735 -0.704 -0.723 -0.488 -0.384 -0.236 0.553 0.685 0.779 -0.318

180 days Body weight 0.974 0.328 0.888 0.821 0.816 0.872 0.764 -0.047 -0.319 -0.102 -0.122

Body length 0.727 0.143 0.814 0.644 0.561 0.642 0.444 -0.085 -0.318 -0.142 -0.033

Body height 0.711 0.236 0.735 0.401 0.539 0.572 0.527 -0.077 0.027 -0.182 -0.283

Body width 0.708 0.669 0.628 0.514 0.447 0.509 0.490 -0.217 -0.288 -0.338 -0.145

BF1 0.556 0.665 0.562 0.394 0.258 0.281 0.152 -0.434 -0.425 -0.643 -0.066

BF2 0.551 0.582 0.632 0.396 0.223 0.241 0.105 -0.434 -0.418 -0.668 0.023

BF3 0.253 0.493 0.385 0.126 0.004 -0.111 -0.178 -0.472 -0.401 -0.733 0.222

EMA -0.112 0.311 -0.207 -0.037 -0.215 -0.062 0.161 0.216 0.486 0.280 -0.219

(7)

correlations of both yield and percentage IMF with ultrasound Back fat could be observed. For high quality meat, high IMF and low Back fat should be achieved. However Sanchez et al., (2013) mentioned that simultaneous genetic improvement of both IMF and Back fat is difficult because of their positive genetic correlation.

Eye muscle area shows low correlation with all yield traits range varying from -0.099 (IMF) to 0.12 (Loin) and moderate to low correlations with percent traits from -0.215 (Spare rib) to 0.486 (Tenderloin). Lean meat percentage is negatively correlated with all yield and percentage traits except IMF, percent Loin, Tenderloin. Negative correlations are significant with back fat and belly traits which are comprise with large fat amount. Finally, while predicted lean meat percentage in live pigs is weakly negatively correlated with lean meat yield, it showed strong positive cor- relation with percent lean meat in carcass.  In conclusion, The results of this study suggest that carcass yield are negatively correlated with intramuscular fat content, which is a major factor deciding pork quality and the yields of loin and tenderloin are not increased as much as increase in body size. However, the proportions of belly and collar butt are increased with the body size.

In conclusion, selection strategy should be designed according to the preference on composition of carcass in each country.

Acknowledgments

This work was carried out with the supported of

“Development of farm monitoring system for the national based improvement goal of swine and poultry.

(Project No PJ009274)” project of the National Institute of Animal Science, RDA, Korea.

References

Association of Official Analytical Chemists. (1997). Official Methods of Analysis (16th ed). Arlington, VA, US: Association

of Official Analytical Chemists.

Cho, S., Beomyoung, B., Ngapo, T.M., Kim, J., Dransfield, E., Hwang, I., and Lee, J. 2007. “Effect of meat appearance on south Korean consumers' choice of pork chops determined by image methodology.”, Journal of Sensory Studies, 22(1), pp. 99-114.

Ciobanu, D. C., Lonergan, S. M., and Huff-Lonergan, E. J.

2011. Genetics of Meat Quality and Carcass Traits. In M.F.

Rothschild and A. Ruvinsky (Eds.), The Genetics of the Pig (2nd edition,pp355-378). Chippenham, UK: CPI Antony Rowe.

Dransfield, E., Ngapo, T.M., Nielson, A.N., Bredahl, L., Sjödén, P.O., Magnusson,M., Campo,M.M., Nute, G.R. 2005. Consumer choice and suggested price for pork as influenced by its appearance, taste and information concerning country of origin and organic pig production. Meat Sci. 69, 61-70.

Escriche, N.I., Reixach, J., Lleonart, N., and Noguera., J. L.

2011. Genetic evaluation combining purebred and crossbred data in a pig breeding scheme. J. Anim. Sci. 89:3881-3889.

Fortomaris, P., Arsenos, G., Georgiadis, M., Banos, G., Stamataris, C., Zygoyiannis, D. 2006. Effect of meat appearance on consumer preferences for pork chops in Greece and Cyprus.

Meat Science 72 (4) 688-696.

Hovenier, R., Kanis, E., Van Asseldonk, Westerink, N.G. 1992.

Genetic parameters of pig meat quality traits in a halothane negative population. Livest. Prod. Sci. 32, 309-321.

Johnson, Z. B., and Nugent, III, R. A. 2003. Heritability of body length and measures of body density and their relationship to backfat thickness and loin muscle area in swine. J. Anim.

Sci. 81:1943-1949.

Latorre, M.A., Pomar, C., Faucitano, L., Gariépy, C., and Méthot, S. (2008). “The relationship within and between production performance and meat quality characteristics in pigs from three different genetic lines.”, Livestock Science, 115(2-3), pp. 258-267.

Marja, N., Stalder, K. J., Mote, B. E., Lampe, J., Thorn, B., Rothschild, M. F., Johnson, A. K., Karriker, L. A., and Serenius, T. (2008) “Heritabilities and Genetic Correlations of Body Composition and Structural Soundness Traits in Commercial Gilts,” Animal Industry Report: AS 654, ASL R2349. Available at: http://lib.dr.iastate.edu/ans_air/vol654/iss1/98 Meyer, K. 2010. WOMBAT: A program for mixed model

analyses by restricted maximum likelihood. Retrieved from http://didgeridoo.une.edu.au/km/homepage.php.

Newcom, D.W., Baas, T. J., Mabry, J. W. and Goodwi, R. N.

2002. Genetic parameters for pork carcass components. J.

Anim. Sci. 80:3099-3106.

Ngapo, T.M., Martin, J.F., Dransfield, E. 2007a. International preferences for pork appearance: I. Consumer choices. Food Qual. Prefer. 18, 26-36.

Ngapo, T.M., Martin, J.F., Dransfield, E. 2007b. International preferences for pork appearance: II. Factors influencing consumer choice. Food Qual. Prefer. 18, 139-151.

Salces, A. J., Kang Seok Seo, Cho, K. H., SiDong Kim, S. D.

and Lee, Y.C. 2006. Genetic Parameter Estimation of Carcass

(8)

Traits of Duroc Predicted Using Ultrasound Scanning Modes.

Asian-Aust. J. Anim. Sci.Vol. 19, No. 10:1379-1383.

Sánchez, J. H., Amills M, Pena RN, Mercadé A, Manunza A, Quintanilla R. 2013. Genomic architecture of heritability and genetic correlations for intramuscular and back fat contents in Duroc pigs. J. Anim. Sci. 91:623-632.

Sellier, P. 1998. Genetics of meat and carcass traits. In: Rothschild, M.F., Ruvinsky, A. (Eds.), The Genetics of Pigs. CAB Inter- national, New York, pp. 463-510.

Sonesson, A.K., de Greef, K.H., Meuwissen, T.H.E., 1998.

Genetic parameters and trends of meat quality, carcass composition and performance traits in two selected lines of large white pigs. Livest. Prod. Sci. 57, 23-32.

Suzuki, K., Kadowaki, H., Shibata, T., Uchida, H., Nishida, A.

2005. Selection for daily gain, loin-eye area, backfat thickness and intramuscular fat based on desired gains over seven generations of Duroc pigs. Livest. Prod. Sci. 97: 193-202.

Tomiyama, M., Oikawa, T., Hoque, M. A., Kanetani, T. and Mori, H. 2009. Influence of early postweaning traits on genetic improvement of meat productivity in purebred Berkshire pigs. J. Anim. Sci. 87:1613-1619.

Vidal, O., Noguera, J. L., Amills, M., Varona, L., Gil, M., Jiménez, N., Dávalos, G. and Folch J. M. 2005. Identi- fication of carcass and meat quality quantitative trait loci in a Landrace pig population selected for growth and leanness.

J. Anim. Sci. 83:293-300.

수치

Table 1. Genetic (upper diagonal) and phenotypic (lower diagonal) correlations and heritabilities of body and ultrasound measurements  at the ages of 70, 145 and 180 days.
Table 2. Genetic (upper diagonal) and phenotypic (lower diagonal) correlations and heritabilities of retail cut yields and intramuscular  rough fat content in loin.
Table 3. Genetic (upper diagonal) and phenotypic (lower diagonal) correlations and heritabilities of percentages of retail cuts from  carcass weight and intramuscular rough fat content in loin.
Table 4. Genetic correlations of body measurements traits and yield traits in carcass.

참조

관련 문서

First, when examining the differences in body composition between judo specialists and active sports participants, the BMI index and body fat mass were lower

In the change in body composition, body weight did not show a statistically significant change in all items in the exercise group and the control group,

2) In between-group comparison before and after elastic band exercise, a significant difference was found in the percentage of body fat, fat-free

• The fundamental relation between the forces acting on a rigid body in plane motion and the acceleration of its mass center and the angular acceleration of the body

• The fundamental relation between the forces acting on a rigid body in plane motion and the acceleration of its mass center and the angular acceleration of the body is

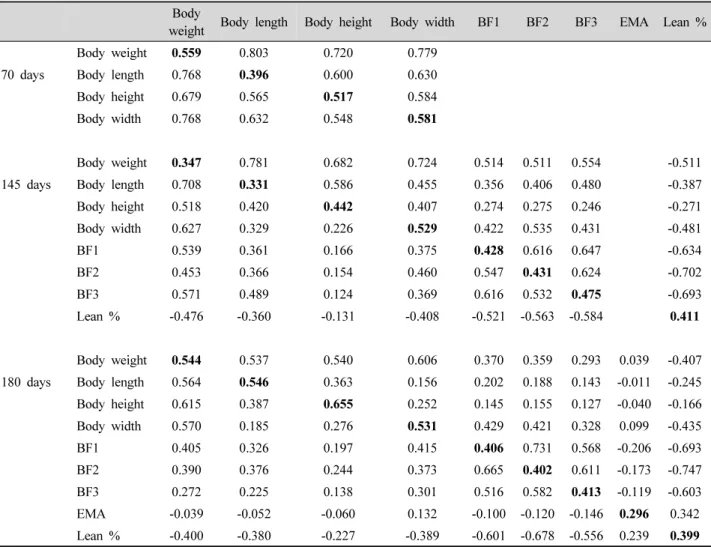
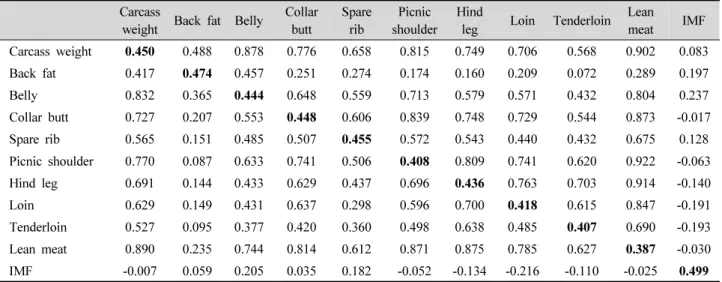
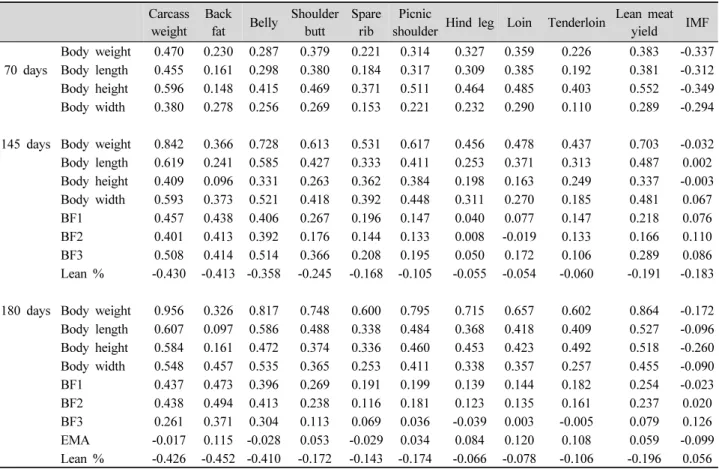
Analysis of body characteristics on olive flounder ( Paralichthys oilvaceus ) fed on the extruded and moist pellets (body weight, body length, body height and body width) · ·

As a result of a reviewing alternation of school uniforms difference used by body type that the thin body size and standard body size of perception

Quantitative genetic study of body measurements of the Marchado variety of the Mangalarga horse breed on Brazil - I., Estimates of genetic and