22(10); 1305~1316; October 2013 http://dx.doi.org/10.5322/JESI.2013.22.10.1305 ORIGINAL ARTICLE
Long-Term Wind Resource Mapping of Korean West-South Offshore for the 2.5 GW Offshore Wind Power Project
Hyun-Goo Kim*, Moon-Seok Jang, Suk-Hwan Ko Korea Institute of Energy Research, Daejeon 305-343, Korea
Abstract
A long-term wind resource map was made to provide the key design data for the 2.5 GW Korean West-South Offshore Wind Project, and its reliability was validated. A one-way dynamic downscaling of the MERRA reanalysis meteorological data of the Yeongwang-Gochang offshore was carried out using WindSim, a Computational Fluid Dynamics based wind resource mapping software, to establish a 33-year time series wind resource map of 100 m x 100 m spatial resolution and 1-hour interval temporal resolution from 1979 to 2012. The simulated wind resource map was validated by comparison with wind measurement data from the HeMOSU offshore meteorological tower, the Wangdeungdo Island meteorological tower, and the Gochang transmission tower on the nearby coastline, and the uncertainty due to long-term variability was analyzed.
The long-term variability of the wind power was investigated in inter-annual, monthly, and daily units while the short-term variability was examined as the pattern of the coefficient of variation in hourly units. The results showed that the inter-annual variability had a maximum wind index variance of 22.3% while the short-term variability, i.e., the annual standard deviation of the hourly average wind power, was 0.041±0.001, indicating steady variability.
Key words : Korean west-south offshore, HeMOSU offshore meteorological tower, Wind resource map, Dynamic downscaling, MERRA reanalysis data, WindSim, Long-term variability, Coefficient of variation
1. Introduction1)
The Ministry of Industry, Commerce and Energy announced the “Master Plan for the 2.5 GW Offshore Wind Farm in West-South Offshore” at the end of 2011 with the aim of becoming one of the world’s top three countries of offshore wind power. As a first step in this process, a pilot 100 MW offshore wind farm will be constructed in the Yeongwang-Gochang offshore by 2014.
The Master Plan came about as a result of the
“Demonstration of the Offshore Wind Farm” (KIER, Korea Institute of Energy Research), the “Development
of a 3 MW Offshore Wind Turbine” (Doosan Heavy Industries & Construction Co.), and the “Development of a High-Resolution Offshore Wind Atlas of the Korean Peninsula and a Feasibility Assessment System of Offshore Wind Farm" (KIER). The candidate sites for the offshore wind farm were selected (Kim et al., 2009a) using a high-resolution wind atlas (Kim et al., 2011a). Thereafter, the Yeongwang-Gochang offshore was finalized (Kim et al., 2009b; Kim and Hwang, 2010) as a result of the “Feasibility Study on the Mid-sized Offshore Wind Power Plant in Korean Coastal Areas" (KEPRI, Korea Electric Power Research Institute) in 2008, and the actual offshore
Received 12 August, 2013; Revised 14 Ocotber, 2013;
Accepted 21 October, 2013
*Corresponding author : Hyun-Goo Kim, New & Renewable Energy Resource Center, Korea Institute of Energy Research, Daejeon 305-343, Republic of Korea
Phone: +82-42-860-3376 E-mail: [email protected]
ⓒ The Korean Environmental Sciences Society. All rights reserved.
This is an Open-Access article distributed under the terms of the Creative Commons Attribution Non-Commercial License (http://
creativecommons.org/licenses/by-nc/3.0) which permits unrestricted non-commercial use, distribution, and reproduction in any medium, provided the original work is properly cited.
wind development was initiated by installing an offshore meteorological tower in 2010 (Lee et al., 2011a; Ryu et al., 2011). Based on such strategic research, the Ministry of Industry, Commerce and Energy prepared the offshore wind roadmap at the end of 2011 (Lee et al., 2011b), and the “Pilot-Stage Research for the 2.5 GW West-South Offshore Wind” (KEPRI) began.
At this point, the preparation of a highly reliable micrositing wind resource map was urgently needed for the engineering design of the Yeongwang- Gochang 100 MW pilot offshore wind farm.
The micrositing wind resource map constitutes essential data for the implementation design of the offshore wind farm, in particular for selecting the offshore wind turbine model (Oh et al., 2011), for estimating extreme wind speeds in designing the offshore structure (Kim et al., 2011b), and for calculating the available working time for the installation of the offshore structure (Kim et al., 2012). Consequently, it requires a spatial resolution of up to several hundreds of meters and a time series of ten years or more for its long-term correction.
As the first stage of this study, the long-term wind resource map was made to provide the key design data for the 2.5 GW West-South Offshore Wind Project, and its reliability was validated.
For the long-term wind resource map, a one-way dynamic downscaling of the MERRA reanalysis meteorological data of the Yeongwang-Gochang offshore was carried out using WindSim (WindSim AS, 2012), a Computational Fluid Dynamics (CFD) based wind resource mapping software, to establish a 33-year time series wind resource map of 100 m x 100 m spatial resolution in the horizontal plane and 1-hour interval temporal resolution.
Secondly, in order to quantitatively evaluate the accuracy of the simulation, the wind resource map was compared with measurement data from the 100 m high HeMOSU, which is Korea’s first offshore
meteorological tower installed in the Yeongwang- Gochang offshore at the end of 2010; the 120 m high transmission tower installed in the Gochang Power Test Center on the nearby coastline; and the Wangdeungdo Island meteorological tower.
Finally, the validated design data were used to analyze the variability of the wind power at the 2.5 GW West-South Offshore Project site in terms of the wind index and the coefficient of variation (COV) by separately examining the long-term variability based on inter-annual, seasonal, monthly, and daily units as well as short-term variability at the hourly level.
The wind index is the ratio of actual short-term production to long-term monthly average production.
2. Analysis data
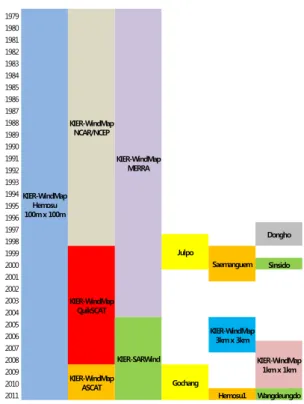
The period of the long-term wind resource reanalysis data and the short-term wind resource measurement data are shown as a diagram in Fig. 1.
1979
KIER-WindMap Hemosu 100m x 100m
KIER-WindMap NCAR/NCEP
KIER-WindMap MERRA 1980
1981 1982 1983 1984 1985 1986 1987 1988 1989 1990 1991 1992 1993 1994 1995 1996
1997 Dongho
1998
Julpo 1999
KIER-WindMap QuikSCAT
Saemanguem
2000 Sinsido
2001 2002 2003 2004 2005
KIER-SARWind
KIER-WindMap 3km x 3km 2006
2007
KIER-WindMap 1km x 1km 2008
2009 KIER-WindMap
ASCAT Gochang
2010
2011 Hemosu1 Wangdeungdo
Fig. 1. Temporal coverage of long-term reanalysis and short- term measurement data sets.
2.1. Long-term wind resource reanalysis data sets The long-term wind resource analysis data to be used as the input for the CFD software and one-way downscaling to make the micrositing wind resource map of the Yeongwang-Gochang offshore are as follows:
2.1.1. KIER intermediate-resolution Korea wind atlas KIER developed the Korea Wind Atlas of intermediate-resolution (3 km × 3 km) with 1-hour intervals over a period of three years, from 2005 to 2007, using a meso-scale Numerical Weather Prediction (NWP) model, MM5 (Lee et al., 2009).
2.1.2. KIER high-resolution Korea wind atlas KIER also developed a high-resolution Korea Wind Atlas (1 km × 1 km) with 10-min intervals for two years, 2007 and 2010, using a next-generation meso-scale NWP model, WRF (Kim and Kang, 2012).
2.1.3. Long-term MERRA reanalysis data MERRA (Modern Era Retrospective-analysis for the analysis of Research and Applications), which consists of the latest reanalysis data, was developed by the US NASA GMAO (Global Modeling and Assimilation Office) beginning in 2002 and started producing official data from 2008 after third-party verification in 2007. The spatial and temporal resolutions of the MERRA reanalysis data have been improved dramatically. Therefore many papers report that the MERRA guarantees sufficient accuracy for use in the long-term correction of wind resources (Rienecker et al., 2011; Jimenez et al., 2012).
This study used the MERRA data at the grid point (35°30’N, 126°E) over 33 years from 1979 to 2011 where the Yeongwang-Gochang offshore is included.
The spatial resolution of MERRA is 1/2 degrees latitude x 2/3 degrees longitude.
2.2. Short-term wind resource measurement data The in situ measurements available for the validation
of the micrositing wind resource map include the measurement data from the HeMOSU offshore meteorological tower and subsidiary wind resource data measured on the nearby coastline and islands.
Fig. 2 shows the in situ measurement points located at the Yeongwang-Gochang offshore, coastline, and various islands.
2.2.1. Offshore meteorological tower measurement data
As the first phase of the “Pilot-Stage Research for the 2.5 GW West-South Offshore Wind”, a 100 MW offshore wind farm will be constructed in the Yeongwang-Gochang offshore. In the preliminary step, a 100 m high HeMOSU (Herald of Meteorological and Oceanographic Special Unit; 35°27’55.17”N, 126°07’43.30”E), Korea’s first offshore meteorological tower, was installed (Lee et al., 2011a). The HeMOSU offshore meteorological tower has been measuring the wind speed and meteorological data at nine different heights since October 2010 (see Fig. 3 (a)).
2.2.2. Coastal meteorological tower measurement data
Anemometers were mounted on a transmission tower (35°27’43”N, 126°26’59”E, 21 m above sea level) located in the Gochang Power Testing Center, which is positioned on the coast 28 km east of HeMOSU. As shown in Fig. 3 (b), pairs of wind vanes and anemometers were installed at right and left arms at the heights of 80, 100, and 120 m.
Measurements began in November 2008.
2.2.3. Island meteorological tower measurement data
For further measurements, another set of wind vanes and anemometers were installed on a broadcasting tower (35°39’43”N, 126°06’24”E, 184 m above sea level) on the Sangwangdeungdo Island 22 km north of HeMOSU. A 4 m pole was added to the 8 m high broadcasting tower installed at the highest point of the island and sensors were installed. Measurements
began in May 2011. As shown in Fig. 3 (c), some indirect interference is expected in the measured data because of the broadcasting facilities.
Fig. 2. Locations of in situ measurement sites around Yeongwang-Gochang offshore.
(a) (b) (c)
Fig. 3. Photographs of meteorological towers (a) HeMOSU, (b) Gochang transmission tower, and (c) Wangdeungdo broadcasting tower.
3. Analysis method
3.1. Wind resource mapping
Since the atmospheric wind flow is a nonlinear dissipative dynamical system, it is sensitive to the
initial condition and boundary condition. Therefore, the practical prediction method of atmospheric wind field is ensemble averaging of the physical model and stochastic parameterization of the subgrid scale process. The RANS (Reynolds-Averaged Navier Stokes) model predicts the averaged wind field by superposing the wind field variation with time using such a method (Haupt et al., 2011).
To predict the atmospheric wind field at the level needed for the area of interest, the analysis result of the meso-scale model is nested down into the micro-scale of the denser grid system, and dynamic downscaling is performed to assign the initial condition and boundary condition of the micro-scale model using the above ensemble averaging and stochastic parameterization (Landberg et al., 2006).
In the case of a wind resource map of several kilometers in spatial resolution, which is produced by assimilating the global reanalysis data to the meso- scale NWP model, its spatial resolution is limited to be used for the feasibility study of wind farm development.
Therefore, a wind resource map of the resolution of 100 m or less is produced by assimilating the meso-scale NWP result again to the CFD model through dynamic downscaling (Dierer et al., 2009).
Instead of two-stage dynamic downscaling of MERRA - NWP - CFD, this study applied direct one-stage downscaling of MERRA - CFD wind mapping of 100 m resolution.
Since the main wind direction is the northwest wind, which comes from the west sea with respect to Yeongwang-Gochang offshore, the topographic forcing of the land is relatively weak, and thus it was judged that such a one-stage downscaling method would be effective.
For the details of NWP and CFD (WindSim) downscaling, please refer to Meissner and Weir (2011).
3.2. Variability analysis of wind power generation The variability of wind speed is linked to the variability of wind power. Since the wind power is proportional to the cube of the wind speed, the variation can be large. While the short-term fluctuation of wind speed and wind power has the turbulent characteristics of being stochastic in nature, the long-term fluctuation generally has a specific pattern.
A wind index was used to analyze the inter-annual, seasonal, monthly, and daily long-term variability.
Using the design data produced by the WindSim simulation, the wind power generated by the Vestas V90 3 MW offshore wind turbine was estimated, and the relative variability to the 33-year average was calculated.
The short-term variability was analyzed using the COV of wind power (Wan, 2012). For the standard deviation of wind power, the hourly data were used.
The COV is defined as the ratio of the standard deviation to the average, and the COV of wind is the turbulence intensity. It should be noted that the atmospheric boundary-layer turbulence is generated by the wind speed gradient caused by the friction with the ground and change of the atmospheric stability.
3.3. Uncertainty analysis of wind power
To determine the period of short-term measurements needed for long-term wind resource assessment, an uncertainty analysis was performed using the following coefficients. Assuming the long-term average wind speed to be VLT and the standard deviation and maximum value of the short-term wind speed to be σST and XST, respectively, the uncertainty of the short- term data period is calculated with autocorrelation of the standard deviation of estimates σST / VLT and worst-case estimates XST / VLT (Salmon and Walmsley, 1999). It should be noted that σST / VLT is equivalent to the COV defined above, and XST / VLT is equivalent to the maximum COV value during the period.
4. Results and implications
4.1. Verification of wind resource map
4.1.1. Correlation of short-term wind resource measurement data
For generating representative wind statistics of the Yeongwang-Gochang offshore where the 2.5 GW offshore wind farm will be constructed, the HeMOSU offshore meteorological tower was installed, and, additionally, a nearby coastal meteorological tower and island meteorological tower were operated.
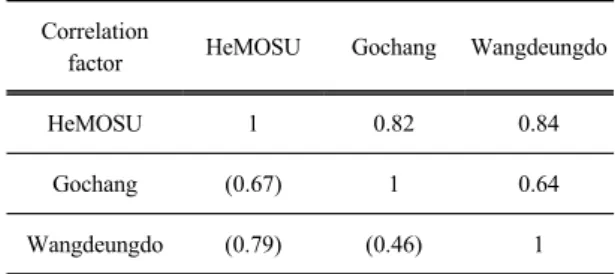
These subsidiary meteorological towers must have high meteorological correlation with HeMOSU. Table 1 shows the correlation factor of 10-min average time series of wind speed. Both Gochang and Wangdeungdo have a correlation factor of more than 0.8 with HeMOSU, indicating high meteorological correlation.
Gochang and Wangdeungdo are 38 km apart and have islands between them. Thus, the correlation factor is the lowest at 0.64, and the coefficient of determination (R2) is the lowest at 0.46.
Table 1. Correlation factor and coefficient of determination (R2) between in situ datasets of wind speed Correlation
factor HeMOSU Gochang Wangdeungdo
HeMOSU 1 0.82 0.84
Gochang (0.67) 1 0.64
Wangdeungdo (0.79) (0.46) 1
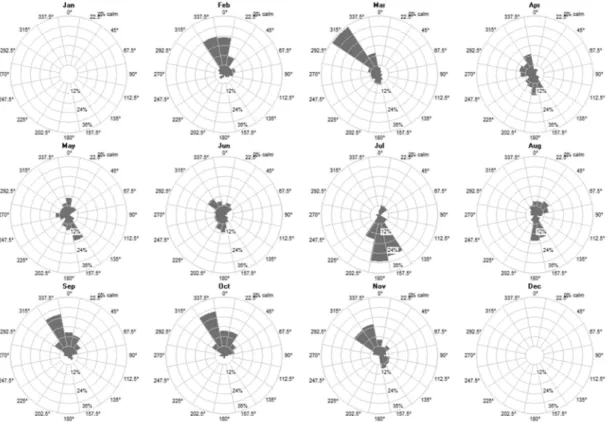
Fig. 4 shows a comparison of the wind roses of HeMOSU and MERRA during the same period at 100 m above sea level (a.s.l.). It indicates the same main wind direction and frequency. Fig. 5 shows the monthly wind roses at HeMOSU. They indicate the characteristics of monsoon weather by showing the prevailing north-northwestern wind (continental climate) in the fall and winter seasons from September and
Fig. 5. Monthly wind roses at HeMOSU.
Fig. 4. Wind roses at 100 m a.s.l. Left: MERRA. Right: HeMOSU.
March and strengthened southern wind (oceanic climate) in the summer season between July and August.
4.1.2. Long-term wind resource map validation The MERRA reanalysis data were one-way down-
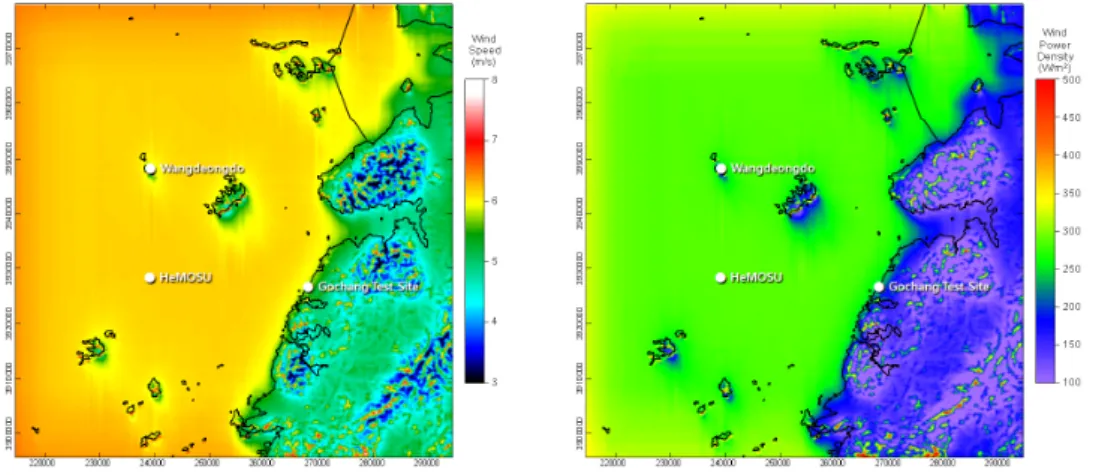
scaled by WindSim, a CFD micrositing software, to make the long-term wind resource map of the Yeongwang- Gochang offshore. Fig. 6 shows the distribution map of (a) average wind speed and (b) mean wind power density. It shows that the HeMOSU location and the
(a) Mean wind speed at 50 m a.s.l.
(b) Mean wind power density at 50 m a.s.l.
Fig. 6. Wind resource map simulated by WindSim with MERRA reanalysis data.
(a) Wind speed
(b) Wind direction Fig. 7. Comparison of simulated results with HeMOSU measurements.
planned 100 MW test complex area (in between HeMOSU and the north-eastern island) have almost uniform wind resource distribution. However, there are areas of lower wind speed owing to the shading effect of geographical features toward the south-southeast, which is the opposite direction of the main wind direction in the mapping area.
Centered on HeMOSU, the maximum heights of Wangdeungdo Island (200 m a.s.l.) in the north, Wido Island (250 m a.s.l.) in the northeast, and Anmado Island (170 m a.s.l.) in the southwest are
between 170~250 m, taller than a 1 MW class wind turbine. Moreover, as the 100 MW pilot wind farm in the dotted square in Fig. 2 is only 6 km off from Wido in the northeast, if there is a leeside wake generated by the island when the wind blows toward the offshore wind farm, it can affect the wind power generation. Further review is needed to investigate this closer.
For validation, the time series data of the wind resource map at the HeMOSU position and the HeMOSU measurement data were compared in Fig.
In-situ site Measurement period Correlation factor Coefficient of determination R2
KIER-WindMap 3km 2005.01.01-2007.12.31 0.81 0.77
KIER-WindMap 1km 2007.01.01-2007.12.31 0.84 0.71
HeMOSU 2010.10.18-2011.12.09 0.85 0.71
Gochang 2008.11.22-2011.09.27 0.79 0.62
Wangdeungdo 2011.05.01-2012.05.01 0.69 0.46
Table 2. Comparison of simulated results with in situ measurements of wind speed
Measurement height
(m a.s.l.) Correlation factor Linear regression slope Coefficient of determination R2
97.35 0.85 1.05 0.71
86.31 0.84 1.02 0.69
76.31 0.84 1.02 0.69
66.31 0.84 1.04 0.69
56.31 0.83 1.01 0.68
46.31 0.84 1.00 0.69
26.31 0.84 1.00 0.68
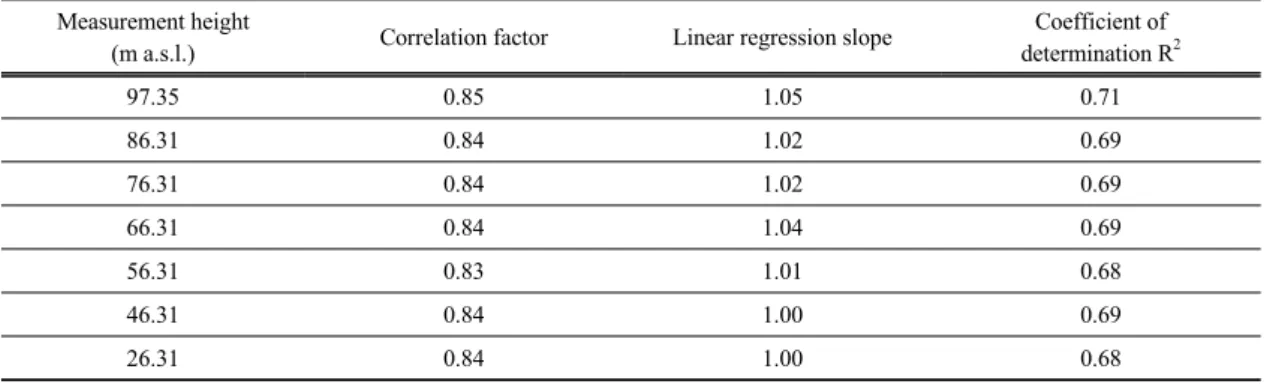
Table 3. Comparison of simulated results with HeMOSU measurements of wind speed.
7. The scatter plot of the wind direction shows disconnections at 135° and 170°. These sections correspond to the shading effect caused by the HeMOSU offshore meteorological tower. As Fig. 4 shows, these sections are the sections of the least frequent wind direction, thus this study did not consider the shading effect of the offshore meteorological tower.
Table 2 shows the comparison of the long-term time series wind speed data simulated by the CFD software with the short-term in situ measurements. It shows high correlation factors of 0.8 or higher at different periods. The R2 values of KIER’s intermediate- resolution and high-resolution wind resource map and the HeMOSU offshore meteorological tower measured data were 0.7 or higher.
Table 3 summarizes the suitability of different measurement heights of the HeMOSU offshore meteorological tower. At all heights, the correlation
factors were 0.8 or higher and R2 were 0.7 or higher.
These comparisons confirm that the long-term wind resource map generated by one-way downscaling matches the in situ measurements well.
4.2. Long-term wind power variability
To analyze the long-term variability of wind power, the wind power generation history was calculated by applying the Vestas V90 3 MW offshore wind turbine as a prototype model. The specifications of V90 are a hub height of 105 m and a rotor diameter of 90 m. Any loss such as the wake effect was not considered, and only a single wind turbine was considered.
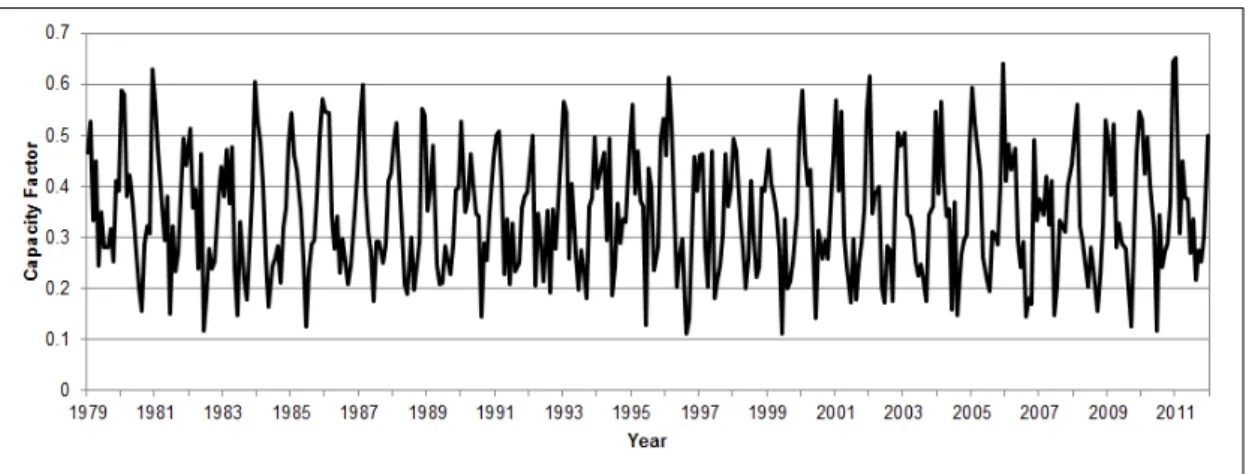
Fig. 8 shows the monthly capacity factor of V90 over 33 years. Although it shows the clear distinction of seasons, the breadth shows a big difference each year. The monthly averaged capacity factor is 0.35±0.12 with the maximum and minimum values of 0.65 and 0.11, respectively.
Fig. 8. Monthly variation of the capacity factor of a V90 wind turbine installed at the HeMOSU site.
The capacity factor is defined as the ratio of the actual energy produced in a given period to the ideal maximum possible, i.e., running full time at rated power.
4.2.1. Inter-annual variability of wind power Fig. 9 shows the annual change of the wind index and the COV. The maximum variance of the wind index is 12.17-(-10.15)=2.32%. However, the annual COV calculated with the daily average capacity factor shows a relatively small variance of 0.89±0.03.
Fig. 9. Inter-annual variation of the wind index (bars) and the COV (symbols with line).
4.2.2. Monthly variability of wind power Fig. 10 shows the monthly variance of the capacity factor. Because of the seasonal change of the wind
speed, it shows a cycle of increase in the winter and decrease in the summer. The seasonal difference is about 0.3.
Fig. 11 shows the monthly variance of COV. It shows the opposite trend of the monthly variance of the capacity factor shown in Fig. 10. It should be noted that the monthly COV is calculated with the hourly capacity factor time series data.
The COV is around 50% higher in the summer than in the winter, meaning that the short-term variance of wind speed in the summer is larger than in the winter. It can be explained by the seasonal characteristic of prevailing strong north-northwestern wind in the winter as shown in Fig. 5.
Fig. 10. Monthly variation of the capacity factor.
Fig. 11. Monthly COV of the wind power.
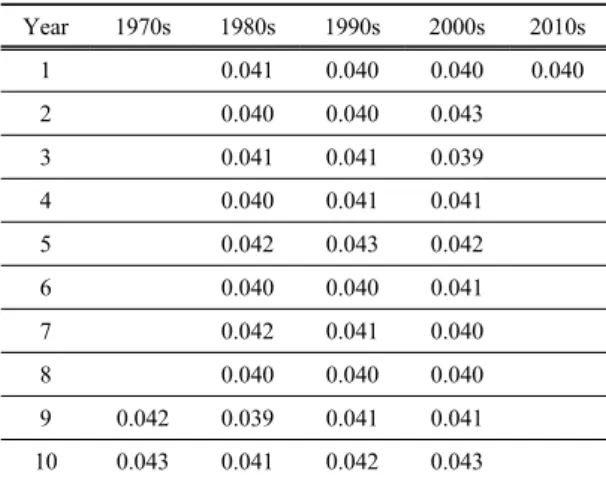
Table 4 shows the short-term variance of wind power. The annual standard deviation of the hourly power levels are normalized with the nameplate capacity of the wind turbine(3MW). As described above, it indicates that the long-term wind power, i.e., the inter-annual, seasonal, and monthly data, show large variances while there is little change in the short-term variance. Although the weather conditions can change greatly from year to year, the short-term variance or fluctuation is maintained uniformly because of the characteristics of wind.
Year 1970s 1980s 1990s 2000s 2010s
1 0.041 0.040 0.040 0.040
2 0.040 0.040 0.043
3 0.041 0.041 0.039
4 0.040 0.041 0.041
5 0.042 0.043 0.042
6 0.040 0.040 0.041
7 0.042 0.041 0.040
8 0.040 0.040 0.040
9 0.042 0.039 0.041 0.041
10 0.043 0.041 0.042 0.043
Table 4. Standard deviation of hourly power level changes (normalized to plant nameplate capacity)
4.3. Long-term wind power uncertainty
Figs. 12 and 13 show the uncertainty of monthly and yearly capacity factors, respectively. The solid
line represents the worst-case estimate (XST / VLT) while the dotted line represents the standard deviation of the estimate (σST / VLT) in percentage.
For continuous measurements of at least 12 months, the worst-case estimate and standard deviation estimate of the uncertainty of monthly capacity factors decrease to 16% and 5.5%, respectively.
For continuous measurements of at least 5 years, the worst-case estimate and standard deviation estimate of the uncertainty of yearly capacity factors decrease to 2% and 1.4%, respectively.
Fig. 12. Uncertainty of the capacity factor as a function of month.
Fig. 13. Uncertainty of the capacity factor as a function of year.
5. Conclusions
A long-term wind resource map, which is to provide the key design data for the 2.5 GW West-South Offshore Wind Project, was established, and the
long-term and short-term variability and uncertainty of the wind power were quantitatively evaluated.
The main conclusions of this project can be summarized as follows:
(1) MERRA reanalysis meteorological data of the Yeongwang-Gochang offshore were one-way downscaled using WindSim, a CFD micrositing software, to make a long-term time series wind resource map of 100 m spatial resolution and 1-hour temporal resolution over 33 years.
(2) The reliability of the generated wind resource map was validated by comparing the simulated data with the measured wind resource data of the HeMOSU offshore meteorological tower, Wangdeungdo Island meteorological tower, and Gochang transmission tower at the nearby coast.
(3) Analysis of the long-term variance shows that the annual wind index has a maximum of 22.3%
variance while the monthly variation of the capacity factor has a width of 0.3. The capacity factor shows a cycle of increasing value in the winter and decreasing value in the summer.
(4) Analysis of the short-term variance shows that the annual standard deviation of the hourly average wind power is 0.041±0.001, indicating an almost uniform variance.
(5) When using at least 12 months of data, the worst-case estimate and standard deviation estimate of the uncertainty of monthly capacity factors decrease to 16% and 5.5%, respectively. When using at least 5 years of data, the worst-case estimate and standard deviation estimate of the uncertainty of yearly capacity factors decrease to 2% and 1.4%, respectively.
Acknowledgements
This work was supported by the New & Renewable Energy of the Korea Institute of Energy Technology Evaluation and Planning (KETEP) grant (No.
20113040020010) and the Missionary Project of the Korea Institute of Energy Research (KIER) grant (GP2009-0051) funded by the Ministry of Trade, Industry and Energy.
References
Dierer, S., Remund, J., Schaffner, B., Stauch, V., Hug, C., Wind power predictions for Switzerland: the performance of different downscaling methods for complex terrain, European Wind Energy Conference 2009, Marseille, France, 2009.
Haupt, S. E., Zajaczkowski, F. J., Schmehl, K. J., Down- scaling by assimilating NWP fields into a CFD model, 91st American Meteorological Society Annual Meeting, Washington, US, 2011.
Jimenez, B., Moennich, K., Durante, F., 2012, Comparison between NCEP/NCAR and MERRA reanalysis data for long-term correction in wind energy assessment“, EWEC 2012, Copenhagen, Denmark.
Jung, W. S., Lee, H. W., Park, J. K., Kim, H. G., Kim, E. B., Choi, H. J., Kim, D. H., Kim, M. J., 2009, Classification of wind sector for assessment of wind resource and establishment of a wind map in South Korea, J. Environmental Sciences, 18(8), 899-910.
Kim, H. G., Song, K. B., Hwang, S. Y., Yun, J. H., Hwang, H. J., 2009a, Analysis on siting strategy for offshore wind farm based on national wind map and GIS, J. Environmental Sciences, 18(8), 877-884.
Kim. J. Y., Kang. K. S., Oh, K. Y., Lee, J. S., Ryu, M. S., 2009b, Assessment of possible resources and selection of preparatory sites for offshore wind farm around Korean Peninsula, J. Korean Society for New and Renewable Energy, 5(2), 39-47.
Kim, H. G., Hwang, H. J., 2010, Review on the proposed offshore wind farm projects using national wind atlas and national geographic information, J. Korean Solar Energy Society, 30(5), 44-55.
Kim, H. G., Kang, Y. H., 2012, The 2010 Wind resource map of the Korean Peninsula, J. Wind Engineering Institute of Korea, 16(4), 167-172.
Kim, H. G., Lee, H. W., Lee, S. H., 2011a, Development of the Korea wind resource map and suitability
assessment system for offshore wind farm, J. Wind Energy, 2(2), 17-23.
Kim, J. Y., Oh, K. Y., Lee, J. S., 2011b, An estimation of extreme wind speed according to return periods of demonstration offshore wind farm in the southern part of west sea, J. Wind Energy, 3(1), 10-18.
Kim, J, K., Kim, J. Y., Lee, J. S., 2012, Analysis on offshore working time of demonstration offshore wind farm in the southern part of west sea, J. Wind Energy, 3(1), 19-26.
Landberg, L., Giebel, G., Madsen, H., Nielsen, T. S., Nielsen, H. A., 2006, Short-term (30min-72hrs) prediction for power output from wind farms, VKI Lecture Series, Von Karman Institute for Fluid Dynamics, Sint-Genesius-Rode.
Lee, S. H., Lee, H. W., Kim, D. H., Kim, M. J., Kim, H.
G., 2009, Numerical study on the impact of the spatial resolution of wind map in the Korean Peninsula on the accuracy of wind energy resources estimation, J. Environmental Sciences, 18(8), 885-897.
Lee, J. K., Oh, K. Y., Ryu, M. S., Lee, J. S., 2011a, Integrated measurement system for offshore meteorological mast of offshore wind farm, J. Wind Energy, 2(1), 53-60.
Lee, J. S., Kang, K. S., Park, B. M., Won, Y. J., Ahn, N.
S., 2011b, A study on current status and outlook of offshore wind development in Korea, J. Wind Energy, 2(1), 6-14.
Meissner, C. and Weir, D., 2011, Utilizing WRF data in CFD models for wind energy assessment, European Wind Energy Conference 2011, Brusseles, Belgium.
Oh, K. Y., Kim, J. Y., Lee, J. K., Ryu, M. S., Lee, J.S., 2011, Wind resource assessment and performance evaluation of wind turbines for the test-bed of offshore wind farm, 2(1), J. Wind Energy, 15-20.
Rienecker, M. M., Suarez, M. J., Gelaro, R., Todling, R., Bacmeister, J., Liu, E., Bosilovich, M. G., Schubert, S. D., Takacs, L., Kim, G. K., Bloom, S., Chen, J., Collins, D., Conaty, A., A. da Silva, Gu, W., Joiner, J., Koster, R. D., Lucchesi R., Molod, A., Owens, T., Pawson, S., Pegion, P., Redder, C. R., Reichle, R., Robertson, F. R., Ruddick, A. G., Sienkiewicz, M., Woollen, J., 2011, MERRA - NASA's Modern-Era Retrospective Analysis for Research and Applications, J. Climate, 24, 3624-3648.
Ryu, M. S., Kim, J. Y., Kang, K. S., Lee, J. S., 2011, Case study on the installation of meteorological mast for the test bed, J. Wind Energy, 2(2), 10-16.
Salmon, J. R., Walmsley, J. L., 1999, A two-site correlation model for wind speed, direction and energy estimates, J. Wind Engineering & Industrial Aerodynamics, 79, 233-268.
Wan, Y. H., 2012, Long-term wind power variability, Technical Report NREL/TP-5500-53637, U.S. NREL.
WindSim AS, 2012, Gettting started WindSim 5, WindSim, 84p.