• 검색 결과가 없습니다.

Field Investigation of Debris Flow Hazard Area on the Roadside and Evaluating Efficiency of Debris barrier

N/A
N/A
Protected

Academic year: 2021

Share "Field Investigation of Debris Flow Hazard Area on the Roadside and Evaluating Efficiency of Debris barrier"

Copied!
9
0
0

로드 중.... (전체 텍스트 보기)

전체 글

(1)

439

http://dx.doi.org/10.9720/kseg.2015.4.439

Field Investigation of Debris Flow Hazard Area on the Roadside and Evaluating Efficiency of Debris barrier

Jong Hyun Lee

1

, Jung Yub Lee

2

, Sang Won Yoon

1

, Young Suk Oak

1

, Jae Jeong Kim

1

*, and Seung Hyun Kim

1

1

Korea Institute of Civil Engineering and Building Technology

2

Korea Dyeing & Finishing Technology Institute

Received 4 November 2015; received in revised form 16 December 2015; accepted 21 December 2015

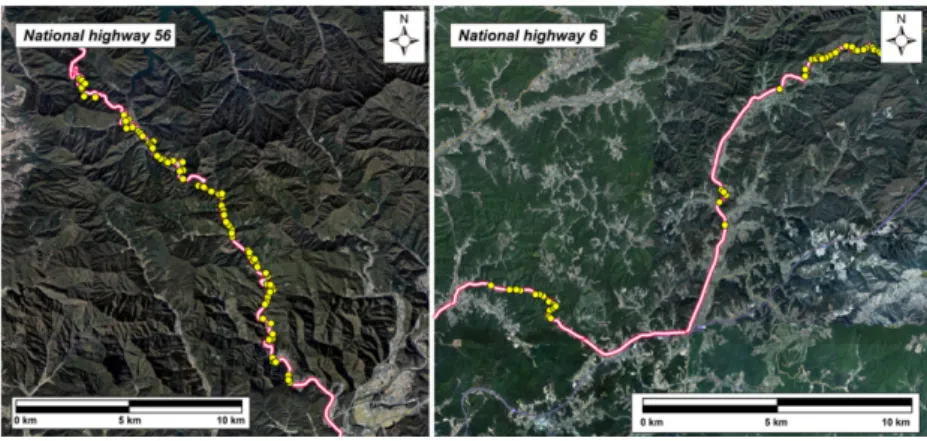
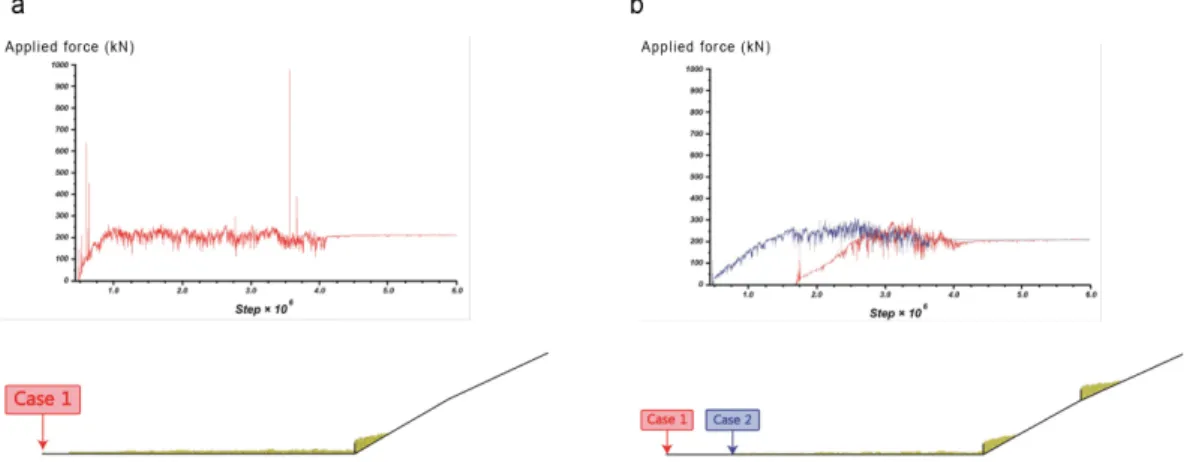
In this study, specific sections vulnerable to debris flow damage were selected, and a complete enumeration sur- vey was performed for the sections with debris flow hazards. Based on this, the characteristics of the sections with debris flow hazards and the current status of actions against debris flow were examined, and an efficient installa- tion plan for a debris flow damage prevention method that is required in the future was suggested. The results indi- cated that in the Route 56 section where the residential density is relatively higher between the two model survey sections, facilities for debris flow damage reduction were insufficient compared to those in the Route 6 section which is a mountain area. It is thought that several sites require urgent preparation of a facility for debris flow dam- age reduction. In addition, a numerical analysis showed that for debris barriers installed as a debris flow damage prevention method, distributed installation of a number of small-scale barriers facilities within a valley part was more effective than single installation of a large-scale debris barrier at the lower part of a valley.

Key words: debris flow, debris avalanche, field investigation, discrete element method, debris flow reducing facility

Introduction

More than 70% of the territory consists of mountain area. Thus, formation of slopes depending on road con- struction was inevitable, and there were many unstable slopes along the roads that had been constructed during the rapid economic growth in the past. Accordingly, in case of concentrated rainfall in the summer season where more than about 60% of the annual precipitation occurs, small and large rock falls and landslides have continu- ously occurred. However, for artificial slopes along national highways, nationwide surveys and proactive mea- sures have been prepared at a national level for the last 17

years, and thus, casualties and property damage from the collapse of artificial slopes have significantly decreased compared to the past (KICT, 2015).

In case of the debris flow, has not drawn much atten- tion compared to the interest in artificial slopes. However, with the recent occurrence of a lot of casualties and prop- erty damage due to frequent large-scale debris flow near concentrated residential areas, social interest in debris flow has increased and preparation of countermeasures has been required.

Debris flow is defined by many previous researchers. It has been defiend as a rapid movement of saturated soil, rocks and other debris down a steep mountain channel

*Corresponding author: [email protected]

ⓒ 2015, The Korean Society of Engineering Geology

This is an Open Access article distributed under the terms of the Creative Commons Attribution Non-Commercial License (http://creativecommons. org/

licenses/by-nc/3.0) which permits unrestricted non-commercial use, distribution, and reproduction in any medium, provided the original work is prop- erly cited.

(2)

(Swanston and Swanson, 1976). And it is also defined as focusing to the rheological and geotechnical issues. Debris flow is flow of sediment and water mixture in a manner as if it was a flow of continuous fluid driven by gravity. It attains large mobility from the enlarged void space satu- rated with water and slurry (Takahashi, 1981).

This study aimed to prevent potential debris flow disas- ters by performing a complete enumeration survey of sec- tions vulnerable to debris flow damage and by establi- shing proactive measures, rather than simply establishing post-damage surveys and measures for debris flow dam- age areas. As the first step, specific model sections were selected, and the current status of actions against debris flow, the survey method, and a plan for a debris flow damage prevention method were examined.

Slope collapses occurring on freeways and national highways in Korea are mostly affected by typhoons and concentrated rainfall in the summer season. During 2005- 2012, damage from debris flow occurred at 58 sites on freeways and 40 sites on national highways, and they occurred mostly in Gangwon-do and Gyeongsang-do which have a lot of mountain areas. This is not irrelevant to the east high west low type topography in Korea, and is closely related to the moving paths of typhoons occurred in the corresponding year. Despite the low occurrence fre- quency, the resulting damage is large.

It is thought that house areas along the mountain roads in Gangwon-do and Gyeongsang-do need to be inten- sively investigated for the efficient management of debris flow.

The selected survey section was about 50 km section where debris flow damage is expected along the roads in mountain areas: the Bongpyeong-Hoengseong section on Route 6 in Gangwon-do and the Chuncheon-Guseongpo section on Route 56 in Gangwon-do.

For objective data collection from various investiga- tors, a debris flow examination checklist was made, and the items of the checklist included valley part location information, topographic and geometric information, hydraulic, geologic, and ground information, and facility information.

Through the model survey, 50 sites were surveyed in the Bongpyeong-Hoengseong section on Route 6. Among

them, a facility for debris flow damage reduction was not installed at 19 sites. Also, 86 sites were surveyed in the Chuncheon-Guseongpo section on Route 56. Among them, a facility for debris flow damage reduction was not installed at 70 sites, and there were a number of sites where an urgent measure is required in preparation for debris flow.

In this study, for sites where debris flow is expected, a numerical analysis of the effect of a damage reduction facility (e.g., check dam) was performed using PFC2D (Particle Flow Code 2D, ITASCA), which is a discrete element method program. In the analysis, a case in which one check dam is installed at the bottom of a valley (Case 1) and a case in which an additional check dam is installed at a height of 15 m (Case 2) were examined based on the topographic data obtained through an actual field survey.

The results of the numerical analysis showed that for the design of a check dam considering the force applied by debris flow and the amount of overflow, installation of a number of small-scale check dam facilities within a val- ley part was more efficient for the reduction of debris flow damage than single installation of a large-scale check dam at the lower part of a valley.

Topographic and geologic characteristics of the debris flow model section

The research area was the valleys distributed along about 50 km section on Route 6 and Route 56 in Chun- cheon and Hoengseong, Gangwon-do.

The lithofacies distributed along Route 6 are biotite granite and biotite granodiorite (Won et al., 1989; Koh et al., 2011), and they show a gradual contact relation.

Except for road slopes distributed along the road, granite is rarely exposed and observed as an outcrop. When exposed as an outcrop, it has a height of about 10 m, and is mostly observed near the valley parts in a massive form.

The granite exposed on road slops shows a severely

weathered condition, and sheeting joints are developed at

narrow intervals. Thus, the granite has a laminated slide

form along the ground surface, and it has been weathered

into granite soil with a maximum depth of 1 m. Based on

(3)

this, it is thought that the weathering and alteration of granite would be more severe in the valley parts where surface water is more concentrated compared to ridges, and that the depth of granite soil would be more than 1 m.

The valleys distributed along Route 6 are generally devel- oped in two directions: north-northeast-south-southwest and west-northwest-east-southeast or east-west.

The lithofacies distributed along Route 56 is gneiss complex that consists of banded biotite gneiss, garnet gneiss, and granitic gneiss (Park et al., 1974; Son et al., 1975), and they generally have foliations with an interval of about 5 cm. The gneiss complex is exposed as an out- crop at the bottom of most valley parts. Due to the inter- section of a joint system and foliation, continuous rock falls are in progress, and most rock fragments have a pla- nar shape because foliations with a smooth cross section are developed at narrow intervals. Rock fragments have an average maximum diameter of about 30 cm, and a maximum of more than 1 m is also observed.

The lithofacies distributed along the two national high- ways are different and their characteristics are different, and thus, the content ratios of sediment and rock frag- ments and the shapes of rock fragments distributed in the valley parts are also different. In the case of Route 6 where granite is distributed, granite soil is mostly distrib- uted with a depth of about 1 m at the bottom of the valley parts due to severe weathering, and various sizes of rock fragments are scattered. On the other hand, in the case of Route 56 where gneiss with dense foliation is distributed, it is mostly exposed as an outcrop along the bottom of the

valley parts, and rock fragments with a thin planar shape are mainly distributed. Also, the content of sediment is relatively lower than that for the valley parts of Route 6.

Survey and characteristics of the debris flow model section

A survey was performed by selecting a total of 50 km section where debris flow damage is expected along the roads in mountain areas (the Bongpyeong-Hoengseong section on Route 6 in Gangwon-do and the Chuncheon- Guseongpo section on Route 56 in Gangwon-do) as the model section, and data on a total of 136 valley parts within the section were collected as shown in Fig. 1.

For objective data collection from various investiga- tors, a debris flow examination checklist was made, and the items of the checklist included valley part location information, topographic and geometric information, hydraulic, geologic, and ground information, and facility information.

The check list for inspection of debris flow harzard area is shown in Fig. 2. The check list contains the valley part location information, administrative district, distance mark (a road sign installed every 1 km for road management), GPS coordinates, and nearby artificial slope management code (currently, a management code is assigned to every artificial slope along national highways in Korea). For the topographic and geometric information, the length and dip of a valley part and the height and width of a valley entrance part were recorded. For the hydraulic, geologic,

Fig. 1. The satelite image of the study area and studied valley distributed along Route 6 and 56.

(4)

and ground information, the collapse history of debris flow, water system, bedrock condition, floating rock con- dition, soil layer distribution, and tree condition were recorded. For the facility information, drainage facility condition, damage reduction facility condition, and nearby road and house distribution were recorded.

In the case of the granite exposed as an outcrop near the valleys on Route 6, rock falls are in progress due to the intersection of systematic joint systems, and boulders with a long axis of a maximum of more than 2 m have been introduced to the valley parts. The average dip of the val- leys was 31

o

; and among them, the dip range of the val- leys with a debris flow occurrence history was diverse ranging from 20

o

to 44

o

.

The foliations of the gneiss observed along Route 56 mostly have a dip direction of 245

o

~275

o

(250

o

on aver- age) and a dip angle of 20

o

~40

o

, and the valley parts dis- tributed along Route 56 are also developed mostly in the northeast-southwest direction and have an average dip of 32

o

. The dip direction and dip angle of the valleys are

almost parallel to the direction of the foliations, and it is thought that the valley parts around Route 56 were sub- stantially affected by the foliation direction of the gneiss.

Through the model survey, 50 sites were surveyed in

the Bongpyeong-Hoengseong section on Route 6. Among

them, a facility for debris flow damage reduction was not

installed at 19 sites. Also, 86 sites were surveyed in the

Chuncheon-Guseongpo section on Route 56. Among

them, a facility for debris flow damage reduction was not

installed at 70 sites, and there were a number of sites

where an urgent measure is required in preparation for

debris flow. The population and the households number of

Chuncheon-Guseongpo section on Route 56 shows about

3 times more than the one of Bongpyeong-Hoengseong

section on Route 6 as shown in Table 1 (Gangwon Prov-

ince, 2013). In addition, the volume of traffic per day of

Route 56 is 50 percent higher than that of Route 6. Con-

sidering the portion of the applied facility reducing debris

flow damage on the debris flow hazard area and the

present condition of surveyed district, the people and road

Fig. 2. Debris flow inspection checklist.

(5)

Table 1. Present condition of the surveyed district.

Route 6 Route 56

Number of model survey 50 86

Number of debris barrier applied to the site 31 16

Portion of the facility applied 62.0% 18.6%

Number of artificial facility near the model valley 3 46

Population 5,612 18,442

Number of households 2,573 7,250

Volume of traffic (EA/day) 2,253 3,325

Fig. 3. Photographs of valleys (debris flow along Route 6).

Fig. 4. Photographs of valleys (debris flow along Route 56).

(6)

users in the Route 56 are possible to be exposed to the riskiness of debris flow damage. Also, the valleys which are expected debris flow damage on Route 6 are concen- trated on the mountain area, so the artificial facilities (like- wise house, farmland and building) located near valley are counted only 3 cases among 50 valleys. It is important reason for investment of the applying the debris flow reducing facility to the valley on Route 56 considering the artificial things of Route 56 are 46 cases among 86 val- leys. Therefore, it is reasonable that additional debris flow reducing facilities would be applied to the valley on the Route 56 within the limited budget.

Efficiency evaluation of a facility for debris flow damage reduction based on

numerical analysis

In the case of the site for applying numerical analysis, the height of the collapse starting part was about 50 m, and the debris avalanche occurrence distance was 100 m.

The gradient of the valley part was broadly divided into three types. From the collapse occurrence starting part, the gradient changed from about 20

o

to 25

o

to 30

o

, and the gradient became steeper as it approached the bottom of the valley. In this valley part, debris flow occurred in the past due to the concentrated rainfall in the summer of 2013; and as a measure for this, five small-scale check dams have been installed between the bottom and the lower middle part of the valley. Due to the past collapse, rocks and sediment are interbedded in the valley part; and the average diameter of residual rocks after the debris flow occurrence is 0.1 m and the maximum value is 0.5 m.

In this numerical analysis, for an actual site, a debris avalanche was simulated using PFC2D (Particle Flow Code 2D, ITASCA), which is a discrete element method program; and a numerical analysis of the effect of a reduc- tion facility at the lower part (e.g., debris barrier) was per- formed. The debris avalanche is one type of debris flow which is considered little portion of the rheological behav- ior, so there are some differences between real debris flow phenomenon and numerical analysis conducted in this study. But it will be meaningful numerical analysis for

revealing efficiency of debris barrier by changing the installed number of walls and the location. In the prior research, the numerical analysis by using discrete element method for efficiency of debris barrier has been con- ducted by changing the physical parameters likewise bar- rier height, friction coefficient of barrier, storage area width etc. (Salciarini et al., 2010). In this study, the one site where small scale debris flow occurred in 2013 is chosen among the actual sites that were conducted detailed survey for numerical analysis. The numerical analysis in this study is conducted based on the data obtained during the actual detailed survey, it was assumed that the collapse started from a spot at a height of 50 m in the valley part; the gradient of the valley part was changed from 30 to 25 to 20, from the lower part; and the debris avalanche occurrence distance was set to 100 m, as shown in Fig. 5. The debris barrier facility at the lower part of the slope was assumed to be a concrete debris barrier with a height of 3 m is secured at the exit of the valley part was simulated. In the numerical analysis, Case 1 where only a bottom debris barrier is installed and Case 2 where a bot- tom debris barrier at the valley exit and a debris barrier (debris barrier height is 3 m) located at a height of 15 m from exit ground level are installed were examined. For both of the two cases, the rock diameter of the debris ava- lanche was identically set to 0.1-0.5 m, and the debris ava- lanche was simulated by generating 700 balls considering the expected amount of collapsed products in the initia- tion zone.

The mircoparameters adopted for numerical analysis

are presented in Table 2. In the results of the numerical

analysis, the maximum impact force applied to the debris

barrier and the force applied to the debris barrier in a

steady state after the completion of the debris avalanche

Fig. 5. Schematic of numerical analysis.

(7)

were obtained for each case. Also, the amount of over- flow that had overflowed the bottom debris barrier and the overflow range of the overflowed debris avalanche were obtained.

Figs. 6a and 6b show the applied force to debris barrier and modeling after the completion of the debris ava- lanche considering for overflow range at each case. And Table 3 summarizes the results of the numerical analysis.

When Case 1 with the installation of one debris barrier at the lower part and Case 2 with the installation of an addi-

tional debris barrier at the upper part were compared, there were differences in the maximum impact force applied to each debris barrier, the amount of overflow, and the range of the overflow.

In Case 2, the force applied to the debris barrier was 31% of that in Case 1, and it was a 98% level in a steady state after the completion of the debris avalanche. For the application of the debris barriers in Case 2, the required supply was twice that in Case 1. However, during the design of a debris barrier, the maximum impact force applied to the dam is the most important element of the required design supply. Therefore, it is thought that the difference in the supply between the two cases would not be large considering the maximum impact force applied to the debris barrier.

Also, the amount of overflow in Case 2 was about 54%

of that in Case 1. The range of the overflow in Case 2 was about 76% of that in Case 1. In the case of the disaster prevention effect based on the results of this numerical analysis, the disaster prevention effect in Case 2 was supe- rior to that in Case 1.

Table 2. Values adopted for the material parameters (Salciarini et al, 2010).

Parameter Value

Particle density, ρ kg/m

3

2,495 Particle normal/shear stiffness, κ

np

sp

1.0

Particle friction coefficient, μ

p

0.1 Bedrock normal/shear stiffness, κ

nb

/ κ

sb

1.0 Bedrock friction friction coefficient, μ

b

0.05

Barrier normal/shear stiffness, κ

nbr

/ κ

sbr

1.0 Barrier friction friction coefficient, μ

br

0.3

Fig. 6. (a): Applied force to debris barrier and overflow range in Case 1, (b): Applied force to debris barrier and overflow range in Case 2.

Table 3. Result of numerical analysis using PFC 2D.

Case 1 Case 2 Ratio of cases 1 & 2

(Case1/Case2) Bottom barrier Bottom barrier Upper barrier

Maximum impact force (kN) 980 310 300 31%

Amount of overflow 67% 36% 54%

Range of overflow 85 m 65 m 76%

(8)

In conclusion, the advantage of the installation of an additional debris barrier at the upper part is an outstand- ing disaster prevention effect without a large difference in the required supply.

Conclusion

In this study, the following conclusions could be drawn.

1. Through the model survey conducted in the roadside valleys on Route 56 and 6, people and road users on the Route 56 can be dangerous for the debris flow damage by considering the portion of the applied facility and the present condition of surveyed dis- trict.

2. Considering the Conclusion 1, investment for Route 56 can be prior to the Route 6 wihtin the limited budget.

3. Using PFC 2D, which is a discrete element method program, a case in which one debris barrier is installed at the lower part of a valley (Case 1) and a case in which an additional debris barrier is installed at a height of 15 m (Case 2) were compared. The results indicated that the maximum impact force applied to the debris barrier in Case 2 was 31% of that in Case 1, and the amount of overflow in Case 2 was about 54% of that in Case 1.

4. When the economic feasibilities were compared through the required supply based on the numerical analysis results, the required supply for the applica- tion of the debris barriers in Case 2 was twice that in Case 1. However, during the design of a debris bar- rier, the force applied to the dam is the most impor- tant element of the required design supply. Therefore, it is thought that the difference in the supply

between the two cases would not be large consider- ing the maximum force applied to the debris bar- rier. When the disaster prevention effects were compared based on the results of the analysis, the disaster prevention effect in Case 2 was superior to that in Case 1.

References

Gangwon Province, 2013, Gangwon Statistical Informa- tion, Retrieved from http://stat.gwd.go.kr.

Itasca, 1995, PFC 2D User Manual, Itasca Consulting Group, Minneapolis.

Koh, H. J., Kim, S. W., and Lee, S. R., 2011, Geological report of the Anheungri sheet (scale: 1:50,000), Korea Institute of Geoscience and Mineral Resources, 54p (in Korean with English abstract).

Korea Institute of Civil engineering and Building Tech- nology (KICT), 2015, Operation of road cut slope management system in 2014, Research report, Min- istry of Land, Infrastructure and Transport, 297-311 (in Korean).

Park, H. I., Jang, K. H., Ji, J. M., and Ko, I. S., 1974, Geo- logical map of Korea: Nae Peong(1:50,000), Korea Institute of Geoscience and Mineral Resources, 13p (in Korean with English abstract).

Salciarini, D., Tamagnini, C., and Conversini, P., 2010, Discrete Element Modelling of Debris Avalanches- Resisting Earthfill Barriers, Physics and Chemistry of the Earth, 35, 172-181.

Son, C. M., Kim, Y. K., Kim, S. W., and Kim, H. S., 1975, Geological map of Korea: Hong Cheon(1:50,000), Korea Institute of Geoscience and Mineral Resources, 23p (in Korean with English abstract).

Swanston, D. N. and Swanson, E. J., 1976, Timber har- vesting, masserosion, and steepland forest geomor- phology in the Pacific Northwest, Geomorphology and engineering, 199-221.

Takahashi, T., 1981, Debris flow, Annual Review of Fluid Mechanics, 13, 57-77.

Won, C. K., Chi, J. M., Jeong, J. G., Lee, M. W., and Kim,

W. S., 1989, Geological map of Korea: Gap Chon

(1:50,000), Korea Institute of Geoscience and Mineral

Resources, 19p (in Korean with English abstract).

(9)

Jong Hyun Lee

Korea Institute of Civil Engineering and Building Technology, Goyang, Republic of Korea

Tel: 82-31-910-0227 E-mail: [email protected]

Jung Yub Lee

Korea Dyeing & Finishing Technology Institute Tel: 82-53-350-3743

E-mail: [email protected]

Sang Won Yoon

Korea Institute of Civil Engineering and Building Technology, Goyang, Republic of Korea

Tel: 82-31-910-0501 E-mail: [email protected]

Young Suk Oak

Korea Institute of Civil Engineering and Building Technology, Goyang, Republic of Korea

Tel: 82-31-910-0101 E-mail: [email protected]

Jae Jeong Kim

Korea Institute of Civil Engineering and Building Technology, Goyang, Republic of Korea

Tel: 82-31-910-0889 E-mail: [email protected]

Seung Hyun Kim

Korea Institute of Civil Engineering and Building Technology, Goyang, Republic of Korea

Tel: 82-31-910-0524

E-mail: [email protected]

수치

Fig. 1. The satelite image of the study area and studied valley distributed along Route 6 and 56.
Fig. 4. Photographs of valleys (debris flow along Route 56).
Fig. 6. (a): Applied force to debris barrier and overflow range in Case 1, (b): Applied force to debris barrier and overflow range in Case 2.

참조

관련 문서