−234−
Optical Excitation and Emission Spectra of YNbO
4: Eu
3+Eun Young Lee and Young Jin Kim*
Department of Materials Science and Engineering, Kyonggi University, Suwon 443-760, Korea (Received July 10, 2009 : Accepted August 25, 2009)
Abstract: In the excitation spectra of YNbO4: Eu3+, the charge transfer (CT) band around 270 nm due to [NbO4]3−-Eu3+ interaction and sharp excitation peaks by f-f transition of Eu3+ strongly appeared simultaneously. CT band depended on the structural properties of powders, showing the red-shift with increasing the crystallinity, while the f-f transition peaks were independent of the crystallinity. For YNb1−xTaxO4: Eu3+ (x = 0.05−0.2), [TaO4]3− configuration was locally constructed, leading to the blue-shift in CT band and the decrease in the red emission intensity with increasing the Ta content.
Keywords :Photoluminescence, YNbO4, Charge transfer, Europium
1. Introduction
YNbO4 powders have been known not only as blue emitting materials around 405 nm under 260 nm excitation, but also as x-ray phosphors of which spectra exhibit high energy emissions around 256 nm.1) Niobium containing-YTaO4 can efficiently convert x-ray to a visible light of 410 nm, resulting in higher luminescent properties than CaWO4.2,3)
The substitution of rare-earth (RE) ions for yttrium atoms enables YNbO4 to emit visible lights under the excitation of the charge transfer (CT) band that gen- erated from the energy transfer between [NbO4]3−
and RE ions. In case of YNbO4: Eu3+, [NbO4]3− can be self-activated by UV, and then the absorbed energy is efficiently transferred to Eu3+ ions by a non-radiative CT mechanism, showing CT band around 270 nm. This CT band excitation causes the red-light emissions corresponding to 5D0→7FJ (J = 0, 1, 2, 3…) transi- tions of Eu3+. With increasing Eu3+ concentration, the red emission intensity by CT band excitation increases, while simultaneously the blue-emission due to self-activated [NbO4]3− excitation is quenched.1,4) In addition to CT band, sharp peaks of f-f transitions of Eu3+ around near UV range can be observed.
YNbO4 has polymorphism of the high temperature
T-phase (T-scheelite, I41/a) and the low temperature monoclinically distorted M-phase (M-fergusonite, C2).
The transition temperature between two phases is 500-800oC depending on RE ions.2,5-8) YNbO4 phos- phors have been synthesized by a solid-state reac- tion,9-13) a firing of citrate complexes,14,15) and a pyrolysis of metal-alkoxide.16)
In spite of some previous works on the luminescent properties of YNbO4: Eu3+, the correlations between the micro-structural changes and the luminescent properties (CT and f-f transition of Eu3+) have not been reported in detail yet. In this work, we prepared YNbO4:Eu3+ powders by a flux method, and then inves- tigated the optical excitation and emission properties of Eu3+ in YNbO4.
2. Experiment
Y2O3, Nb2O5, Ta2O5, and Eu2O3 powders were used as starting materials. H3BO3, LiCl, and NH4Cl were added as a flux, respectively to facilitate the solid-state reactions and enhance the luminescent properties by accelerating the kinetics of the formation of the desired compounds. According to our preliminary expe- riment, LiCl among the flux was superior to the others in a single phase formation and luminescence. After ball-milling the mixtures for 24 hours, they were fired at 1000-1400oC flowing 30 sccm N2 gas for 12 hours in an electric tube furnace. The temperature was
*E-mail: [email protected]
raised by 5oC/min. The crystalline phases of prepared powders were determined by XRD (X-ray diffracto- meter, SIEMENS D5005) using CuKá radiation (λ= 1.5406 Å). PL (Photoluminescence) properties were measured at room temperature by PL (PSI Darsa 5000) system using a xenon lamp as an excitation source.
3. Results and Discussion
XRD patterns of 0.95Y2O3-1.0Nb2O5-0.05Eu2O3-LiCl (7 wt%) mixture prepared as a function of the firing temperature are shown in Fig. 1. M-YNbO4 formation can be completed by the reaction schemes (1) and (2).
(1) (2) Since LiNbO3 phase was not achieved at all tem- perature ranges as shown in Fig. 1, it could be thought that the lowest temperature of 1000oC was already high enough to follow the reaction scheme (2) process. At 1000oC, YNbO4 and the secondary phase of Y3NbO7 weakly appeared. With increasing the tem- perature, XRD peaks of YNbO4 gradually increased,
while those of Y3NbO7 weakened, resulting in a single phase YNbO4 above 1300oC.
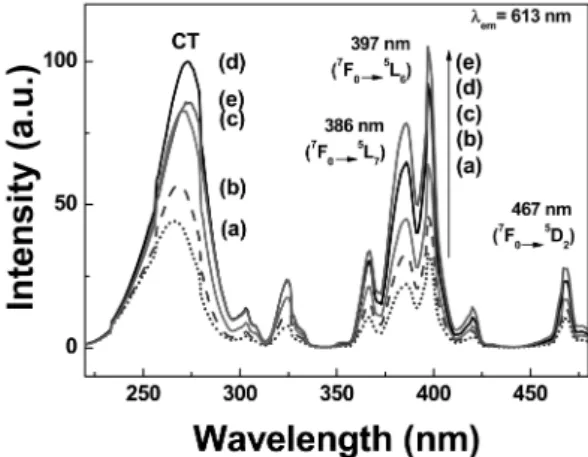
The related excitation spectra are shown in Fig. 2.
The broad band around 270 nm corresponded to the charge transfer (CT) between [NbO4]3− and Eu3+ emitting level, while the other sharp bands were assigned to f-f transitions in Eu3+ 4f6 configuration, among which
7F0→5L6 at 397 nm was the most significant and
7F0→5L7 at 385 nm was also comparatively strong.
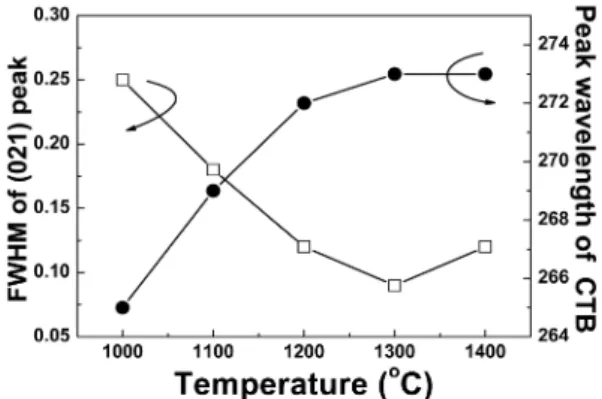
With increasing the temperature, CT band intensity gradually increased up to 1300oC, and then slightly dropped at 1400oC, furthermore the peak shifted to the longer wavelength (the red-shift), saturating at 1400oC. On the other hand 7F0→5L6 transition con- tinuously increased up to 1400oC in intensity without a shift of the peak position. CT band closely depends on the micro-structural changes of a host material, because its properties are mainly ascribed to the efficiency of the energy transfer from [NbO4]3− to Eu3+ ions. So a correlation between CT band and the crystallinity of YNbO4 was investigated. Full width of half maximum (FWHM) values of (021) peak in Fig. 1 and the peak wavelength of CT band are shown in Fig. 3. With increasing the temperature, FWHM values continu- ously decreased and then a little increased at 1400oC.
This meant that the crystallinity continuously devel- oped up to 1300oC, but slightly deteriorated at 1400oC due to the excess high temperature. The higher crys- tallinity caused the stronger interaction of [NbO4]3−-Eu3+, namely the easier electron transition from [NbO4]3− to Eu3+ energy level, leading to the red-shift and the increase
Fig. 1. XRD patterns of 0.95Y2O3-1.0Nb2O5-0.05Eu2O3-LiCl (7wt%) mixture prepared as a function of the firing temper- ature. (a) 1000oC, (b) 1100oC, (c) 1200oC, (d) 1300oC, and (e) 1400oC.
Fig. 2. PL excitation spectra of YNbO4: 0.1Eu3+ fired at various temperatures. (a) 1000oC, (b) 1100oC, (c) 1200oC, (d) 1300oC, and (e) 1400oC.
of the peak intensity. However, at 1400oC the red-shift was suppressed and the intensity decreased due to the high firing temperature where FWHM a little increased.
As shown in Fig. 2, the peak of 7F0→5L6 transition at 397 nm continuously increased up to 1400oC without the peak shift, indicating that it was independent of the crystal structure unlike CT band.
PL emission spectra excited by CT band are shown in Fig. 4. Typical Eu3+ red emissions assigned to
5D0→7FJ (J = 1, 2….) transition of Eu3+ ions were observed, and 5D0→7F2 at 613 nm was dominant. The inset in Fig. 4 exhibits a variation of PL intensity as a function of the firing temperature under CT band and 397 nm excitation, respectively. The increase of the temperature caused the enhancement of the red emis- sion, and the emission behaviors at 1400oC well coin- cided with the variations of the excitation spectra in Fig. 2. Namely, at 1400oC the emission intensity due to CT band saturated, while that by 397 nm excitation continuously increased.
To investigate the effects of the cation substitution in the tetrahedral niobate, PL excitation spectra of YNb1−xTaxO4: Eu3+ (x = 0-0.2) were measured and resulting variations are shown in Fig. 5. With increasing the Ta content from 0.05 to 0.2, the excitation intensity of CT bands gradually decreased and the peak wave- length shifted to shorter wavelengths (the blue-shift).
The crystal structure of YTaO4 is very similar to that of YNbO4, but it has, besides T- and M-type, another M’-type,3,17) which can be synthesized at the low tem perature below 1400oC and is used as a luminescent material. Both Nb and Ta atoms are located in a dis- torted octahedral coordination in M-YNbO4 and M’- YTaO4, respectively, of which CT bands due to tantalate
[TaO4]3−-Eu3+ and niobate [NbO4]3−-Eu3+ are shown around 254 nm18) and 270 nm, respectively. M’-YTaO4
phase did not appear in XRD, so the substituted Ta atoms certainly formed the [TaO4]3− coordination partially in M-YNbO4, but the secondary M’-YTaO4 phase was not created. X. Xiao et al. reported that [TaO4]3− could not exhibit a self-emission in europium doped YNbyTa1−yO4 (y = 0.1-0.9) system, because the efficiency of the transfer from [TaO4]3− to [NbO4]3−
was high and the emission of [NbO4]3− overlapped that of [TaO4]3−.19) G. Blass et al. demonstrated that niobium-containing tantalates yielded mainly niobate emission due to efficient energy transfer.20) However their results did not show the blue-shift in CT band unlike ours. Conclusively, it could be speculated that the local [TaO4]3− coordination in YNbO4 did not contributed to CT directly, but made the interaction of [NbO4]3−
Fig. 3. FWHM of (021) peak and peak wavelengths of CT
band as a function of the firing temperature. Fig. 4. PL emission spectra of YNbO4:0.1Eu3+ fired at various temperatures. (a) 1000oC, (b) 1100oC, (c) 1200oC, (d) 1300oC, and (e) 1400oC.
Fig. 5. The variation of the excitation intensity and the peak wavelength of CT band of YNb1-xTaxO4: Eu3+.
-Eu3+ weaker by distorting the crystal field, leading to the blue-shift and the decrease of CT band intensity.
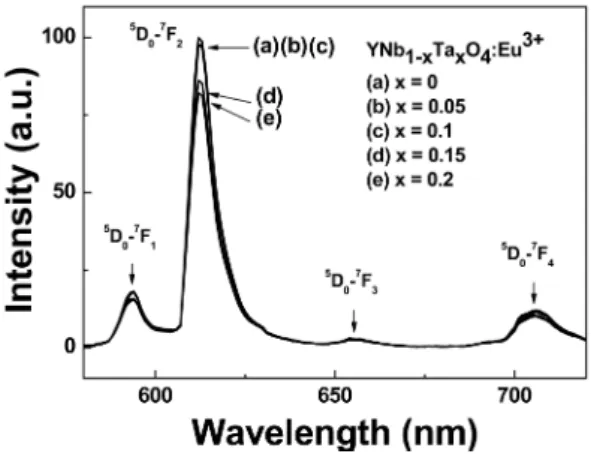
Corresponding PL emission spectra are shown in Fig. 6. At all x values the strongest peak appeared at 613 nm, corresponding to 5D0→7F2 transition of Eu3+, while the weak peaks at 593, 655, and 705 nm assigned to 5D0→7F1, 5D0→7F3,and5D0→7F4
were also observed, respectively. It is known that in low symmetric crystal lattices, the strongest emission peak is assigned to 5D0→7F2 transition, so our emission spectra revealed that all Eu3+ ions occu- pied the asymmetric C2 sites of Y3+ in YNb1−xTaxO4. At x = 0-0.1, the emission intensities were almost same, and then significantly dropped at 0.15-0.2. X. Xiao
et al. concluded in their report that, in YNbyTa1−yO4: Eu3+ (y = 0.1-0.9), the shift of 5D0→7F1 emission peak at 593 nm and the decrease of the symmetry with increasing the niobium content were attributed to the phase change, which meant the coexistence of M-YNbO4 and M’-YTaO4 phases.19) In contrast to their work, the shift of 5D0→7F1 emission peak was not observed in our work, and also M’-YTaO4 phase did not appeared in XRD. This discrepancy might be caused by the different experimental range of Nb/Ta ratio. A cation ratio of Ta/(Nb+Ta) in our work was so small (≤0.2) that M’-YTaO4 phase could not be created, while that in Xiao’s work was large (≤0.9), leading to the appearance of M’-YTaO4 phase. From the excitation and emission spectra it could be summarized that [TaO4]3− configuration was locally constructed in YNb1−xTaxO4: Eu3+ system, which distorted the crystal field surrounding Eu3+ and weakened [NbO4]3−-Eu3+
interaction, resulting in the blue-shift in CT band and the
decrease of red emissions with increasing the Ta content.
4. Conclusion
YNbO4: Eu3+ powders were synthesized by a flux method using LiCl. The excitation spectra exhibited not only the broad peak around 270 nm due to CT band between [NbO4]3− and Eu3+ emitting level, but also the sharp peaks by f-f transitions of Eu3+ ions among which
7F0→5L6 at 397 nm appeared as the strongest one.
With increasing the firing temperature, CT band exhibited the red-shift due to the improved crystallinity, while the peaks of f-f transition including 7F0→5L6 did not shift regardless of the crystallinity. In YNb1−xTaxO4: Eu3+ system, locally constructed [TaO4]3− configuration led to the blue-shift in CT band and the decrease of red emissions with increasing the Ta content.
Acknowledgment
This work was supported by the Korea Research Foundation Grant funded by the Korean Government (KRF-2008-313-D00435).
References
1. A. H. Buth and G. Blasse, ‘Luminescence and energy transfer in yttrium niobate (YNbO4)’ Phys. Stat. Sol. (a),
64, 669 (1981).
2. L. H. Brixner and H. Y. Chen, ‘On the Structural and Luminescent Properties of the M prime LnTaO4 Rare Earth Tantalates’ J. Electrochem. Soc., 130, 12 (1983).
3. L. H. Brixner, ‘New X-ray phosphors’ Mater. Chem.
Phys., 16, 253 (1987).
4. S. H. Shin, D. Y. Jeon, K. S. Seo, and J. M. Kim, ‘Cathodo- luminescence Change of YNbO4: Bi Phosphor after Acid Treatment’ Jpn. J. Appl. Phys. Part 1, 40, 4060 (2001).
5. J. M. Jehng and I. E. Wachs, ‘Structural chemistry and Raman spectra of niobium oxides’ Chem. Mater., 3, 100 (1991).
6. V. S. Stubican, ‘High-Temperature Transitions in Rare-Earth Niobates and TantaIates’ J. Am. Ceram. Soc., 47, 55 (1964).
7. M. J. J. Lammers and G. Blasse, ‘Energy transfer phenomena in Tb3+-activated gadolinium tantalate (GdTaO4)’ Mater. Res. Bull., 19, 759 (1984).
8. O. Yamaguchi, K. Matsui, T. Kawabe, and K. Shimizu,
‘Crystallization and Transformation of Distorted Tetragonal YNbO4’ J. Am. Ceram. Soc., 68(10), 275 (1985).
9. G. Blasse and L. H. Brixner, ‘Ultraviolet emission from ABO4-type niobates, tantalates and tungstates’ Chem. Phys.
Lett., 173, 409 (1990).
10. A. K. Pradhan and R. N. P. Choudhary, ‘X-ray, SEM and thermal analysis of RNbO4-type fergusonites’ J. Mater.
Fig. 6. The emission spectra of of YNb1-xTaxO4: Eu3+. (a) x = 0, (b) x = 0.05, (c) x = 0.1, (d) x = 0.15, and (e) x = 0.2
Sci. Lett., 6, 1425 (1987).
11. G. J. McCarthy, ‘X-ray studies of RE NbO4 compounds’
Acta Cryst. B, 27, 2285 (1971).
12. H. P. Rooksby and E. A. D. White, ‘The structures of 1:1 compounds of rare earth oxides with niobia and tantala’
Acta Cryst., 16, 888 (1963).
13. C. Quinn and R. Wusirika, ‘Twinning in YNbO4’ J. Am.
Ceram. Soc., 74, 431 (1991).
14. O. Yamaguchi, K. Matsui, T. Kawabe, and K. Shimizu,
‘Crystallization and Transformation of Distorted Tetragonal YNbO4’ J. Am. Ceram. Soc., 68, 275 (1985).
15. O. A. Serra, S. A. Cicillini, and R. R. Ishiki, ‘Rare earth phosphors: fundamental and application’ J. Alloy. Compd.,
303-304, 316 (2000).
16. L. N. Ansel’m, G. L. Bir, and I. E. Myl’nikova, ‘ESR of
Gd3+ in YNbO4’ Soviet Phys. olid State, 12, 1500 (1971).
17. G. M. Wolten, ‘The structure of the M'-phase of YTaO4, a third Fergusonite polymorph’ Acta Crystallogr., 23, 939 (1967).
18. M. H. Hwang and Y. J. Kim, ‘Luminescent properties of Eu3+-doped YTaO4 powders’ Ceramics International, 34, 1117 (2008).
19. X. Xiao and B. Yan, ‘Photoluminescent properties of Eu3+(Dy3+)-activated YNbxTa1-xO4 and REVTa2O9 (RE = Y, La, Gd) phosphors from the hybrid precursors’ Appl.
Phys. A, 88, 333 (2007).
20. G. Blass and A. Bril, ‘Luminescence phenomena in compounds with fergusonite structure’ J. Lumin. 3, 109 (1970).