TEMPORAL VARIATIONS OF NO2 DISTRIBUTION OVER AN URBAN AREA MEASURED BY IMAGING DIFFERENTIAL
OPTICAL ABSORPTION SPECTROSCOPY
Hanlim Lee
Advanced Environmental Monitoring Research Center (ADEMRC) Gwangju Institute of Science and Technology (GIST) Department of Environmental Science & Engineering 1 Oryong-dong, Buk-gu, Gwangju 500-712, Republic of Korea Tel: +82-62-970-3407 Fax: +82-62-970-3404 E-mail: [email protected]
ABSTRACT : During the CareBeijing campaign in September 2006, Imaging Differential Optical Absorption Spectroscopy (IDOAS) measurements were made over the city of Beijing, China using a spatial resolution of 146 pixels horizontally and 61 pixels vertically, each with a field of view of 0.133o and 0.072o in the horizontal and vertical directions, respectively. Using Fraunhofer reference spectra (FRS) for the evaluation of data for two consecutive days, the diurnal variation of NO2 distributions was determined from data measured every single hour from 08:00 until 16:00 on September 9 and 10. Both days presented a fairly clear sky with high visibility. The setup allowed detailed images of the low surface NO2 distribution over Beijing. Images with less than a 30-min temporal resolution showed variation of plume dispersal in both horizontal and vertical directions. An in-situ measurement was also conducted. Results from both instruments are interpreted by considering local emission sources and wind conditions.
KEY WORDS: Imaging DOAS; NO2; Slant column density
1. INTRODUCTION
Remote sensing techniques using scattered sunlight have been used for an understanding of both stratospheric and tropospheric trace gases, including NO2, SO2 and halogen compounds at various measurement sites. The Multi-Axis DOAS technique has been employed in recent plume studies. Motorway NO2
emission was investigated by von Friedeburg et al.
(2005). MAX-DOAS measurements were made to study BrO and SO2 (Bobrowski et al., 2003) and BrO, ClO and SO2 (Lee et al., 2005) in volcanic plumes in relation to local tropospheric ozone depletion. Other applications of MAX-DOAS measurements are detailed in HÖnninger et al. (2004). While MAX-DOAS measurement enables retrieval of the vertical distribution of trace gases, Imaging DOAS (IDOAS) measurement can be used to obtain trace gas information resolved in two dimensions.
IDOAS is one of the latest atmospheric monitoring techniques that provide information on spatially resolved trace gases. Information on two-dimensional trace gas distributions in the atmosphere can be used to further our understanding of atmospheric emissions, transport and chemical reactions. IDOAS observations have been implemented for the visualization of NO2 and SO2
plumes emitted from a power plant (Lohberger et al., 2004) and a volcano site (Bobrowski et al., 2006), where the path length between the emission source and instrument is well defined. These studies demonstrated the potential of this technique for plume studies. During the CareBeijing campaign, IDOAS measurement was carried out for the first time to study NO2 over Beijing, China, one of the largest metropolitan cities in the world
and a region in which NO2 emission sources are scattered throughout the city.
The CareBeijing campaign was held from August 10 to September 10, 2006 at two sites: one located in Beijing and the other in Yufa, an industrialized city situated about 300 Km south of Beijing. The main objective of the campaign was to conduct a quantitative assessment on air quality in Beijing. The present work is part of an effort to use a remote sensing technique to gather information on the vertical and horizontal distribution of air pollutants in the city. Spatially resolved trace gas information has not been obtained by conventional surface point monitoring devices. IDOAS was used to obtain quantitative information on the characteristics of daytime variation of two-dimensional trace gas distributions, and to identify major trace gas emission sources in Beijing.
2. METHODOLOGY 2.1 Instrument
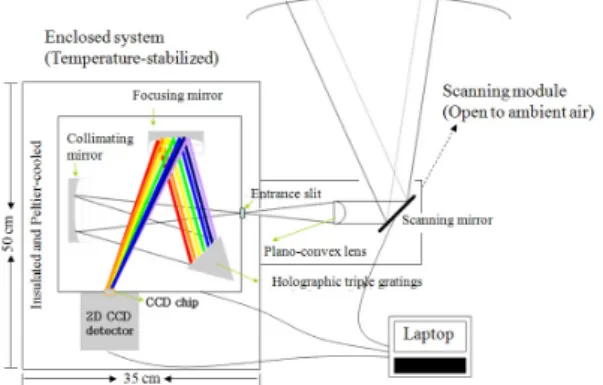
Instrument features are detailed in the sketch of Fig. 1.
The light-collecting component is composed of a moving mirror and a quartz lens (plano convex; f = 100 mm, Φ = 2.54 mm). The mirror driven by the stepper motor reflects light onto the lens, which focuses the incoming light onto the entrance slit of the spectrometer (Jobin- Yvon Triax 180, Czerny Turner type, f/# 3.9) with a holographic flat grating (1200 grooves mm-1; blazed at 330 nm). The light is dispersed by the grating and focused onto a cooled 2D CCD chip (2048 × 512 pixels).
The back-illuminated type assures high photon quantum efficiency (above 60% within the wavelength (λ) range 348 ~ 450 nm), resulting in a short CCD exposure time.
The point spread function (PSF) may degrade the spectral quality in vertical pixels by contributing to neighboring spectra. Sixty-four vertical pixels binned out of the 512 CCD pixels (reducing PSF effect) were used for the spatial distribution, while the 2048 pixels served as a spectral dispersion axis. The spectral resolution ranged between 0.4 and 0.7 nm (FWHM) depending on the wavelength, as confirmed by DOAS spectrum analysis.
The telescope received sunlight scattered in the atmosphere from elevation angles between 2.7o and 7.0o and azimuth angles ranging from 99o and 119o (see Fig.
3a). Spectra taken at an azimuth angle of 119o are regarded as representing the center of Beijing, while azimuth angles near 99o point to suburban areas. The original vertical field of view was 4.5o. However, only 4.3o out of 4.5o was used for data evaluation due to the degraded spectral quality of 3 pixels at the bottom of the CCD chip. Therefore, this study focuses on temporal variation of NO2 distributions near the surface. One- hundred and forty-six horizontal scans were sequentially implemented by a plane mirror, which scans the field of view using a stepper motor driven by computer control.
The horizontal spatial resolution was 0.133o. The exposure time was about 2 s for an individual scan on an azimuth angle. The time for a complete image ranged from 10 to 30 min during the measurement period.
Figure 1. Schematic diagram of GIST Multi-wavelength Raman lidar system
Figure 1. Instrument setup for I-DOAS measurements.
Individual colors indicate the main components of I- DOAS. We evaluated digitized spectra recorded on a two-dimensional CCD chip.
2.2 Measurement & Data Analysis
The site (39.59 N, 116.18E) was located on the rooftop of the Science building on the campus of Beijing University, which is situated in the northwestern region of Beijing. The IDOAS system was operated from August 27 until September 10, 2006. However, this study focuses on results obtained from measurements on two consecutive days, September 9 and 10, because these days presented a cloudless sky with good visibility.
The instrument’s views of the scene are shown in Fig.
3(b). The photograph in Fig. 3 shows the scenes in Beijing observed from the instrument, and was taken during measurements on September 9.
Given the employed DOAS technique (Platt, 1994) and analysis method (Vandaele et al., 2005), data analysis was performed using WinDOAS software (Van Roozendael and Fayt, 2001). The fitting interval was selected between 403 and 416 nm. Sensitivity tests with varying absorption bands were performed to select the best fitting interval with the least fit residuals. The selected region provides strong NO2 absorption features and weak Fraunhofer signatures. The Fraunhofer reference spectrum (or spectra; FRS) for the analysis was scanned at 10° west from the stacks of interest.
Noise signals caused by stray light, dark current, and offset signal were removed by subtracting the background spectrum from the respective measurement spectra. The background spectrum was recorded using the same measurement parameters as those for the actual measurements, including the number of scans and exposure time used for spectra acquisitions under the condition of no light entering the instrument entrance.
After the removal of noise, the individual measurement spectra on each vertical CCD pixel line were divided by the corresponding FRS on the same set of binned rows (spatial pixels) of the CCD to remove Fraunhofer lines from the measured spectra. Pixel-to-wavelength calibration was performed first based upon the mercury emission lines and then by optical density fitting of individual FRS to the high-resolution solar spectrum, mapping wavelength information onto the CCD pixels with high accuracy. To compensate for the Ring effect (Fish and Jones, 1995; Chance and Spurr, 1997), which represents the filling-in (reduction in the observed optical densities) of Fraunhofer lines, Ring spectra were calculated from the individual FRS using DOASIS software developed by Institute of Environmental Physics, University of Heidelberg, Germany. Given that we observed the degraded spectral resolution and the distorted wavelength of the spectrometer perpendicular to the vertical direction, all absorption cross-sections were convoluted with individual instrumental functions according to the binned rows of the CCD.
3. RESULTS
Fig. 2 shows a map of Beijing city with information on the location of the instruments. The scanning direction from the Beijing University site and the beginning and end point of the scanned area on an azimuth angle are also shown in Fig. 2. Fig. 4 shows the diurnal variation of ambient NO2 concentrations measured by the real- time NO2 point sampling device at the Beijing University site. The average NO2 concentrations during the daytime from 06:00 to 18:00 LT on September 9 and 10 were 6.7 and 28.5 ppbv, respectively. The concentration on September 10 was about a four times higher than the concentration measured on September 9. A highly
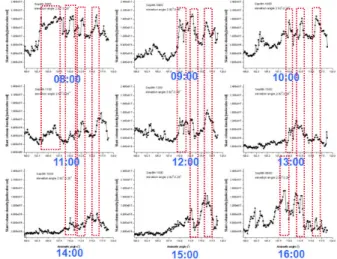
increased Gaussian-shaped NO2 peak was observed between about 09:00 to 13:00 on September 10 as shown in Fig. 4. The hourly variations of NO2 distribution in slant column density (SCD) from IDOAS measurements are visualized in Fig. 6 for September 9 and Fig. 7 for September 10. Individual images are composed of 146 horizontal pixels scanned by a stepper motor movement and 61 vertical pixels, as explained in Section 3.1. The area observed by the IDOAS instrument was split into two azimuth angle ranges in Figs. 8 and 9 in order to detail the differences in horizontal NO2 distribution.
Plots on the right side of Figs. 8 and 9 denote NO2 SCDs averaged along 61 individual rows on azimuth angles between 109.2o ~ 118.8o, while those on the left show NO2 SCDs averaged over the remaining pixels along the corresponding rows.
Figure 2. Horizontal distributions of NO2 measured by Imaging-DOAS in Beijing on September 9, 2006.
Therefore, NO2 on the right side of Figs. 8 and 9 represents the characteristics of NO2 near the center of Beijing. Because of the SZA change from the morning to late afternoon during the measurement period, the effect of the stratospheric NO2 SCD was estimated using Trace gas RAdiative Monte Carlo Y(I)mplementation (TRACY-II; Deutschmann et al., 2006), a radiative transport model (RTM). SZA varied from 34o to 66o during the measurement period. The difference in stratospheric NO2 SCD due to SZA change was estimated at 2.5×10¹⁵ molecules/cm2, which is negligible in comparison with the tropospheric NO2 SCD measured in this study.
4. SUMMARY AND CONCLUSION
The continuous recording of data proved to be useful in determining the locations of both emission sources and the transport of trace gases in the urban area.
Temporal variation of NO2 distribution was detected in all viewing directions during the measurement on
September 9, 2006. A high NO2 emission due to rush- hour traffic was observed on Saturday morning. The use of the same FRS for two consecutive days allowed the detection of distinct differences of background NO2
SCDs between the first and second day. A higher NO2
background SCD was recorded on the second day (September 10, 2006) and was in good agreement with the ground point measurement data. The high NO2
emission on this day was observed at a low surface direction with a 3.0o elevation angle at 10:00 LT, and the NO2 load increased to its maximum value of ~2.8 ×10¹⁷ molecules/cm2. The NO2 images retrieved by IDOAS measurements indicated that the plume moved from a southern to northern direction, which is in good agreement with local wind conditions observed on the same day. During the period involving a large enhancement of NO2, high NO2 emissions were first observed at azimuth angles between 109.2o ~ 118.8o (center of the city), which indicates greater fossil fuel combustion activity near the center of the city. Three continuous NO2 emission locations were detected at azimuth angles of 110o, 112.5o and 116o, which proved that IDOAS can be useful in identifying emission source locations with its simple instrumental structure.
ACKNOWLEDGEMENT
This work was supported in part by the Korean Ministry of Environment as part of The Eco-Technopia 21 Project, and by KOSEF through the Advanced Environmental Monitoring Research Center. This research was partially supported by the Brain Korea 21[BK21] program for the fellowship Hanlim Lee and Jinsang Jung.
REFERENCES
von Friedeburg C., et al., 2004. Multi-axis-DOAS measurements of NO2 during the BAB II motorway emission campaign. Atmospheric Environment 39, 977–
985.
Bobrowski N., et al., 2003. Detection of Bromine Monoxide in a Volcanic Plume, Nature 423, 273–276, doi:10.1038/nature01625.
Lee C.K., et al., 2005. High ClO and ozone depletion observed in the plume of Sakurajima volcano, Japan.
Geophysical Research Letter 32 L21809, doi:10.1029.2005GL023785.
HÖnninger G., et al., 2004. Multi axis differential optical absorption spectroscopy (MAX-DOAS). Atmospheric Chemistry and Physics 4, 231-254.
Bobrowski N., et al., 2006. I-DOAS: A new monitoring technique to study the 2D distribution of volcanic gas emissions. Journal of Volcanology and Geothermal Research 150, 329-338.
Lohberger F., et al., 2004. Ground-based imaging differential optical absorption spectroscopy of atmospheric gases. Applied Optics 43 (24), 4711-4717.
Platt U., 1994. Differential Optical Absorption Spectroscopy (DOAS) in Air Monitoring by Spectroscopic Techniques, in: Sigrist M.W. (Ed.), Chemical Analysis, vol. 127, Wiley, New York, pp. 27- 83.
Vandaele A.C., et al., 2005. An intercomparison campaign of ground-based UV-visible measurements of NO2, BrO, and OClO slant columns: Methods of analysis and results for NO2. Journal of Geophysical Research 110, D08305, doi:10.1029/2004JD005423.
Van Roozendael M., et al., 2001. WinDOAS 2.1 Software User Manual. Inst. d’Aeron, Spatiale de Belg./Belg., Inst. voor Ruimte-Aeron., Uccle.
Fish, D.J., et al., 1995. Rotational Raman scattering and the Ring effect in zenith-sky spectra. Geophysical Research Letters, 22, 811–814.
Chance, K.V., et al.,. 1997. Ring effect studies: Rayleigh scattering, including molecular parameter for rotational Raman scattering, and the Fraunhofer spectrum. Applied Optics, 36, 5224–5230.