Treatment Outcomes of Patients with Multidrug-Resistant Tuberculosis:
Comparison of Pre- and Post-Public–Private Mix Periods
Yewon Kang, M.D.
1, Eun-Jung Jo, M.D.
2, Jung Seop Eom, M.D.
2,3, Mi-Hyun Kim, M.D.
2,3, Kwangha Lee, M.D.
2,3, Ki Uk Kim, M.D.
2,3, Hye-Kyung Park, M.D.
2,3, Min Ki Lee, M.D.
2,3and Jeongha Mok, M.D.
2,3,41
Department of Internal Medicine, VHS Medical Center, Busan,
2Department of Internal Medicine, Pusan National University Hospital, Busan,
3Pusan National University School of Medicine, Busan,
4Biomedical Research Institute, Pusan National University Hospital, Busan, Republic of Korea
Background: This study compared the treatment outcomes of patients with multidrug-resistant tuberculosis (MDR- TB) before and after the implementation of public–private mix (PPM). Factors affecting treatment success were also investigated.
Methods: Data from culture-confirmed pulmonary MDR-TB patients who commenced MDR-TB treatment at Pusan National University Hospital between January 2003 and December 2017 were retrospectively reviewed. Patients were divided into two groups in terms of PPM status: pre-PPM period, patients who commenced MDR-TB treatment between 2003 and 2010; and post-PPM period, patients treated between 2011 and 2017.
Results: A total of 176 patients were included (64 and 112 in the pre- and post-PPM periods, respectively). 36.9% of the patients were resistant to a fluoroquinolone or a second-line injectable drug, or both. The overall treatment success rate was 72.7%. The success rate of post-PPM patients was higher than that of pre-PPM patients (79.5% vs. 60.9%, p=0.008).
Also, loss to follow-up was lower in the post-PPM period (5.4% vs. 15.6%, p=0.023). In multivariate regression analysis, age
≥65 years, body mass index ≤18.5 kg/m
2, previous TB treatment, bilateral lung involvement, and extensively drug-resistant (XDR)- or pre-XDR-TB were associated with poorer treatment outcomes. However, the use of bedaquiline or delamanid for ≥1 month increased the treatment success.
Conclusion: The treatment success rate in MDR-TB patients was higher in the post-PPM period than in the pre-PPM period, particularly because of the low rate of loss to follow-up. To ensure comprehensive patient-centered PPM in South Korea, investment and other support must be adequate.
Keywords: Multidrug-Resistant Tuberculosis; PPM; Public–Private Mix; South Korea; Treatment Outcome
Address for correspondence: Jeongha Mok, M.D.
Department of Internal Medicine, Pusan National University Hospital, 179 Gudeok-ro, Seo-gu, Busan 49241, Republic of Korea Phone: 82-51-240-7889, Fax: 82-51-254-3127, E-mail: [email protected]
Received: Aug. 8, 2020, Revised: Sep. 29, 2020, Accepted: Oct. 28, 2020, Published online: Oct. 28, 2020
cc
It is identical to the Creative Commons Attribution Non-Commercial License (http://creativecommons.org/licenses/by-nc/4.0/).
Copyright © 2021
The Korean Academy of Tuberculosis and Respiratory Diseases.
Introduction
Multidrug-resistant tuberculosis (MDR-TB) constitutes a major global obstacle when seeking to eliminate tuberculosis (TB), and is also a significant public health problem
1. Treat- ment is challenging; long-term use of second-line anti-TB drugs that are more toxic and less effective than first-line drugs is essential
2. Treatment outcomes remain unsatisfactory. The proportion of MDR-TB patients in a 2016 global cohort who successfully completed treatment was only 56%
3. The treat- ment success rate of extensively drug-resistant (XDR)-TB patients is very poor; only 39% of such patients successfully completed treatment in 2016
3.
Despite national efforts to control TB, South Korea has the highest TB incidence of all member countries of the Organi- zation for Economic Co-operation and Development, with a total TB incidence of 65.9/100,000 in 2018
4,5. In 2018, 3.2% of new cases and 9.2% of previously treated cases had multidrug- resistant (MDR)- or rifampicin-resistant (RR)-TB; 618 patients with MDR-TB were recorded by the Korean National TB Sur- veillance System
3,5. The treatment success rates of MDR/RR- and XDR-TB in 2016 were only 66 and 58%, respectively
3.
Traditionally, public health centers have played major roles in the treatment and management of TB patients; the centers are part of the national TB control program of South Korea.
However, when the National Health Insurance system was extended to cover almost the entire South Korean population in 1989, the proportion of TB patients treated by the private sector began to increase steadily (from 54% in 2001 to 96%
in 2018)
5,6. However, the treatment outcomes of TB patients treated in the private sector have been poorer than those of patients visiting public health centers. A lack of systematic patient management and inappropriate anti-TB regimens are the principal causes of poor treatment outcomes in the private sector
4,7-9.
To overcome these problems, South Korea implemented a public‒private mix (PPM) as a pilot program based on World Health Organization (WHO) recommendations in 2007, and expanded it nationwide in 2011
9-11. To ensure the comprehen- sive management of TB patients, trained TB-specialist nurses have been dispatched to private hospitals throughout South Korea. PPM features patient management, including monitor- ing during the entire length of each treatment, case holding, counseling if adverse drug reactions emerge, health educa- tion, contact tracing, and financial support of TB patients
4,9. In 2017, 127 private hospitals were engaged in PPM in South Korea, and about 70% of new TB patients were treated in such hospitals
9.
Positive PPM outcomes have been reported globally
4,6,12. In South Korea, however, limited data are available on treat- ment outcomes of MDR-TB patients after the implementa- tion of PPM. This study compared the treatment outcomes of patients with MDR-TB before and after the implementation
of PPM. Factors affecting treatment success were also investi- gated.
Materials and Methods
1. Study design and subjects
This retrospective cohort study was conducted at Pusan Na- tional University Hospital (PNUH), a university-affiliated ter- tiary care hospital in Busan, South Korea; this private hospital has 1,400 beds. PNUH is well-equipped for TB diagnosis and treatment, with TB specialists on staff, an advanced labora- tory, and negative-pressure rooms. PNUH serves as a referral hospital for all provincial patients with MDR-TB.
All culture-confirmed pulmonary MDR-TB patients who commenced MDR-TB treatment at PNUH between January 2003 and December 2017 were included. Rifampicin (RIF)- monoresistant TB was considered to be MDR-TB. All MDR-TB cases were confirmed using either culture-based, phenotypic drug susceptibility testing (DST) or molecular DST including a line probe assay (LPA) or the Xpert MTB/RIF assay. Patients with extra-pulmonary TB only, or for whom phenotypic DST data were lacking, were excluded. The patients were divided into two groups by PPM status: pre-PPM period, patients who commenced MDR-TB treatment between 2003 and 2010; and post-PPM period, patients treated between 2011 and 2017.
Although PNUH had engaged in PPM since 2009, there was some early confusion in its implementation; thus, 2011 (the year in which PPM expanded nationwide) was chosen as the year of PPM commencement.
The study was reviewed and approved by the Institutional Review Board of PNUH (H-2004-025-090). The need for informed consent was waived given the observational retro- spective nature of the study. Our work had no impact on pa- tient diagnosis or treatment.
2. Data collection
The following data were collected from medical records:
age, sex, height, body weight, comorbidities, smoking status, previous treatment for TB, initial sputum acid-fast bacilli (AFB) smear and laboratory results, DST results, and chest radio- graph and computed tomography findings. The diagnostic and treatment modalities were investigated, including bron- choscopy, molecular DST, and treatment regimens (including surgery). Total treatment durations and final outcomes were also evaluated.
3. Definitions
MDR-TB was defined as TB resistant to both isoniazid (INH)
and RIF; XDR-TB as MDR-TB further resistant to any fluoro-
quinolone (FQ) and at least one of the three second-line in- jectable drugs (SLIDs; kanamycin [KM], amikacin [AMK], and capreomycin [CM]); and pre-XDR-TB as MDR-TB further re- sistant to either an FQ or any SLID but not both
13. The patients were classified into two groups by treatment history: new pa- tients who had never been treated or who had taken anti-TB drugs for <1 month, and previously treated patients who had received anti-TB drugs for ≥1 month
13. Treatment outcomes were categorized in accordance with the WHO definitions as follows: cured, treatment completed, treatment failed, died, lost to follow-up, or not evaluated
13. Treatment success was defined as the sum of cured and treatment completed. All other treatment outcomes were considered unfavorable.
4. DST and MDR-TB treatment
All Mycobacterium tuberculosis isolates were sent to the Korean Institute of Tuberculosis for phenotypic DST. The drug susceptibility of the M. tuberculosis isolates was assessed us- ing the absolute concentration method in Lowenstein-Jensen medium. The drugs included in the phenotypic DST were INH, RIF, ethambutol, rifabutin, streptomycin (SM), AMK, KM, CM, ofloxacin (OFX), levofloxacin (LFX), moxifloxacin (MFX), prothionamide (PTO), cycloserine (CS), and para- aminosalicylic acid. Pyrazinamide (PZA) susceptibility was determined using the pyrazinamidase test. Tests for resistance to AMK and LFX have been available since 2007 and 2009, re- spectively. The LPA for INH and RIF (GenoType MTBDRplus;
Hain Lifescience, Nehren, Germany; or AdvanSure MDR-TB
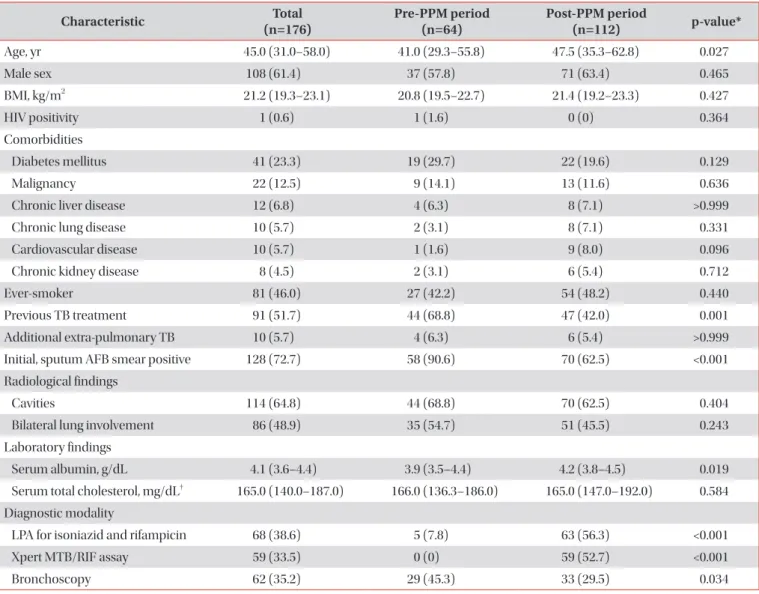
Table 1. Baseline characteristics of all patients
Characteristic Total
(n=176) Pre-PPM period
(n=64) Post-PPM period
(n=112) p-value*
Age, yr 45.0 (31.0–58.0) 41.0 (29.3–55.8) 47.5 (35.3–62.8) 0.027
Male sex 108 (61.4) 37 (57.8) 71 (63.4) 0.465
BMI, kg/m
221.2 (19.3–23.1) 20.8 (19.5–22.7) 21.4 (19.2–23.3) 0.427
HIV positivity 1 (0.6) 1 (1.6) 0 (0) 0.364
Comorbidities
Diabetes mellitus 41 (23.3) 19 (29.7) 22 (19.6) 0.129
Malignancy 22 (12.5) 9 (14.1) 13 (11.6) 0.636
Chronic liver disease 12 (6.8) 4 (6.3) 8 (7.1) >0.999
Chronic lung disease 10 (5.7) 2 (3.1) 8 (7.1) 0.331
Cardiovascular disease 10 (5.7) 1 (1.6) 9 (8.0) 0.096
Chronic kidney disease 8 (4.5) 2 (3.1) 6 (5.4) 0.712
Ever-smoker 81 (46.0) 27 (42.2) 54 (48.2) 0.440
Previous TB treatment 91 (51.7) 44 (68.8) 47 (42.0) 0.001
Additional extra-pulmonary TB 10 (5.7) 4 (6.3) 6 (5.4) >0.999
Initial, sputum AFB smear positive 128 (72.7) 58 (90.6) 70 (62.5) <0.001
Radiological findings
Cavities 114 (64.8) 44 (68.8) 70 (62.5) 0.404
Bilateral lung involvement 86 (48.9) 35 (54.7) 51 (45.5) 0.243
Laboratory findings
Serum albumin, g/dL 4.1 (3.6–4.4) 3.9 (3.5–4.4) 4.2 (3.8–4.5) 0.019
Serum total cholesterol, mg/dL
†165.0 (140.0–187.0) 166.0 (136.3–186.0) 165.0 (147.0–192.0) 0.584 Diagnostic modality
LPA for isoniazid and rifampicin 68 (38.6) 5 (7.8) 63 (56.3) <0.001
Xpert MTB/RIF assay 59 (33.5) 0 (0) 59 (52.7) <0.001
Bronchoscopy 62 (35.2) 29 (45.3) 33 (29.5) 0.034
Values are presented as median (interquartile range) or number (%).
*Comparison between the pre- and post-PPM periods.
†n=155.
PPM: public‒private mix; BMI: body mass index; HIV: human immunodeficiency virus; TB: tuberculosis; AFB: acid-fast bacilli; LPA: line probe assay.
GenoBlot assay; LG Life Sciences, Seoul, Korea) and the Xpert MTB/RIF assay (Cepheid, Sunnyvale, CA, USA) were intro- duced at PNUH in 2007 and 2012, respectively. All tests were performed according to the manufacturers’ instructions.
Treatment regimens were individualized based on the DST results in line with the Korean guidelines. The regimens and treatment durations of these guidelines are similar to those of the WHO guidelines: at least four effective second-line anti- TB drugs with or without PZA for at least 20 months
14-18. Most MDR-TB treatment regimens included an FQ and a SLID if resistance to or intolerance of such drugs was absent. Line- zolid (LZD) was introduced at PNUH in 2005 as a component of MDR-TB treatment. Bedaquiline (BDQ) and delamanid
(DLM) were introduced at PNUH in 2015.
5. PPM activities
In the time since PPM commencement, all MDR-TB pa- tients began treatment during enforced hospitalization in a negative-pressure room until they became non-infectious (e.g., until the sputum smear became negative); the required dura- tion of forced hospitalization is at least 2 weeks. Anti-TB drugs were administered under directly observed therapy (DOT) during hospitalization but were self-administered after dis- charge. After discharge, PPM nurses continued to monitor the treatment, offering counseling if adverse drug reactions de-
Table 2. Drug resistances of all patients
Variable Total
(n=176) Pre-PPM period
(n=64) Post-PPM period
(n=112) p-value*
Resistance on phenotypic DST
†Isoniazid 165/176 (93.8) 62/64 (96.9) 103/112 (92.0) 0.332
Rifampicin
‡171/176 (97.2) 64/64 (100) 107/112 (95.5) 0.160
Rifabutin 128/176 (72.7) 49/64 (76.6) 79/112 (70.5) 0.388
Ethambutol 112/176 (63.6) 39/64 (60.9) 73/112 (65.2) 0.574
Pyrazinamide
§71/176 (40.3) 30/64 (46.9) 41/112 (36.6) 0.182
Ofloxacin 47/176 (26.7) 14/64 (21.9) 33/112 (29.5) 0.274
Levofloxacin 31/141 (22.0) 4/29 (13.8) 27/112 (24.1) 0.232
Moxifloxacin 30/176 (17.0) 7/64 (10.9) 23/112 (20.5) 0.103
Streptomycin 48/176 (27.3) 13/64 (20.3) 35/112 (31.3) 0.117
Amikacin 23/158 (14.6) 8/46 (17.4) 15/112 (13.4) 0.517
Kanamycin 36/176 (20.5) 18/64 (28.1) 18/112 (16.1) 0.057
Capreomycin 25/176 (14.2) 10/64 (15.6) 15/112 (13.4) 0.683
Prothionamide 30/176 (17.0) 10/64 (15.6) 20/112 (17.9) 0.705
Cycloserine 18/176 (10.2) 8/64 (12.5) 10/112 (8.9) 0.452
Para-aminosalicylic acid 55/176 (31.3) 19/64 (29.7) 36/112 (32.1) 0.735
No. of resistant drugs 5.0 (3.0–8.0) 5.0 (3.3–8.0) 4.5 (3.0–8.0) 0.657
Resistance level
MDR-TB
‖¶111 (63.1) 38 (59.4) 73 (65.2) 0.443
Pre-XDR-TB with FQ resistance** 27 (15.3) 7 (10.9) 20 (17.9) 0.220
Pre-XDR-TB with SLID resistance
††18 (10.2) 12 (18.8) 6 (5.4) 0.005
XDR-TB 20 (11.4) 7 (10.9) 13 (11.6) 0.893
Values are presented as number (%) or median (interquartile range).
*Comparison between the pre- and post-PPM periods.
†Number of resistant patients/total tested patients (%).
‡Five patients were confirmed to have MDR-TB via molecular DST.
§By the pyrazinamidase test.
‖Including 10 patients with rifampicin-monoresistant TB (two in the pre- PPM period; eight in the post-PPM period).
¶Multidrug-resistant tuberculosis without additional resistance to fluoroquinolone or a second- line injectable drug. **Multidrug-resistant tuberculosis resistant to any fluoroquinolone but not to any second-line injectable drug (amikacin, kanamycin, or capreomycin).
††Multidrug-resistant tuberculosis resistant to any second-line injectable drug (amikacin, kanamycin, or capreo- mycin) but not to any fluoroquinolone.
PPM: public‒private mix; DST: drug susceptibility test; MDR: multidrug-resistant; TB: tuberculosis; XDR: extensively drug-resistant; FQ: fluo-
roquinolone; SLID: second-line injectable drug.
veloped and education via either telephone or face to face. If a patient was non-adherent, the nurse encouraged a hospital visit over the telephone or requested administrative action by a public health center. All hospital stays and visits for diagno- sis and treatment were free; the living costs of family members were also supported if the patients were unable to work.
6. Statistical analysis
Continuous variables are presented as medians with in- terquartile ranges, and categorical variables as numbers with percentages. Continuous variables were compared using the Mann–Whitney U test, and categorical variables using the chi- square or Fisher exact test. Significant trends in annual treat- ment outcomes were examined using the chi-square test for trend. Logistic regression analysis was used to identify factors affecting treatment success. Variables were included in the lo-
gistic regression analysis based on the results of the chi-square or Fisher exact test. Factors of interest were also included:
sex, diabetes mellitus, presence of cavity, sputum AFB smear positivity, resistance level, and use of LZD, BDQ, or DLM. Vari- ables with a p<0.2 in the univariate analyses were included in the multivariate logistic regression model. Variables were eliminated using the backward stepwise selection method (likelihood ratio). A p<0.05 was deemed to reflect statistical significance. All statistical analyses were performed using SPSS Statistics version 22.0 (IBM Corp., Armonk, NY, USA).
Results
1. Baseline characteristics
A total of 185 patients were screened. After application
Table 3. Treatment modalities of all patients
Variable Total
(n=176) Pre-PPM period
(n=64) Post-PPM period
(n=112) p-value*
Anti-TB drugs used for ≥1 mo
Isoniazid 14 (8.0) 9 (14.1) 5 (4.5) 0.024
Rifabutin 10 (5.7) 5 (7.8) 5 (4.5) 0.500
Ethambutol 34 (19.3) 20 (31.3) 14 (12.5) 0.002
Pyrazinamide 116 (65.9) 30 (46.9) 86 (76.8) <0.001
Ofloxacin 4 (2.3) 4 (6.3) 0 (0) 0.016
Levofloxacin 64 (36.4) 21 (32.8) 43 (38.4) 0.459
Moxifloxacin 90 (51.1) 42 (65.6) 48 (42.9) 0.004
Any fluoroquinolone
†152 (86.4) 62 (96.9) 90 (80.4) 0.002
Streptomycin 52 (29.5) 35 (54.7) 17 (15.2) <0.001
Amikacin 41 (23.3) 1 (1.6) 40 (35.7) <0.001
Kanamycin 56 (31.8) 15 (23.4) 41 (36.6) 0.071
Any injectable drug
‡143 (81.3) 48 (75.0) 95 (84.8) 0.108
Prothionamide 141 (80.1) 54 (84.4) 87 (77.7) 0.284
Cycloserine 149 (84.7) 58 (90.6) 91 (81.3) 0.097
Para-aminosalicylic acid 71 (40.3) 39 (60.9) 32 (28.6) <0.001
Linezolid 34 (19.3) 3 (4.7) 31 (27.7) <0.001
Clofazimine 9 (5.1) 0 (0) 9 (8.0) 0.027
Bedaquiline 15 (8.5) 0 (0) 15 (13.4) 0.002
Delamanid 18 (10.2) 0 (0) 18 (16.1) <0.001
No. of drugs used for ≥1 mo 5.0 (5.0–6.0) 5.0 (5.0–6.0) 5.0 (5.0–6.0) 0.255
Surgery to treat TB 10 (5.7) 5 (7.8) 5 (4.5) 0.500
Total treatment duration, day 609.0 (499.8–706.8) 696.5 (486.0–802.8) 608.5 (516.5–625.8) 0.001 Values are presented as number (%) or median (interquartile range).
*Comparison between the pre- and post-PPM periods.
†Ofloxacin or levofloxacin or moxifloxacin.
‡Streptomycin or amikacin or kanamycin.
PPM: public‒private mix; TB: tuberculosis.
of the above criteria, 176 patients were included in the final analysis (64 patients in the pre-PPM period and 112 in the post-PPM period). Nine patients were excluded: five with extra-pulmonary TB only and four for whom phenotypic DST data were lacking. The baseline characteristics are summa- rized in Table 1. The median age was 45 years (interquartile range, 31–58 years), and 108 patients (61.4%) were male. The patients of the post-PPM period were older and had higher serum albumin levels than those of the pre-PPM period. How- ever, the proportions of patients who had received previous TB treatments and those with positive initial sputum AFB smears were higher in the pre-PPM period. More molecular DSTs were performed in the post-PPM period than the pre- PPM period.
2. Drug resistance and treatment modality
Table 2 shows the rates of resistance of all patients to anti- TB drugs. Strains from MDR-TB patients exhibited additional resistance to PZA (40.3%), any FQ (26.7%), any SLID (21.6%), PTO (17.0%), and CS (10.2%). Pre-XDR- and XDR-TB patients
accounted for 36.9% of all patients. There was no difference in the resistance rates of individual anti-TB drugs or the number of resistant drugs in the pre- and post-PPM periods. However, the proportion of pre-XDR-TB patients exhibiting SLID resis- tance was lower in the post-PPM period.
The most common anti-TB drugs used in all patients were FQs (OFX, LFX, or MFX; 86.4%), followed by CS (84.7%), in- jectables (SM, AMK, or KM; 81.3%), PTO (80.1%), and PZA (65.9%). Of all patients, 19.3%, 10.2%, and 8.5% were given LZD, DLM, and BDQ, respectively. Ten patients (5.7%) under- went surgery (Table 3). PZA, AMK, LZD, clofazimine (CFZ), BDQ, and DLM were more commonly prescribed in the post- PPM period. The numbers of drugs used for ≥1 month did not differ between the two periods. However, the total treatment duration was shorter in the post-PPM period (Table 3).
3. Treatment outcomes
The final treatment outcomes of all patients are listed in Table 4. The overall treatment success rate was 72.7%. The un- favorable treatment outcomes were as follows: lost to follow-
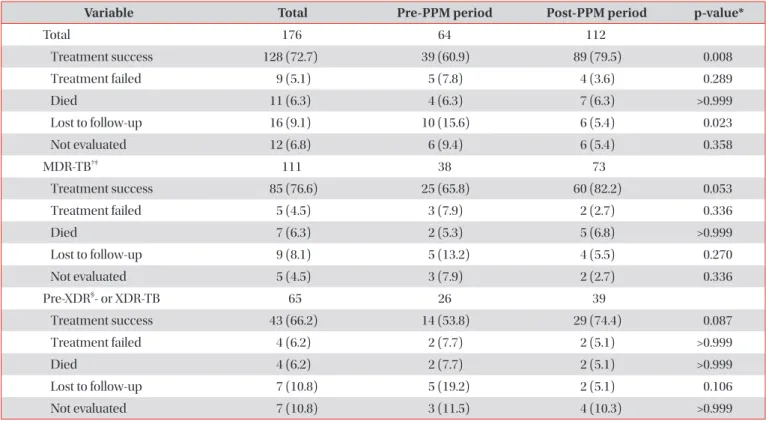
Table 4. Treatment outcomes of all patients
Variable Total Pre-PPM period Post-PPM period p-value*
Total 176 64 112
Treatment success 128 (72.7) 39 (60.9) 89 (79.5) 0.008
Treatment failed 9 (5.1) 5 (7.8) 4 (3.6) 0.289
Died 11 (6.3) 4 (6.3) 7 (6.3) >0.999
Lost to follow-up 16 (9.1) 10 (15.6) 6 (5.4) 0.023
Not evaluated 12 (6.8) 6 (9.4) 6 (5.4) 0.358
MDR-TB
†‡111 38 73
Treatment success 85 (76.6) 25 (65.8) 60 (82.2) 0.053
Treatment failed 5 (4.5) 3 (7.9) 2 (2.7) 0.336
Died 7 (6.3) 2 (5.3) 5 (6.8) >0.999
Lost to follow-up 9 (8.1) 5 (13.2) 4 (5.5) 0.270
Not evaluated 5 (4.5) 3 (7.9) 2 (2.7) 0.336
Pre-XDR
§- or XDR-TB 65 26 39
Treatment success 43 (66.2) 14 (53.8) 29 (74.4) 0.087
Treatment failed 4 (6.2) 2 (7.7) 2 (5.1) >0.999
Died 4 (6.2) 2 (7.7) 2 (5.1) >0.999
Lost to follow-up 7 (10.8) 5 (19.2) 2 (5.1) 0.106
Not evaluated 7 (10.8) 3 (11.5) 4 (10.3) >0.999
Values are presented as number (%).
*Comparison between the pre- and post-PPM periods.
†Including ten patients with rifampicin-monoresistant TB (two patients in the pre- PPM period; eight in the post-PPM period).
‡Multidrug-resistant tuberculosis without additional resistance to fluoroquinolone or a second- line injectable drug.
§Multidrug-resistant tuberculosis resistant to any fluoroquinolone or any second-line injectable drug (amikacin, kanamy- cin, or capreomycin), but not both.
PPM: public‒private mix; MDR: multidrug-resistant; TB: tuberculosis; XDR: extensively drug-resistant.
up (9.1%), not evaluated (6.8%), died (6.3%), and treatment failed (5.1%). The treatment success rates of MDR-TB patients lacking additional resistance to FQ and SLID, and those of pre-XDR- and XDR-TB patients, were 76.6 and 66.2%, respec- tively. The treatment success rate was higher in the post-PPM period (79.5% vs. 60.9%). Of the unfavorable outcomes, the loss to follow-up rate was significantly lower in the post-PPM period (5.4% vs. 15.6%). Figure 1 shows the annual trends in the treatment outcomes of all patients. Treatment success in- creased every year, and the proportions of patients who failed treatment, were lost to follow-up, and who were not evaluated decreased every year.
4. Factors affecting treatment success
Comparison of patients whose treatments were success- ful and those that were not revealed that, in the latter group the body mass index (BMI) and serum albumin level were lower, and the proportions who had undergone prior TB treatment and who exhibited bilateral lung involvement were higher (Table 5). In multivariate regression analysis, age ≥65 years, BMI ≤18.5 kg/m
2, previous TB treatment, bilateral lung involvement, and pre-XDR- or XDR-TB were associated with poorer treatment outcomes. However, use of BDQ or DLM for
≥1 month increased the treatment success rate (Table 6).
Discussion
It is well-known that loss to follow-up reduces treatment success in MDR-TB patients in South Korea. A recent study employing national registry data showed that although the trend was decreasing, about 10% of MDR-TB patients are still lost to follow-up annually
19. In this study, 14% of MDR-TB pa- tients were transferred out during treatment. However, many of these patients were probably lost to follow-up. This is a seri- ous problem in South Korea, but is not unique to our country.
In one global cohort, 15% of MDR/RR-TB patients were lost to follow-up in 2016
3, risking drug resistance, complications, death, and the community spread of difficult-to-treat patho- gens
20,21. Of the 16 patients lost to follow-up in our study, 11 were positive for M. tuberculosis culture at the time of loss.
About half of all MDR-TB patients had no history of prior TB treatment. The proportions of new patients among all MDR- TB patients did not decrease annually in an earlier South Ko- rean study
22. This may be partly explained by the fact that such patients are lost while infectious, and thus spread the disease in the community.
In our study, the treatment success rate of MDR-TB pa- tients was higher in the post-PPM period than in the pre-PPM period, particularly because of the low rate of loss to follow- up. In terms of patient management, PPM contributed to the decrease in loss to follow-up. However, other factors may be important in the post-PPM period. Many improvements to the national TB control program have been made, and pa- tient socioeconomic status in the post-PPM period has also changed. New or repurposed anti-TB drugs such as LZD, CFZ, BDQ, and DLM were more commonly prescribed in the post-PPM period. These drugs are efficacious, as revealed by a meta-analysis and real-world data
23,24. Two new drugs, BDQ and DLM, are particularly patient-friendly (few adverse drug reactions); their use was associated with higher treatment success in our study. In the post-PPM period, the proportion of patients with positive sputum AFB smears was lower and the proportion that underwent molecular DST higher. Thus, MDR-TB may have been diagnosed when the bacterial bur- den was low. Early diagnosis and rapid appropriate treatment may have improved outcomes. Unfortunately, it was impos- sible to quantify the contribution of PPM to the positive out- come using our pre–post period study design. Further studies with appropriate designs are needed to clarify the impact of PPM on the treatment outcome of MDR-TB patients in South Korea.
Although PPM was successfully implemented in South Korea, several problems remain. First, a full course of DOT is required, as it is crucial for improving treatment adherence and has been recommended by the WHO for all MDR-TB patients
17,25. In South Korea, however, most MDR-TB patients undergo DOT only during hospitalization. Only selected pa- tients (those receiving new or repurposed drugs, or who do
2003 100
80
60
40
20
Percentage
Year 0
2005 2006 2007 2008 2009 2010 201 1
2012 2013 2014 2015 2016 2017 Not evaluated (p for trend<0.001) Lost to follow-up (p for trend=0.004) Died (p for trend=0.422)
Failed (p for trend=0.010) Success (p for trend=0.023)