ABSTRACT
Background: By estimating the survival rates and exploring prognostic factors in pediatric patients with relapsed or progressed solid tumors, our purpose was to generate background data for future studies.
Methods: We reviewed the medical records of 258 patients with solid tumors who experienced relapse/progression and received subsequent salvage treatment between 1996 and 2016.
Results: A total of 60 patients remained progression-free during first-line salvage treatment, while the remaining 198 patients experienced relapse/progression again; 149 underwent second-line salvage treatment. A total of 76 patients underwent high-dose chemotherapy and autologous stem cell transplantation (HDCT/auto-SCT), and 44 patients received allogeneic SCT. The 10-year progression-free survival (PFS) and overall survival (OS) from relapse/
progression were 18.4% ± 2.7% and 24.5% ± 3.0%, respectively. Survival rates were relatively higher in patients with anaplastic ependymoma, initially non-high-risk neuroblastoma, osteosarcoma, Wilms tumor and retinoblastoma. A multivariate analysis showed that relapse/progression during initial treatment, metastatic relapse/progression, and impossible debulking surgery were independent poor prognostic factors for both PFS and OS. Patients who exhibited a complete response or partial response during conventional salvage treatment showed significantly higher survival after SCT than those with stable disease or progressive disease (10-year OS: 54.8% ± 7.0% vs. 7.0% ± 3.5%, P < 0.001).
Conclusion: The prognosis of relapsed/progressed pediatric solid tumors still remains unsatisfactory. New, effective treatment strategies are needed to overcome limitations of current approaches. Hopefully, the background data generated herein will be used in future clinical trials involving patients with relapsed/progressed solid tumors.
Keywords: Solid Tumor; Children; Relapse; Survival
INTRODUCTION
Cancer remains one of the leading causes of death in children and adolescents, although childhood cancer accounts for only a small part of the global cancer burden. Thanks to remarkable progress in the diagnosis and treatment of childhood cancer, the overall survival
Original Article
Received: Feb 20, 2018 Accepted: Jun 20, 2018 Address for Correspondence:
Ki Woong Sung, MD, PhD
Department of Pediatrics, Samsung Medical Center, Sungkyunkwan University School of Medicine, 81 Irwon-ro, Gangnam-gu, Seoul 06351, Korea.
E-mail: [email protected]
*Hee Won Cho and Ji Won Lee contributed equally to this work.
© 2018 The Korean Academy of Medical Sciences.
This is an Open Access article distributed under the terms of the Creative Commons Attribution Non-Commercial License (https://
creativecommons.org/licenses/by-nc/4.0/) which permits unrestricted non-commercial use, distribution, and reproduction in any medium, provided the original work is properly cited.
ORCID iDs Hee Won Cho
https://orcid.org/0000-0002-0440-645X Ji Won Lee
https://orcid.org/0000-0003-0084-1304 Youngeun Ma
https://orcid.org/0000-0002-5862-6319 Keon Hee Yoo
https://orcid.org/0000-0002-5980-7912 Ki Woong Sung
https://orcid.org/0000-0001-5989-4772 Hong Hoe Koo
https://orcid.org/0000-0001-8082-1412
Hee Won Cho ,* Ji Won Lee ,* Youngeun Ma , Keon Hee Yoo , Ki Woong Sung , and Hong Hoe Koo
Department of Pediatrics, Samsung Medical Center, Sungkyunkwan University School of Medicine, Seoul, Korea
Treatment Outcomes in Children and Adolescents with Relapsed or Progressed Solid Tumors: a 20-year, Single-Center Study
Pediatrics
Funding
This study was supported by a grant from the National R&D Program for Cancer Control, Ministry of Health and Welfare, Republic of Korea (No. 1520210).
Disclosure
The authors have no potential conflicts of interest to disclose.
Author Contributions
Conceptualization: Lee JW, Sung KW. Data curation: Cho HW, Lee JW, Ma Y. Formal analysis: Yoo KH, Sung KW, Koo HH. Writing - original draft: Cho HW, Lee JW, Sung KW.
Writing - review & editing: Lee JW, Yoo KH, Sung KW, Koo HH.
(OS) of childhood cancer has improved dramatically in recent decades. According to the statistics from the American Cancer Society in 2014, the 5-year survival rates for pediatric cancer exceeded 80% in developed countries.1 A multidisciplinary team approach, together with sophisticated risk stratification, has achieved notable advances in this field.
Behind these success stories, relapse or progression still occurs in a significant proportion of cases. Among the children that enrolled in the US Childhood Cancer Survivor Study, relapse or progression of the original cancer was the leading cause of late mortality, accounting for 58% of deaths.1 The prognosis of relapsed/progressed childhood cancer remains unfavorable, particularly for cases with certain solid tumors, such as neuroblastoma and bone and soft tissue sarcomas.2 Numerous attempts have been made to improve the prognosis, and high- dose chemotherapy and autologous stem cell transplantation (HDCT/auto-SCT) has played an important role in some tumors.3,4 However, the survival rates for most relapsed/progressed solid tumors have been generally stagnant for almost 30 years.5
Despite the poor prognosis, published studies addressing the outcome of relapsed/
progressed pediatric solid tumors in large patient cohorts are scarce. An Italian study published in 2006 provides the latest comprehensive data regarding the survival of children with relapsed/progressed solid tumors.5 For this reason, in the present study, we aimed to estimate the OS and progression-free survival (PFS) of relapsed/progressed cases of entire solid tumors, to explore prognostic factors, and to help identify potential candidates for future studies.
METHODS
Patients
We reviewed the medical records of all patients with solid tumors who experienced relapse/
progression during or after first-line treatment at Samsung Medical Center between 1996 and 2016. The subjects were retrospectively identified through a survey of our institutional database. Patients whose tumor relapsed after surgery alone (without previous history of chemotherapy), those with low-grade glial tumors, those who were transferred to our center during salvage treatment, and those who refused salvage treatment were excluded from the analysis. During the study period, patients except those with unilateral retinoblastoma or initially low-risk tumors and those with organ dysfunction were recommended to undergo HDCT/auto-SCT if they remained progression-free during salvage treatment. For patients who failed tandem HDCT/auto-SCT, allogeneic stem cell transplantation (allo-SCT) was recommended if they remained progression-free during salvage treatment. Conventional chemotherapy was administered in order to reduce the tumor burden as much as possible prior to SCT. Salvage chemotherapy regimens were selected, and changed if necessary, depending on the regimens used prior to relapse/progression, tolerability to first-line salvage chemotherapy, and response to first-line salvage chemotherapy. Surgery was conducted to reduce the tumor burden whenever possible. Radiotherapy (RT) was also administered to relapsed or metastatic sites whenever possible. RT dose and volume were determined according to previous RT prior to relapse/progression.6,7 A detailed review of the clinical data was performed to ascertain the presenting features, degree of surgical resection, pathology, chemotherapy regimen, RT, the response to salvage treatment, and any events (relapse/
progression, second malignancy, treatment-related mortality, and death).
Response and toxicity criteria
We evaluated the treatment response using computed tomography, magnetic resonance imaging, various radioisotope scans, and bone marrow examination. We categorized the disease response as follows: 1) progressive disease (PD): greater than 25% increase in tumor size or the appearance of a new tumor; 2) stable disease (SD): less than 50% reduction in tumor size or less than 25% increase in tumor size; 3) partial response (PR): greater than 50% decrease in tumor size; and 4) complete response (CR): complete disappearance of all previously measurable tumors. For neuroblastomas, the international response criteria for neuroblastoma were used to evaluate the treatment response.8
Statistics
PFS was calculated from the date of first relapse/progression until the occurrence of second relapse/progression or last contact if the patient remained progression-free. OS was calculated from the date of initial relapse/progression until death from any cause or last contact if the patient remained alive. Survival rates and standard errors were estimated using the Kaplan-Meier method, and comparison of survival rates among groups were performed through the log-rank test. Multivariate analysis for survival was performed with Cox proportional hazards model. P values less than 0.05 were considered significant.
Ethics statement
The study protocol was approved by the Institutional Review Board at Samsung Medical Center (IRB No. 2017-12-067). The need for informed consent was waived by the board.
RESULTS
Patient characteristics
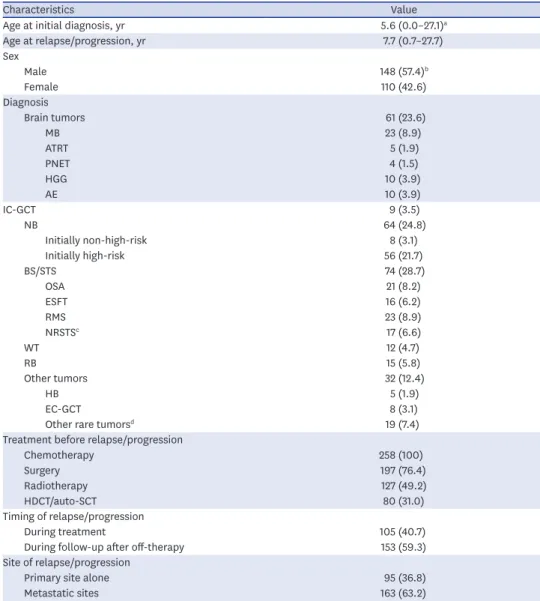
Table 1 lists the clinical characteristics of 258 patients (148 boys and 110 girls) who met the inclusion criteria. Sixty-one (23.6%) patients had brain tumors, 64 (24.8%) had
neuroblastomas, 74 (28.7%) had bone and soft tissue sarcomas, 12 (4.7%) had Wilms tumor, 15 (5.8%) had retinoblastoma, and the remaining 32 (12.4%) had other tumors. The median age at the time of initial diagnosis and at the time of first relapse/progression was 5.6 years (range, 0.0−27.1) and 8.1 years (range, 0.7−27.7), respectively. The median interval between the initial diagnosis and first relapse/progression was 1.3 years (range, 0.1–7.8). Of the total 258 patients, 80 (31.0%) patients had a previous history of HDCT/auto-SCT during initial treatment course.
Salvage treatment and general outcome
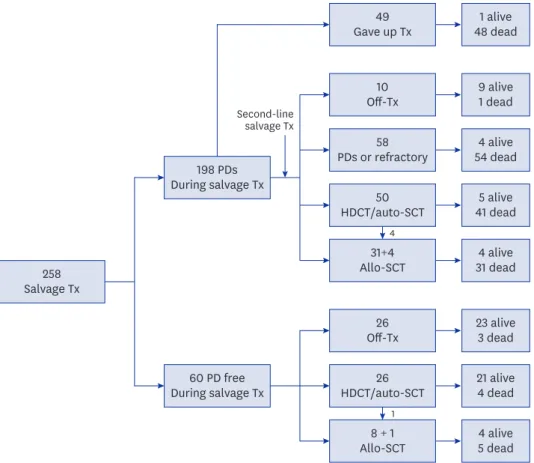
With regard to the type of salvage therapy, 227 (88.0%) of the 258 patients received salvage chemotherapy, 106 (41.1%) underwent surgery, and 100 (38.8%) received RT. A schematic flowchart of the total 258 patients is shown in Fig. 1. Of the 60 patients who remained progression-free during first-line salvage treatment, 26 went off therapy without HDCT/
auto-SCT, 26 proceeded to HDCT/auto-SCT (1 of them underwent allo-SCT following HDCT/
auto-SCT), and 8 proceeded to allo-SCT. Of the 198 patients who experienced relapse/
progression again during first-line salvage treatment, 49 gave up further treatment and the remaining 149 received second-line salvage treatment. Of these 149 patients, 10 went off therapy without subsequent HDCT/auto-SCT, 58 experienced relapse/progression again and gave up further treatment, 50 proceeded to HDCT/auto-SCT (4 of them underwent allo-SCT following
HDCT/auto-SCT), and 31 proceeded to allo-SCT, regardless of the response to second-line salvage treatment. Therefore, 76 (29.5%) of 258 patients underwent HDCT/auto-SCT and 44 (17.1%) underwent allo-SCT. As a result, 56 of the 258 patients remained progression-free and 71 patients survived during a median follow-up of 5.9 years (range, 1.7–19.8) from first relapse/
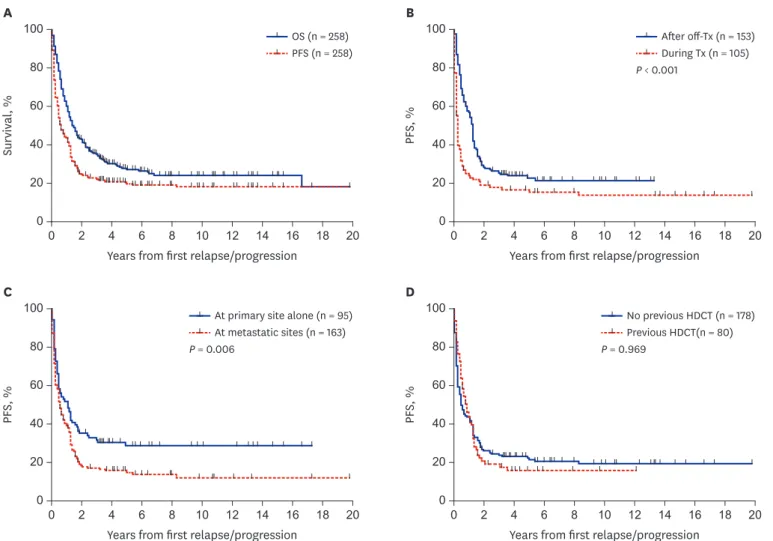
progression. The 10-year OS and PFS for the total 258 patients were 24.5% ± 3.0% and 18.4% ± 2.7%, respectively (Fig. 2A).
Table 1. Patient characteristics
Characteristics Value
Age at initial diagnosis, yr 5.6 (0.0–27.1)a
Age at relapse/progression, yr 7.7 (0.7–27.7)
Sex
Male 148 (57.4)b
Female 110 (42.6)
Diagnosis
Brain tumors 61 (23.6)
MB 23 (8.9)
ATRT 5 (1.9)
PNET 4 (1.5)
HGG 10 (3.9)
AE 10 (3.9)
IC-GCT 9 (3.5)
NB 64 (24.8)
Initially non-high-risk 8 (3.1)
Initially high-risk 56 (21.7)
BS/STS 74 (28.7)
OSA 21 (8.2)
ESFT 16 (6.2)
RMS 23 (8.9)
NRSTSc 17 (6.6)
WT 12 (4.7)
RB 15 (5.8)
Other tumors 32 (12.4)
HB 5 (1.9)
EC-GCT 8 (3.1)
Other rare tumorsd 19 (7.4)
Treatment before relapse/progression
Chemotherapy 258 (100)
Surgery 197 (76.4)
Radiotherapy 127 (49.2)
HDCT/auto-SCT 80 (31.0)
Timing of relapse/progression
During treatment 105 (40.7)
During follow-up after off-therapy 153 (59.3)
Site of relapse/progression
Primary site alone 95 (36.8)
Metastatic sites 163 (63.2)
MB = medulloblastoma, ATRT = atypical teratoid/rhabdoid tumor, PNET = primitive neuroectodermal tumor, HGG = high-grade glioma, AE = anaplastic ependymoma, IC-GCT = intracranial germ cell tumor, NB = neuroblastoma, BS/STS = bone and soft tissue sarcoma, OSA = osteosarcoma, ESFT = Ewing sarcoma family of tumor, RMS = rhabdomyosarcoma, NRSTS = non-rhabdomyomatous soft tissue sarcoma, WT = Wilms tumor, RB
= retinoblastoma, HB = hepatoblastoma, EC-GCT = extracranial germ cell tumor, HDCT/auto-SCT = high-dose chemotherapy and autologous stem cell transplantation.
aMedian (range); bNumber (%); cNRSTS includes synovial sarcoma in 3, desmoplastic small round cell tumor in 3, malignant peripheral nerve sheath tumor in 3, alveolar soft part sarcoma in 2, epitheloid sarcoma in 1, malignant fibrous histiocytoma in 1, and spindle cell sarcoma in 1; dOther rare tumors include malignant rhabdoid tumor in 3, renal cell carcinoma in 2, clear cell sarcoma in 2, hepatocellular carcinoma in 2, nasopharyngeal carcinoma in 2, adenoid cystic carcinoma in 1, adrenal cortical carcinoma in 1, congenital mesoblastic nephroma in 1, malignant triton tumor in 1, pancreatic carcinoma in 1, poorly differentiated carcinoma in 1, and rectal carcinoma in 1.
Outcomes according to the findings at first relapse/progression
We analyzed the outcomes according to the findings at first relapse/progression: timing of relapse/progression, patterns of relapse/progression, and previous history of HDCT/auto- SCT. Patients who experienced relapse/progression during follow-up after off-therapy showed significantly higher PFS and OS than those who experienced relapse/progression during initial treatment (10-year PFS: 21.8% ± 3.6% vs. 14.0% ± 3.7%, P < 0.001, Fig. 2B; 10-year OS:
28.4% ± 4.2% vs. 19.0% ± 4.0%, P < 0.001). Patients with local relapse/progression alone showed significantly higher PFS and OS than those with metastatic relapse/progression (10-year PFS: 28.8% ± 4.9% vs. 12.1% ± 3.0%, P = 0.006, Fig. 2C; 10-year OS: 37.2% ± 5.5%
vs. 17.0% ± 3.3%, P < 0.001). However, no significant difference in the PFS and OS was noted between patients who had a previous history of HDCT/auto-SCT and those who did not (10- year PFS: 19.6% ± 3.2% vs. 16.1% ± 4.4%, P = 0.969, Fig. 2D; 10-year OS: 26.6% ± 3.6% vs.
21.2% ± 5.0%, P = 0.199).
Outcomes according to histologic type
PFS and OS rates according to the histologic diagnosis were summarized in Tables 2 and 3, respectively. We classified the 258 patients into six tumor groups according to histologic diagnosis: brain tumors, neuroblastoma, bone and soft tissue sarcomas, Wilms tumor, retinoblastoma and other tumors. Fig. 3 shows survival rates in each histologic group and subgroup. When brain tumors were further classified into six subgroups according to the histologic diagnosis, survival rates were relatively higher in patients with anaplastic
1 alive 48 dead Gave up Tx49
Off-Tx10
PDs or refractory58
9 alive 1 dead 4 alive 54 dead
HDCT/auto-SCT50 5 alive 41 dead Allo-SCT31+4 4 alive 31 dead
Off-Tx26 23 alive 3 dead HDCT/auto-SCT26 21 alive 4 dead
8 + 1 Allo-SCT Salvage Tx258
198 PDs During salvage Tx
60 PD free During salvage Tx
4 alive 5 dead Second-line
salvage Tx
4
1
Fig. 1. Flow of patients. A flow of 258 patients were illustrated.
Tx = treatment, PD = progressive disease, HDCT = high-dose chemotherapy, auto-SCT = autologous stem cell transplantation, allo-SCT = allogeneic stem cell transplantation.
ependymoma (10-year PFS: 50.0% ± 15.8%, Fig. 3B; 10-year OS: 28.0% ± 21.6%).
No patients with primitive neuroectodermal tumors (PNETs) or high-grade gliomas remained progression-free. When neuroblastomas were classified into two subgroups, i.e., initially non-high-risk and initially high-risk tumors, patients with initially non- high-risk neuroblastomas showed higher PFS and OS than those with initially high-risk neuroblastomas (10-year PFS: 62.5% ± 21.4% vs. 9.7% ± 4.3%, P < 0.001, Fig. 3D; 10-year OS: 45.0% ± 18.8% vs. 14.5% ± 4.9%, P = 0.009). When bone and soft tissue sarcomas were divided into four subgroups — osteosarcoma, Ewing sarcoma family of tumors (ESFTs), rhabdomyosarcoma, and non-rhabdomyosarcoma soft tissue sarcomas (NRSTSs) — PFS and OS were highest among patients with osteosarcomas (10-year PFS: 25.0% ± 10.6% Fig. 3F;
10-year OS: 29.0% ± 10.9%). No patients with ESFTs remained progression-free after first relapse/progression. Survival rates in patients with Wilms tumor were encouraging (10-year PFS: 58.3% ± 14.2% Fig. 3G; 10-year OS: 65.6% ± 14.0%). PFS in patients with retinoblastoma was not satisfactory; however, many patients remain alive after enucleation of involved eye (10-year PFS: 22.2% ± 12.2% and 10-year OS: 78.3% ± 11.2%, Fig. 3H). When the ‘other tumors’ were classified into three subgroups — hepatoblastoma, extracranial germ cell tumors, and the remaining rare tumors — there was no significant difference in survival rates (Fig. 3I and J).
0 2 4 6 8 10 12 14 16 18 20
0 100
80
60
40
20
Survival, %
Years from first relapse/progression
OS (n = 258) PFS (n = 258)
A
0 2 4 6 8 10 12 14 16 18 20
0 100
80
60
40
20
PFS, %
Years from first relapse/progression
After off-Tx (n = 153) During Tx (n = 105) P < 0.001
B
0 2 4 6 8 10 12 14 16 18 20
0 100
80
60
40
20
PFS, %
Years from first relapse/progression
At primary site alone (n = 95) At metastatic sites (n = 163) P = 0.006
C
0 2 4 6 8 10 12 14 16 18 20
0 100
80
60
40
20
PFS, %
Years from first relapse/progression
No previous HDCT (n = 178) Previous HDCT(n = 80) P = 0.969
D
Fig. 2. Survival rates according to the findings at relapse/progression. (A) OS and PFS in all 258 patients. (B) PFS according to the timing of relapse/progression.
(C) PFS according to the site of relapse/progression. (D) PFS according to the previous history of HDCT/auto-SCT.
OS = overall survival, PFS = progression-free survival, HDCT/auto-SCT = high-dose chemotherapy and autologous stem cell transplantation, Tx = treatment.
Table 2. 10-year PFS according to patient characteristics DiagnosisAll patientsR/P at primaryMetastatic R/PP valueRT, impossibleRT, possibleP valueSurgery, impossibleSurgery, possibleP value No.10-yr PFSNo.10-yr PFSNo.10-yr PFSNo.10-yr PFSNo.10-yr PFSNo.10-yr PFSNo.10-yr PFS Brain tumors6120.2 ± 5.74625.1 ± 7.1156.7 ± 6.4a0.0072917.5 ± 7.43223.3 ± 8.40.1923814.1 ± 5.82330.4 ± 10.70.026 MB2321.7 ± 9.8a1534.6 ± 14.4a80< 0.001717.1 ± 15.61622.4 ± 12.3a0.8321720.4 ± 10.5633.3 ±19.3a0.170 ATRT520.0 ± 17.9a520.0 ± 17.9a0--20333.3 ± 27.20.04520333.3 ± 27.20.256 PNET4030100.15720200.51320200.513 HGG10090100.55360400.69360400.130 AE1050.0 ± 15.8757.1 ± 18.7333.3 ± 27.2a0.478944.4 ± 16.611000.37520862.5 ± 17.10.022 IC-GCT922.2 ± 13.9728.6 ± 17.1200.09730600.075922.2 ± 13.90-- NB6417.1 ± 5.2666.7 ± 19.35812.0 ± 4.70.034348.8 ± 4.93028.8 ± 9.30.0034019.3 ± 6.92412.5 ± 7.70.971 Non-high-risk862.5 ± 21.44100433.3 ± 27.2a0.157333.3 ± 27.251000.157566.7 ± 27.2350.0 ± 35.40.515 High-risk569.7 ± 4.3205410.0 ± 4.40.201316.5 ± 4.4a2512.9 ± 7.80.0083510.5 ± 5.6217.1 ± 6.30.782 BS/STS7412.9 ± 4.31720.2 ± 10.25711.0 ± 4.60.5464816.4 ± 5.8264.6 ± 4.50.258462.5 ± 2.42829.8 ± 9.30.002 OSA2125.0 ± 10.6333.3 ± 27.2a1825.0 ± 11.00.9941829.1 ± 12.1300.4301101060.0 ± 15.50.005 ESFT200601400.7871001000.432130700.922 RMS1614.1 ± 9.2633.3 ± 19.31000.1021010.0 ± 9.5620.0 ± 17.90.145139.2 ± 8.7333.3 ±27.2a0.233 NRSTS176.5 ± 5.8a201510.0 ± 8.8a0.3771015.0 ± 12.9a700.10490818.8 ± 15.80.184 WT1258.3 ± 14.2475.0 ± 21.7850.0 ± 17.70.453475.0 ± 21.7850.0 ± 17.70.55640887.5 ± 11.70.001 RB1522.2 ± 12.21330.8 ± 12.8200.9411522.2 ± 12.20--80757.4 ± 18.70.114 Other tumors3212.5 ± 5.9911.1 ± 10.52313.0 ± 7.00.9192810.7 ± 5.9425.0 ± 21.70.562166.3 ± 6.11618.8 ± 9.80.013 HB525.0 ± 15.310450.0 ± 25.00.351540.0 ± 21.90--20366.7 ± 27.20.039 EC-GCT8030500.08770100.74430500.245 Rare tumors1912.5 ± 8.3520.0 ± 17.9147.1 ± 6.90.183166.3 ± 6.1333.3 ± 27.20.321119.1 ± 8.7812.5 ± 11.70.174 PFS = progression-free survival, R/P = relapse/progression, MB = medulloblastoma, ATRT = atypical teratoid/rhabdoid tumor, PNET = primitive neuroectodermal tumor, HGG = high-grade glioma, AE = anaplastic ependymoma, IC-GCT = intracranial germ cell tumor, NB = neuroblastoma, BS/STS = bone and soft tissue sarcoma, OSA = osteosarcoma, ESFT = Ewing sarcoma family of tumors, RMS = rhabdomyosarcoma, NRSTS = non-rhabdomyomatous soft tissue sarcoma, WT = Wilms tumor, RB = retinoblastoma, HB = hepatoblastoma, EC-GCT = extracranial germ cell tumor. aThe longest follow-up duration of survivors was less than 10 years.
Table 3. 10-year OS according to patient characteristics DiagnosisAll patientsR/P at primaryMetastatic R/PP valueRT: impossibleRT: possibleP valueSurgery: impossibleSurgery: possibleP value No.10-yr OSNo.10-yr OSNo.10-yr OSNo.10-yr OSNo.10-yr OSNo.10-yr OSNo.10-yr OS Brain tumors6124.0 ± 6.14630.5 ± 7.6156.7 ± 6.4a0.0072918.7 ± 8.33228.7 ± 8.70.4103813.3 ± 6.42342.2 ± 10.60.097 MB2327.8 ± 10.1a1542.7 ± 14.0a800.003714.3 ± 13.21632.8 ± 13.30.4621711.8 ± 9.8666.7 ± 19.3a0.044 ATRT520.0 ± 17.9a520.0 ± 17.9a0--20333.3 ± 27.2a0.03920333.3 ± 27.2a0.364 PNET4030100.51520200.80820200.090 HGG1010.0 ± 9.5a911.1 ± 10.5a100.069616.7 ± 15.2a400.973616.7 ± 15.2a400.665 AE1028.0 ± 21.6735.7 ± 26.7333.3 ± 27.2a0.440926.7 ± 20.8100.53820862.5 ± 17.10.670 IC-GCT933.3 ± 15.7742.9 ± 18.7200.002333.3 ± 27.2633.3 ± 19.30.974933.3 ± 15.70-- NB6418.0 ± 5.1650.0 ± 20.45814.6 ± 5.00.1183412.9 ± 6.03026.7 ± 8.10.0904017.7 ± 6.42418.8 ± 8.60.659 Non-high-risk845.0 ± 18.8475.0 ± 21.7425.0 ± 21.7a0.328333.3 ± 27.2560.0 ± 21.90.922553.3 ± 24.8333.3 ± 27.20.649 High-risk5614.5 ± 4.9205415.1 ± 5.10.3403111.1 ± 5.92520.0 ± 8.00.0973512.5 ± 5.82119.1 ± 8.6a0.452 BS/STS7415.3 ± 4.71714.7 ± 9.25716.2 ± 5.30.7674819.6 ± 6.7267.1 ± 5.20.109467.2 ± 4.02829.2 ± 10.20.002 OSA2130.0 ± 10.9301832.4 ± 11.30.7271835.6 ± 12.3300.300119.1 ± 8.71060.0 ± 15.50.028 ESFT200601400.7361001000.251130700.366 RMS1618.8 ± 9.8633.3 ± 19.31010.0 ± 9.5a0.2051010.0 ± 9.5a633.3 ± 19.30.1261315.4 ± 10.0333.3 ± 27.20.220 NRSTS1713.5 ± 11.0a201515.2 ± 12.4a0.0881024.0 ± 18.9a700.02790825.0 ± 19.8a0.046 WT1265.6 ± 14.0475.0 ± 21.7860.0 ± 18.20.763475.0 ± 21.7860.0 ± 18.20.695408100<0.001 RB1578.3 ± 11.21382.5 ± 11.3250.0 ± 35.40.1781578.3 ± 11.20--872.9 ± 16.5785.7 ± 13.20.594 Other tumors3222.9 ± 7.8933.3 ± 15.72318.3 ± 8.80.6472818.4 ± 7.9450.0 ± 25.00.695169.4 ± 8.21635.7 ± 12.40.027 HB540.0 ± 21.910450.0 ± 25.00.351540.0 ± 21.90--20366.7 ± 27.20.039 EC-GCT812.5 ± 11.7a333.3 ± 27.2a500.4327011000.10930520.0 ± 17.9a0.004 Rare tumors1922.1 ± 10.5540.0 ± 21.91414.3 ± 11.80.4331618.8 ± 11.2333.3 ± 27.20.7391113.6 ± 11.8833.3 ± 18.00.445 OS = overall survival, R/P = relapse/progression, MB = medulloblastoma, ATRT = atypical teratoid/rhabdoid tumor, PNET = primitive neuroectodermal tumor, HGG = high-grade glioma, AE = anaplastic ependymoma, IC-GCT = intracranial germ cell tumor, NB = neuroblastoma, BS/STS = bone and soft tissue sarcoma, OSA = osteosarcoma, ESFT = Ewing sarcoma family of tumors, RMS = rhabdomyosarcoma, NRSTS = non-rhabdomyomatous soft tissue sarcoma, WT = Wilms tumor, RB = retinoblastoma, HB = hepatoblastoma, EC-GCT = extracranial germ cell tumor. aThe longest follow-up duration of survivors was less than 10 years.
9/15 https://jkms.org https://doi.org/10.3346/jkms.2018.33.e260
0 2 4 6 8 10 12 14 16 18 20
0 100
80
60
40
20
Survival, %
Years from first relapse/progression A
0 2 4 6 8 10 12 14 16 18 20
0 100
80
60
40
20
PFS, %
Years from first relapse/progression B
OS (n = 61) PFS (n = 61)
P = 0.021 MB (n = 23) ATRT (n = 5) PNET (n = 4)
HGG (n = 10) AE (n = 10) IC-GCT (n = 9)
OS (n = 64) PFS (n = 64)
0 2 4 6 8 10 12 14 16 18 20
0 100
80
60
40
20
Survival, %
Years from first relapse/progression C
0 2 4 6 8 10 12 14 16 18 20
0 100
80
60
40
20
PFS, %
Years from first relapse/progression D
P < 0.001
Initially non-high-risk (n = 8) Initially high-risk (n = 56)
OS (n = 74) PFS (n = 74)
OSA (n = 21) ESFT (n = 20) RMS (n = 16) NRSTS (n = 17) P = 0.023
HB (n = 5) EC-GCT (n = 8) Others (n = 19) P = 0.245
0 2 4 6 8 10 12 14 16 18 20
0 100
80
60
40
20
Survival, %
Years from first relapse/progression E
0 2 4 6 8 10 12 14 16 18 20
0 100
80
60
40
20
PFS, %
Years from first relapse/progression F
OS (n = 12) PFS (n = 12)
OS (n = 15) PFS (n = 15)
0 2 4 6 8 10 12 14 16 18 20
0 100
80
60
40
20
Survival, %
Years from first relapse/progression G
0 2 4 6 8 10 12 14 16 18 20
0 100
80
60
40
20
Survival, %
Years from first relapse/progression H
OS (n = 32) PFS (n = 32)
0 2 4 6 8 10 12 14 16 18 20
0 100
80
60
40
20
Survival, %
I
0 2 4 6 8 10 12 14 16 18 20
0 100
80
60
40
20
PFS, %
J
Fig. 3. Survival rates according to histologic diagnosis. (A) OS and PFS in patients with brain tumors. (B) PFS according to the histologic diagnosis in patients with brain tumors. (C) OS and PFS in patients with neuroblastomas. (D) PFS according to the initial risk in patients with neuroblastomas. (E) OS and PFS in patients with bone and soft tissue sarcomas. (F) PFS according to the histologic diagnosis in patients with bone and soft tissue sarcomas. (G) OS and PFS in patients with Wilms tumor. (H) OS and PFS in patients with retinoblastoma. (I) OS and PFS in patients with other tumors. (J) PFS according to the histologic diagnosis in patients with other tumors.
OS = overall survival, PFS = progression-free survival, MB = medulloblastoma, HGG = high-grade glioma, ATRT = atypical teratoid/rhabdoid tumor, AE = anaplastic ependymoma, PNET = primitive neuroectodermal tumor, IC-GCT = intracranial germ cell tumor, OSA = osteosarcoma, ESFT = Ewing sarcoma family of tumor, RMS = rhabdomyosarcoma, NRSTS = non-rhabdomyomatous soft tissue sarcoma, HB = hepatoblastoma, EC-GCT = extracranial germ cell tumor.
(continued to the next page)
Outcomes according to treatment after relapse/progression
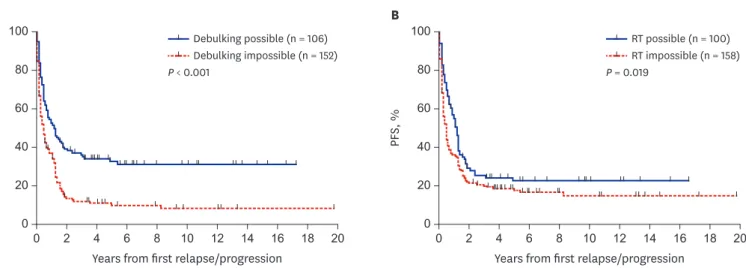
Outcomes according to the type of salvage treatment provided after relapse/progression were analyzed. The PFS and OS of the 106 patients who underwent debulking surgeries were higher than those who did not (10-year PFS: 31.6% ± 4.7% vs. 8.8% ± 2.7%, P < 0.001, Fig. 4A; 10-year OS: 38.7% ± 5.3% vs. 14.5% ± 3.2%, P < 0.001). Surgery was a significant prognostic factor for PFS in patients with anaplastic ependymoma, osteosarcoma, Wilms tumor, or hepatoblastoma (Table 2). Surgery was also a significant prognostic factor for OS in patients with medulloblastoma, osteosarcoma, NRSTS, Wilms tumor, hepatoblastoma, or extracranial germ cell tumors (Table 3). The PFS of the 100 patients who received RT after the first relapse/progression was higher than that of patients who did not (10-year PFS:
23.0% ± 4.5% vs. 15.3% ± 3.2%, P = 0.019, Fig. 4B). However, there was no difference in OS between groups (10-year OS: 24.8% ± 4.7% vs. 24.3% ± 3.8%, P = 0.942). RT was a significant prognostic factor for PFS in patients with atypical teratoid/rhabdoid tumor or high-risk Outcomes of Relapsed Solid Tumors in Children
0 2 4 6 8 10 12 14 16 18 20
0 80
60
40
20
Survival, %
Years from first relapse/progression
0 2 4 6 8 10 12 14 16 18 20
0 80
60
40
20
PFS, %
Years from first relapse/progression PFS (n = 61)
P = 0.021 ATRT (n = 5) PNET (n = 4)
AE (n = 10) IC-GCT (n = 9)
OS (n = 64) PFS (n = 64)
0 2 4 6 8 10 12 14 16 18 20
0 100
80
60
40
20
Survival, %
Years from first relapse/progression C
0 2 4 6 8 10 12 14 16 18 20
0 100
80
60
40
20
PFS, %
Years from first relapse/progression D
P < 0.001
Initially non-high-risk (n = 8) Initially high-risk (n = 56)
OS (n = 74) PFS (n = 74)
OSA (n = 21) ESFT (n = 20) RMS (n = 16) NRSTS (n = 17) P = 0.023
HB (n = 5) EC-GCT (n = 8) Others (n = 19) P = 0.245
0 2 4 6 8 10 12 14 16 18 20
0 100
80
60
40
20
Survival, %
Years from first relapse/progression E
0 2 4 6 8 10 12 14 16 18 20
0 100
80
60
40
20
PFS, %
Years from first relapse/progression F
OS (n = 12) PFS (n = 12)
OS (n = 15) PFS (n = 15)
0 2 4 6 8 10 12 14 16 18 20
0 100
80
60
40
20
Survival, %
Years from first relapse/progression G
0 2 4 6 8 10 12 14 16 18 20
0 100
80
60
40
20
Survival, %
Years from first relapse/progression H
OS (n = 32) PFS (n = 32)
0 2 4 6 8 10 12 14 16 18 20
0 100
80
60
40
20
Survival, %
Years from first relapse/progression I
0 2 4 6 8 10 12 14 16 18 20
0 100
80
60
40
20
PFS, %
Years from first relapse/progression J
Fig. 3. (Continued) Survival rates according to histologic diagnosis. (A) OS and PFS in patients with brain tumors. (B) PFS according to the histologic diagnosis in patients with brain tumors. (C) OS and PFS in patients with neuroblastomas. (D) PFS according to the initial risk in patients with neuroblastomas. (E) OS and PFS in patients with bone and soft tissue sarcomas. (F) PFS according to the histologic diagnosis in patients with bone and soft tissue sarcomas. (G) OS and PFS in patients with Wilms tumor. (H) OS and PFS in patients with retinoblastoma. (I) OS and PFS in patients with other tumors. (J) PFS according to the histologic diagnosis in patients with other tumors.
OS = overall survival, PFS = progression-free survival, MB = medulloblastoma, HGG = high-grade glioma, ATRT = atypical teratoid/rhabdoid tumor, AE = anaplastic ependymoma, PNET = primitive neuroectodermal tumor, IC-GCT = intracranial germ cell tumor, OSA = osteosarcoma, ESFT = Ewing sarcoma family of tumor, RMS = rhabdomyosarcoma, NRSTS = non-rhabdomyomatous soft tissue sarcoma, HB = hepatoblastoma, EC-GCT = extracranial germ cell tumor.
neuroblastoma (Table 2). RT was also a significant prognostic factor for OS in patients with atypical teratoid/rhabdoid tumor or NRSTS (Table 3).
Outcomes after HDCT/auto-SCT and allo-SCT
The 10-year PFS and OS from SCT in 115 patients who underwent SCT were 20.2% ± 5.7%
and 24.3% ± 6.1%, respectively. The 10-year PFS from HDCT/auto-SCT (n = 76) and allo-SCT (n = 44) were 30.9% ± 5.8% and 16.1% ± 6.8%, respectively. The 10-year OS from HDCT/
auto-SCT and allo-SCT were 34.8% ± 5.8% and 14.4% ± 5.8%, respectively (Fig. 5A). Patients who were in CR/PR before SCT showed higher survival than those who were in SD/PD (10-year PFS: 52.1% ± 7.6% vs. 6.7% ± 3.7%, P < 0.001; 10-year OS: 54.8% ± 7.0% vs. 7.0% ± 3.5%, P < 0.001, Fig. 5B). When the data were analyzed separately according to the type of SCT, tumor status before SCT was important for both types of SCT. Patients in CR/PR before HDCT/auto-SCT showed higher survival than those in SD/PD (10-year PFS: 62.7% ± 9.2% vs.
8.5% ± 4.6%, P < 0.001; 10-year OS: 66.5% ± 8.2% vs. 7.3% ± 4.5%, P < 0.001). Patients in CR/PR before allo-SCT also showed higher survival than those in SD/PD (10-year PFS: 31.3%
± 11.6% vs. 0.0%, P = 0.256; 10-year OS: 31.6% ± 10.7% vs. 4.4% ± 4.3%, P = 0.024).
0 2 4 6 8 10 12 14 16 18 20
0 100
80
60
40
20
OS, %
Years from SCT
Auto-SCT (n = 76) Allo-SCT (n = 44)
A
0 2 4 6 8 10 12 14 16 18 20
0 100
80
60
40
20
OS, %
Years from SCT
CR or PR (n = 51)
< PR (n = 64) P < 0.001
B
Fig. 5. Survival rates in patients who underwent SCT. (A) OS according to the type of SCT. (B) OS to the tumor status before SCT.
SCT = stem cell transplantation, OS = overall survival, auto-SCT = autologous stem cell transplantation, allo-SCT = allogeneic stem cell transplantation, CR = complete response, PR = partial response.
0 2 4 6 8 10 12 14 16 18 20
0 100
80
60
40
20
PFS, %
Years from first relapse/progression Debulking possible (n = 106) Debulking impossible (n = 152)
A
0 2 4 6 8 10 12 14 16 18 20
0 100
80
60
40
20
PFS, %
Years from first relapse/progression RT possible (n = 100) RT impossible (n = 158) P = 0.019
P < 0.001
B
Fig. 4. Survival rates according to the treatment after relapse/progression. (A) PFS according to the result of surgery. (B) PFS according to the RT.
PFS = progression-free survival, RT = radiotherapy.