Sleep Duration and Glycemic Control in Patients with Diabetes Mellitus: Korea National Health and Nutrition Examination Survey 2007-2010
Short sleep duration has been reported to increase the risk of diabetes. However, the influence of sleep duration on glycemic control in diabetic patients has not been clarified.
In this study we evaluated the association between sleep duration and glycemic control in diabetic patients. We analyzed the data from the Korea National Health and Nutrition Examination Survey (KNHANES) 2007-2010. Sleep duration was classified into five groups:
< 6, 6, 7, 8, and ≥ 9 h/day. Fasting blood glucose and HbA1c showed a U-shaped trend according to sleep duration. Sleep duration of 7 h/day had the lowest HbA1c (7.26%) among the subjects (P = 0.026). In the older age group ( ≥ 65 yr), a sleep duration of 6 h/
day was associated with the lowest HbA1c (7.26%). The adjusted odds ratio (OR) with a 95% confidence interval (CI) of worse glycemic control (HbA1c ≥ 7.0%) in group of sleep duration of ≥ 9 h/day was 1.48 (1.04-2.13) compared with the group of 7 h/day. This relationship disappeared after adjusting duration of diabetes (OR, 1.38; 95% CI, 0.93- 2.03). Our results suggest that sleep duration and glycemic control in diabetic patients has U-shaped relationship which was mainly affected by duration of diabetes.
Key Words: Sleep; Diabetes Mellitus; Insulin Resistance Bu Kyung Kim,1* Bong Sun Kim,2*
So-Yeon An,2 Min Suk Lee,2 Yong Jun Choi,2 Seung Jin Han,2 Yoon-sok Chung,2,3 Kwan-Woo Lee,2 and Dae Jung Kim2,3
1Department of Internal Medicine, Kosin University College of Medicine, Busan; 2Department of Endocrinology and Metabolism, 3Institute on Aging, Ajou University School of Medicine, Suwon, Korea
*Bu Kyung Kim and Bong Sun Kim contributed equally to this work.
Received: 15 February 2013 Accepted: 18 July 2013 Address for Correspondence:
Dae Jung Kim, MD
Department of Endocrinology and Metabolism, Ajou University School of Medicine, Worldcup-ro 164, Yeongtong-gu, Suwon 443-721, Korea
Tel: +82.31-219-4491, Fax: +82.31-219-4497 E-mail: [email protected]
This study was supported by a grant from the Korea Health 21 R&D Project, Ministry of Health & Welfare, Republic of Korea (A102065-1011-1070100).
http://dx.doi.org/10.3346/jkms.2013.28.9.1334 • J Korean Med Sci 2013; 28: 1334-1339 Endocrinology, Nutrition & Metabolism
INTRODUCTION
Diabetes mellitus (DM) has become a major health problem globally. According to the International Diabetes Federation, diabetes affected 366 million people worldwide in 2011 (1). In Korea, the prevalence of diabetes increased six to sevenfold over the past 40 yr (2, 3). Diabetes is a major risk factor for car- diovascular disease, which is the leading cause of death in peo- ple with diabetes (4). Glucose control is a key factor in prevent- ing a cardiovascular event in diabetic patients.
Short sleep duration has recently been recognized as a po- tentially important factor contributing to the increasing preva- lence of type 2 diabetes mellitus. Several cross-sectional studies have suggested an association between short sleep duration and diabetes and obesity (5-7). In prospective studies, short sleep duration was associated with an approximately 47%-57%
increase in the risk of a diabetes diagnosis over a 10-yr period (8, 9).
However, few studies regarding the influence of sleep dura-
tion on glycemic control in diabetic patients are currently avail- able (10, 11). Here we evaluated the association between self- reported sleep duration and glycemic control in Korean diabet- ic patients using data from the Korea National Health and Nu- trition Examination Survey (KNHANES) 2007-2010.
MATERIALS AND METHODS Study population
The study data consisted of the fourth and part of the fifth KNH- ANES 2007-2010. The KNHANES has been conducted by the Ministry of Health and Welfare of the Korean Government since 1998 to assess the general health and nutritional status of Kore- ans. The fourth KNHANES was conducted from 2007 to 2009 and the fifth from 2010 to 2012. A total of 33,829 individuals aged
> 1 yr responded to the health questionnaire. Of the 33,829 ini- tial respondents, diabetic patients aged > 20 yr were 2,174 (280 in 2007; 600 in 2008; 705 in 2009; and 589 in 2010). Finally, 2,134 diabetic patients who reported their sleep duration were includ-
ed in the present study. A subject was considered as having dia- betes mellitus if fasting blood glucose was ≥ 126 mg/dL or if the subject was taking oral hypoglycemic agents or insulin.
Sleep duration and insulin resistance
Sleep duration was obtained from the self-reported question- naire from the question ‘How much on average do you sleep each day?’ We classified sleep duration into five groups: < 6, 6, 7, 8, and ≥ 9 h/day. Insulin resistance was defined by the ho- meostasis model assessment for insulin resistance (HOMA-IR).
HOMA-IR was calculated by dividing the product of fasting blood glucose (mg/dL) and fasting plasma insulin (mU/L) by 405 (12). HOMA-IR was obtained from the patients who never used insulin.
Other variables
The following covariates were obtained using a standardized questionnaire in the KNHANES: age, educational level, marital status, residential area, household income, alcohol intake, smok- ing status, physical activity level, and hypertension. We divided educational level into three groups: ≤ 6 yr, 7-12 yr, and > 12 yr of education. Marital status was divided into three groups: sin- gle, married and living together, or divorced or separated. Resi- dential area was divided into rural areas and small, medium, or large cities. Average monthly household income was divided into four groups: ≤ 1,000, 2,000, and ≥ 3,001 (thousand KRW).
Current alcohol consumption, current smoking, and regular physical activity were divided as yes or no. Hypertension was defined as systolic ≥ 140 mmHg or diastolic blood pressure
≥ 90 mmHg, or the use of anti-hypertensive medications. Treat- ment status was divided into three groups: insulin with or with- out oral hypoglycemic agents (OHA), OHA only or no medica- tion. Durations of DM were obtained through patients’ age mi- nus the age of diagnosed with DM. Daily calorie intake were calculated from daily intake of respective food group obtained by nutritional questionnaire.
Statistical analysis
Among the five sleep duration groups, continuous variables were compared using ANOVA and categorical variables were compared by the chi-squared-test. Because the American Dia- betes Association (ADA) recommends a HbA1c < 7% (< 53 mM/M) as a good glycemic control goal we defined worse gly- cemic control as a HbA1c ≥ 7%. Multivariable logistic regres- sion was used to calculate the odds ratio (OR) with a 95% confi- dence interval (CI) of worse glycemic control across the sleep duration groups. Sub jects sleeping 7 h/day were used as refer- ence. The analysis was adjusted for potential confounders in the following steps: 1) study year, age, and sex; 2) education level, marital status, residential area, and monthly household income, in addition to the variables in step 1; 3) current alcohol
consumption, current smoking, and regular physical activity and hypertension in addition to the variables in step 2; 4) waist circumference (WC) and body mass index (BMI) in addition to all the variables in step 3; and 5) treatment status, duration of DM and daily calorie intake in addition to all the variables in step 4. We compared HOMA-IR of the patients sleeping 7 h/day with those sleeping the shortest (< 6 h/day) and longest (≥ 9 h/
day) amount of time using Student’s t-test. All analyses were performed with the SPSS version 20 (SPSS, Chicago, IL, USA). A P value < 0.05 was considered to indicate statistical significance.
Ethics statement
KN HANES was approved by institutional review board of Korea Centers for Disease Control and Prevention (Approval Number:
2007-02-CON-04-P, 2008-04EXP-01-C, 2009-01CON-03-2C, 2010- 02CON-21-C). Informed consent was waived by the board.
RESULTS
Baseline characteristics
Of the total of 2,134 diabetic patients (mean age 61.7 ± 12.3 yr), 1,065 were male and 1,069 were female. The mean sleep dura- tion was 6.81 ± 1.3 h/day. Shortest or longest sleep duration groups are more likely to be lower socioeconomic status and treated with insulin. Education, marital status, household in- come and durations of DM also showed a U-shaped trend ac- cording to sleep duration. Baseline characteristics are summa- rized in Table 1.
Glycemic levels according to sleep duration
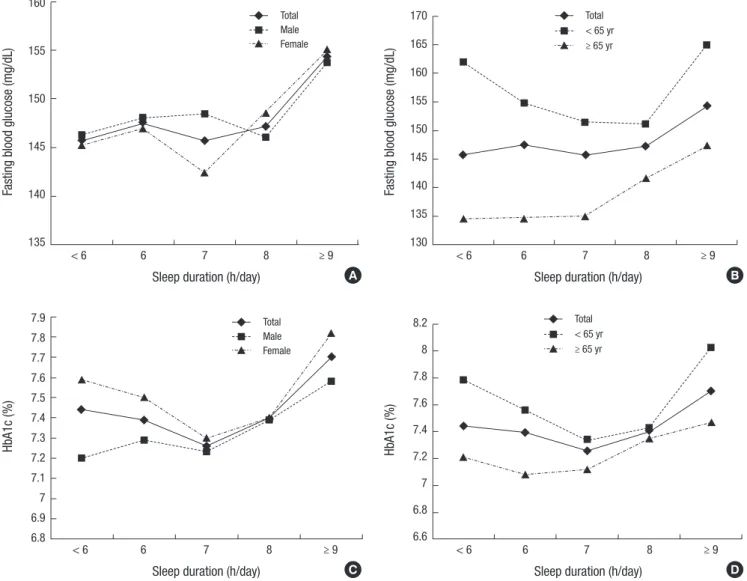
Fig. 1 shows glycemic level according to sleep duration by sex and age. Fasting blood glucose levels did not show a U-shaped trend according to sleep duration. Glucose levels in subjects younger than 65 yr (Fig. 1B) were U-shaped. HbA1c levels were U-shaped, with subjects sleeping 7 h/day having the lowest HbA1c (7.26%) levels (P = 0.026). A shorter or longer than 7 h/
day sleep duration was associated with higher mean HbA1c levels. The U-shaped trend was stronger in females (Fig. 1C) and in the younger age group (< 65 yr) (Fig. 1D). In males, the shortest sleep duration group (< 6 h/day) had the lowest HbA1c level (7.2%) (Fig. 1C). In the older age group (≥ 65 yr), the low- est HbA1c level (7.08%) was in the 6 h/day sleep duration group (Fig. 1D), which was not statistically significant (P = 0.097).
Association between sleep duration and high HbA1c levels In total subjects, after adjusting for study year, age, sex (step 1), socioeconomic status (step 2), lifestyle factors and hyperten- sion (step 3), a shorter sleep duration increased the risk of worse glycemic control (OR, 1.23; 95% CI, 0.93-1.62) compared with a 7 h/day sleep duration, but not statistically significant. Howev- er, a longer sleep duration significantly increased the risk of
worse glycemic control (OR, 1.47; 95% CI, 1.03-2.10). On the other hand, in females and younger age group, the association between sleep duration and worse glycemic control was stron- gest for the shortest sleep duration (OR, 1.53; 95% CI, 1.05-2.25;
OR, 1.54; 95% CI, 1.04-2.27, respectively). After further adjusted BMI and WC (step 4) the association for the shortest sleep du- ration attenuated (OR, 1.47; 95% CI, 1.00-2.17; OR, 1.47; 95% CI, 0.99-2.12, respectively). The association between sleep duration and worse glycemic control disappeared after adjusting treat- ment status, duration of diabetes, and daily calorie intake. In the regression model step 5, duration of DM was only signifi- cant factor in total subjects, female and younger age group (OR, 1.06; 95% CI, 1.04-1.08; OR, 1.08; 95% CI, 1.05-1.11; OR, 1.11;
95% CI,1.08-1.15, respectively) (Table 2).
Insulin resistance according to sleep duration
HOMA-IR levels according to sleep duration are shown in Fig. 2.
These also exhibited a U-shaped trend. HOMA-IR levels in the longest sleep duration group were significantly higher than in the 7 h/day sleep duration group (P < 0.05).
DISCUSSION
The present study is the first to report that sleep duration is as- sociated with glycemic control. The association between sleep duration and glycemic control status showed a U-shaped trend.
This trend was stronger in females and subjects younger than 65 yr. A U-shaped association has been reported between sleep duration and hyperglycemia in obese adolescents (13) and Jap- anese diabetic patients (10). In addition, U-shaped relation- Table 1. Characteristics of 2,134 Korean adults with diabetes according to self-reported sleep duration
Characteristics
Sleep duration (h/day)
P value
< 6 n = 455 (% of column)
6 n = 461 (% of column)
7 n = 521 (% of column)
8 n = 479 (% of column)
≥ 9 n = 218 (% of column)
FBG (mg/dL), mean ± s.d 145.3 ± 50.6 147.5 ± 46.6 145.6 ± 46.9 147.2 ± 46.3 154.4 ± 62.6 0.279
HbA1c (%), mean ± s.d 7.44 ± 1.6 7.39 ± 1.6 7.26 ± 1.5 7.40 ± 1.5 7.70 ± 1.8 0.026
BMI (kg/m2), mean ± s.d 25.0 ± 3.5 25.2 ± 3.4 25.3 ± 3.5 25.1 ± 3.3 25.0 ± 3.6 0.627
WC (cm), mean ± s.d 87.9 ± 9.5 87.7 ± 9.8 88.0 ± 8.8 87.9 ± 8.9 87.8 ± 9.6 0.977
Age (yr), mean ± s.d 65.3 ± 11.0 59.1 ± 12.0 58.8 ± 12.2 61.3 ± 11.8 66.2 ± 12.4 < 0.001
Sex Men
Women 180 (39.6)
275 (60.4) 238 (51.6)
223 (48.4) 278 (53.4)
243 (46.6) 263 (54.9)
216 (45.1) 106 (48.6) 112 (51.4)
< 0.001
Education
≤ 6 yr 7-12 yr
≥ 13 yr
297 (65.6) 124 (27.4) 32 (7.1)
176 (38.3) 195 (42.4) 89 (19.3)
227 (43.7) 215 (41.4) 77 (14.8)
215 (45.0) 219 (45.8) 44 (9.2)
147 (68.7) 55 (25.7) 12 (5.6)
< 0.001
Marital status Never married Current married Divorced/separated
7 (1.5) 295 (65.0) 152 (33.5)
5 (1.1) 358 (78.2)
95 (20.7)
11 (2.1) 416 (80.0)
93 (17.9)
14 (2.9) 375 (78.6)
88 (18.4)
5 (2.3) 161 (73.9)
52 (23.9)
< 0.001
Residence Large city Small-medium city Rural area
202 (44.4) 135 (29.7) 118 (25.9)
214 (46.4) 143 (31.0) 104 (22.6)
203 (39.0) 180 (34.5) 138 (26.5)
183 (38.2) 134 (28.0) 162 (33.8)
61 (28.0) 63 (28.9) 94 (43.1)
< 0.001
Household income (thousand KRW)
≤ 1,000 1.001-2,000 2,001-3,000
≥ 3,001
219 (49.9) 90 (20.5) 54 (17.4) 76 (17.3)
148 (33.3) 106 (23.9) 74 (16.7) 116 (26.1)
174 (34.0) 120 (23.4) 86 (16.8) 132 (25.8)
190 (40.5) 107 (22.8) 66 (14.1) 106 (22.6)
123 (58.0) 32 (15.1) 30 (14.2) 27(12.7)
< 0.001
Current alcohol use 221 (48.6) 281 (61.0) 328 (63.0) 279 (58.2) 107 (49.1) < 0.001
Current smoking 81 (17.8) 99 (21.5) 111 (21.3) 98 (20.5) 39 (17.9) 0.523
Regular physical activity 127 (27.9) 175 (38.0) 209 (40.1) 182 (38.0) 70 (32.1) 0.001
Hypertension 256 (56.3) 231 (50.1) 267 (51.3) 250 (52.3) 126 (57.8) 0.187
Treatment status
Insulin with or without OHA OHA only
No medication
32 (7.0) 310 (68.1) 113 (24.8)
31 (6.7) 257 (55.7) 173 (37.5)
29 (5.6) 318 (61.0) 174 (33.4)
35 (7.3) 298 (62.2) 146 (30.5)
22 (10.1) 143 (65.6) 53 (24.3)
< 0.001
Duration of DM (yr), mean ± s.d 11.7 ± 8.6 9.5 ± 7.2 9.9 ± 7.6 10.7 ± 8.0 11.9 ± 8.4 0.001
Daily calorie intake (kcal), mean ± s.d 1590.4 ± 666.8 1812.5 ± 810.2 1861.9 ± 782.4 1815.7 ± 859.9 1607.5 ± 642.8 < 0.001
HOMA-IR, mean ± s.d 4.97 ± 6.8 4.50 ± 3.9 4.57 ± 3.8 4.91 ± 6.0 5.11 ± 6.0 0.484
FBG, fasting blood glucose; BMI, body mass index; KRW, Korean won; OHA, oral hypoglycemic agents; DM, diabetes mellitus; HOMA-IR, homeostasis model assessment for in- sulin resistance.
ships between sleep duration and metabolic syndrome (14), diabetes (15, 16) and even mortality have been reported (17).
The U-shaped relationship between sleep duration and gly- cemic control may be explained by insulin resistance. Sleep du- ration also had a U-shaped relationship with HOMA-IR levels.
Javaheri et al. (18) reported adolescents with shorter and longer sleep durations had HOMA-IR levels that were on average 20%
higher than in adolescents with average sleep duration.
In this study, after adjusting for waist circumference, the rela- tionship with shorter sleep duration was attenuated, however, the association with longer sleep duration was unchanged. There- fore, the association between shorter sleep duration and HOMA- IR levels was mediated primarily through the association be- tween shorter sleep duration and central obesity. Conversely, the association between longer sleep duration and HOMA-IR levels seemed to be through pathways independent of obesity.
Interestingly, after adjusting duration of DM, the relationship between sleep duration and worse glycemic control disappear-
ed. The long duration of DM could be more likely to have co- morbidities and these comorbidities may be a cause of shorter or longer sleep and also worse glycemic control (19, 20). When we selected subgroup of DM duration less than 5 yr, which might have no diabetic complications such as neuropathy, there was no association between sleep duration and glycemic control.
Therefore, we can suggest that patients with painful diabetic neuropathy have anxiety, depression, and sleep disturbance and these comorbidities cause worse glycemic control (21).
Short sleep duration has been suggested to be associated with metabolic syndrome and obesity. Sleep deprivation has been shown to alter the neuroendocrine control of appetite, and reduce leptin and increase ghrelin levels (22). These hor- monal changes could lead to weight gain and secondary insulin resistance. Short sleep duration was also shown to increase counter-regulatory hormones such as cortisol and sympathetic nervous system activity, both of which can contribute to insulin resistance (23).
Fig. 1. Glycemic levels according to sleep duration by sex and age. (A) Fasting blood glucose levels according to sleep duration by sex. (B) Fasting blood glucose levels accord- ing to sleep duration by age. (C) HbA1c levels according to sleep duration by sex. (D) HbA1c levels according to sleep duration by age.
Fasting blood glucose (mg/dL)
Sleep duration (h/day)
< 6 6 7 8 ≥ 9
160
155
150
145
140
135
A
Fasting blood glucose (mg/dL)
Sleep duration (h/day)
< 6 6 7 8 ≥ 9
170 165 160 155 150 145 140 135 130
Total
< 65 yr
≥ 65 yr
B
HbA1c (%)
Sleep duration (h/day)
< 6 6 7 8 ≥ 9
7.9 7.8 7.7 7.6 7.5 7.4 7.3 7.2 7.1 7 6.9 6.8
C
HbA1c (%)
Sleep duration (h/day)
< 6 6 7 8 ≥ 9
8.2 8 7.8 7.6 7.4 7.2 7 6.8 6.6
D Total
< 65 yr
≥ 65 yr Total
Male Female
Total Male Female
The mechanism underlying the association between long sleep duration and insulin resistance remains unclear. Long sleep duration has been hypothesized to indicate various un- measured health and psychiatric problems (24). Long sleep duration is reportedly associated with a low level of physical ac- tivity and low socioeconomic status (25, 26). In the present study, a greater proportion of patients with long sleep duration (> 9 h/
day) had a stroke (11.0%) than patients with short sleep dura- tion (7 h: 5.2%, < 6 h: 6.2%, respectively). Another possible mech- anism of the association between long sleep duration and insu- lin resistance is alteration of levels of proinflammatory cytokines such as C-reactive protein (CRP) and interleukin-6 (IL-6) by habitual long sleep duration, which could affect glucose me- tabolism (27). Alternatively, longer sleep duration influenced cerebral and systemic glucose use (28) and the effects of coun- ter-regulatory hormones released during sleep (29).
Our data indicate that the U-shaped trend between sleep du- ration and glycemic level is stronger in females and younger subjects. Males with sleep duration longer than 7 h/day had higher HbA1c levels, and subjects with sleep duration shorter than 7 h/day had lower HbA1c levels. In males, sleep duration and insulin resistance could be affected by occupational physi- cal activity. A previous study of the interaction between physi- cal activity and sleep duration supports this hypothesis. The combination of low physical activity and short sleep duration had a more than twofold higher OR for insulin resistance, com- pared to the combination of high physical activity and short sleep duration. Subjects with high physical activity and short sleep duration had lower insulin resistance than subjects with low physical activity and appropriate sleep duration. Moreover, that study used occupational physical activity rather than exer- cise-related physical activity (30). In our study, more patients with a short sleep duration had simple labor occupations (11.2%) than those patients with a 7 h/day sleep duration (8.0%) and with a long sleep duration (≥ 9 h: 8.7%).
The present study has several limitations. It was a cross-sec- tional design; therefore, causality could not be identified, and the cumulative effect of or temporal change in sleep duration could not be evaluated. Sleep duration was self-reported, thus recall bias may exist.
In conclusion, our data suggest that shorter and longer sleep durations are associated with worse glycemic control and asso- ciated with central obesity and insulin resistance in Korean adults with diabetes. The U-shaped trend was stronger in females and subjects less than 65 yr of age. These trends are mainly associat- ed with duration of DM. Therefore, the association between Table 2. Association between sleep duration and high HbA1c levels in 2,134 Korean adults with diabetes
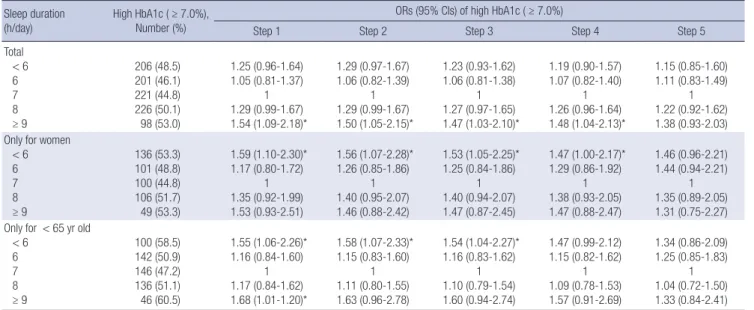
Sleep duration
(h/day) High HbA1c ( ≥ 7.0%), Number (%)
ORs (95% CIs) of high HbA1c ( ≥ 7.0%)
Step 1 Step 2 Step 3 Step 4 Step 5
Total
< 6 6 7 8
≥ 9
206 (48.5) 201 (46.1) 221 (44.8) 226 (50.1) 98 (53.0)
1.25 (0.96-1.64) 1.05 (0.81-1.37)
1 1.29 (0.99-1.67) 1.54 (1.09-2.18)*
1.29 (0.97-1.67) 1.06 (0.82-1.39)
1 1.29 (0.99-1.67) 1.50 (1.05-2.15)*
1.23 (0.93-1.62) 1.06 (0.81-1.38)
1 1.27 (0.97-1.65) 1.47 (1.03-2.10)*
1.19 (0.90-1.57) 1.07 (0.82-1.40)
1 1.26 (0.96-1.64) 1.48 (1.04-2.13)*
1.15 (0.85-1.60) 1.11 (0.83-1.49)
1 1.22 (0.92-1.62) 1.38 (0.93-2.03) Only for women
< 6 6 7 8
≥ 9
136 (53.3) 101 (48.8) 100 (44.8) 106 (51.7) 49 (53.3)
1.59 (1.10-2.30)*
1.17 (0.80-1.72) 1 1.35 (0.92-1.99) 1.53 (0.93-2.51)
1.56 (1.07-2.28)*
1.26 (0.85-1.86) 1 1.40 (0.95-2.07) 1.46 (0.88-2.42)
1.53 (1.05-2.25)*
1.25 (0.84-1.86) 1 1.40 (0.94-2.07) 1.47 (0.87-2.45)
1.47 (1.00-2.17)*
1.29 (0.86-1.92) 1 1.38 (0.93-2.05) 1.47 (0.88-2.47)
1.46 (0.96-2.21) 1.44 (0.94-2.21)
1 1.35 (0.89-2.05) 1.31 (0.75-2.27) Only for < 65 yr old
< 6 6 7 8
≥ 9
100 (58.5) 142 (50.9) 146 (47.2) 136 (51.1) 46 (60.5)
1.55 (1.06-2.26)*
1.16 (0.84-1.60) 1 1.17 (0.84-1.62) 1.68 (1.01-1.20)*
1.58 (1.07-2.33)*
1.15 (0.83-1.60) 1 1.11 (0.80-1.55) 1.63 (0.96-2.78)
1.54 (1.04-2.27)*
1.16 (0.83-1.62) 1 1.10 (0.79-1.54) 1.60 (0.94-2.74)
1.47 (0.99-2.12) 1.15 (0.82-1.62)
1 1.09 (0.78-1.53) 1.57 (0.91-2.69)
1.34 (0.86-2.09) 1.25 (0.85-1.83)
1 1.04 (0.72-1.50) 1.33 (0.84-2.41)
*P value < 0.05. Step 1: adjustment for study year, age, and sex. Step 2: adjustment for education, marital status, residential area, and household income, plus all variables in step 1. Step 3: adjustment for current alcohol use, current smoking, regular physical activity, and hypertension plus all variables in step 2. Step 4: adjustment for BMI and WC plus all variables in step 3. Step 5: adjustment for treatment status, duration of DM and daily calorie intake plus all variables in step 4. CI, confidence interval; OR, odds ratio.
Level of HOMA-IR
Sleep duration (h/day)
< 6 6 7 8 ≥ 9
5.2 5.1 5.0 4.9 4.8 4.7 4.6 4.5 4.4 4.3 4.2
5.0
4.5 4.5
4.9
5.1
Fig. 2. Insulin resistance levels according to sleep duration.
sleep duration and glycemic control might be explained by in- sulin resistance and duration of DM.
DISCLOSURE
All authors declare no relationship that may pose conflicts of interest.
REFERENCES
1. Lam DW, LeRoith D. The worldwide diabetes epidemic. Curr Opin En- docrinol Diabetes Obes 2012; 19: 93-6.
2. Kim DJ. The epidemiology of diabetes in Korea. Diabetes Metab J 2011;
35: 303-8.
3. Kim JH, Kim DJ, Jang HC, Choi SH. Epidemiology of micro- and macro- vascular complications of type 2 diabetes in Korea. Diabetes Metab J 2011;
35: 571-7.
4. Haffner SM. Coronary heart disease in patients with diabetes. N Engl J Med 2000; 342: 1040-2.
5. Gottlieb DJ, Punjabi NM, Newman AB, Resnick HE, Redline S, Baldwin CM, Nieto FJ. Association of sleep time with diabetes mellitus and im- paired glucose tolerance. Arch Intern Med 2005; 165: 863-7.
6. Ko GT, Chan JC, Chan AW, Wong PT, Hui SS, Tong SD, Ng SM, Chow F, Chan CL. Association between sleeping hours, working hours and obesi- ty in Hong Kong Chinese: the ‘better health for better Hong Kong’ health promotion campaign. Int J Obes (Lond) 2007; 31: 254-60.
7. Park SE, Kim HM, Kim DH, Kim J, Cha BS, Kim DJ. The association be- tween sleep duration and general and abdominal obesity in Koreans:
data from the Korean National Health and Nutrition Examination Sur- vey, 2001 and 2005. Obesity (Silver Spring) 2009; 17: 767-71.
8. Ayas NT, White DP, Al-Delaimy WK, Manson JE, Stampfer MJ, Speizer FE, Patel S, Hu FB. A prospective study of self-reported sleep duration and incident diabetes in women. Diabetes Care 2003; 26: 380-4.
9. Gangwisch JE, Heymsfield SB, Boden-Albala B, Buijs RM, Kreier F, Pick- ering TG, Rundle AG, Zammit GK, Malaspina D. Sleep duration as a risk factor for diabetes incidence in a large U.S. sample. Sleep 2007; 30:
1667-73.
10. Ohkuma T, Fujii H, Iwase M, Kikuchi Y, Ogata S, Idewaki Y, Ide H, Doi Y, Hirakawa Y, Nakamura U, et al. Impact of sleep duration on obesity and the glycemic level in patients with type 2 diabetes: the Fukuoka Diabetes Registry. Diabetes Care 2013; 36: 611-7.
11. Trento M, Broglio F, Riganti F, Basile M, Borgo E, Kucich C, Passera P, Tibaldi P, Tomelini M, Cavallo F, et al. Sleep abnormalities in type 2 dia- betes may be associated with glycemic control. Acta Diabetol 2008; 45:
225-9.
12. Matthews DR, Hosker JP, Rudenski AS, Naylor BA, Treacher DF, Turner RC. Homeostasis model assessment: insulin resistance and beta-cell func- tion from fasting plasma glucose and insulin concentrations in man. Di- abetologia 1985; 28: 412-9.
13. Koren D, Levitt Katz LE, Brar PC, Gallagher PR, Berkowitz RI, Brooks LJ.
Sleep architecture and glucose and insulin homeostasis in obese adoles-
cents. Diabetes Care 2011; 34: 2442-7.
14. Choi KM, Lee JS, Park HS, Baik SH, Choi DS, Kim SM. Relationship be- tween sleep duration and the metabolic syndrome: Korean National Health and Nutrition Survey 2001. Int J Obes (Lond) 2008; 32: 1091-7.
15. Chao CY, Wu JS, Yang YC, Shih CC, Wang RH, Lu FH, Chang CJ. Sleep duration is a potential risk factor for newly diagnosed type 2 diabetes mellitus. Metabolism 2011; 60: 799-804.
16. Yaggi HK, Araujo AB, McKinlay JB. Sleep duration as a risk factor for the development of type 2 diabetes. Diabetes Care 2006; 29: 657-61.
17. Cappuccio FP, D’Elia L, Strazzullo P, Miller MA. Sleep duration and all- cause mortality: a systematic review and meta-analysis of prospective studies. Sleep 2010; 33: 585-92.
18. Javaheri S, Storfer-Isser A, Rosen CL, Redline S. Association of short and long sleep durations with insulin sensitivity in adolescents. J Pediatr 2011;
158: 617-23.
19. Tahrani AA, Ali A, Raymond NT, Begum S, Dubb K, Mughal S, Jose B, Piya MK, Barnett AH, Stevens MJ. Obstructive sleep apnea and diabetic neuropathy: a novel association in patients with type 2 diabetes. Am J Respir Crit Care Med 2012; 186: 434-41.
20. Song Y, Ye X, Ye L, Li B, Wang L, Hua Y. Disturbed subjective sleep in Chi- nese females with type 2 diabetes on insulin therapy. PLoS One 2013; 8:
e54951.
21. Russell IJ, Crofford LJ, Leon T, Cappelleri JC, Bushmakin AG, Whalen E, Barrett JA, Sadosky A. The effects of pregabalin on sleep disturbance symp- toms among individuals with fibromyalgia syndrome. Sleep Med 2009;
10: 604-10.
22. Knutson KL, Van Cauter E. Associations between sleep loss and increased risk of obesity and diabetes. Ann N Y Acad Sci 2008; 1129: 287-304.
23. Knutson KL, Spiegel K, Penev P, Van Cauter E. The metabolic consequen- ces of sleep deprivation. Sleep Med Rev 2007; 11: 163-78.
24. Bliwise DL, Young TB. The parable of parabola: what the U-shaped curve can and cannot tell us about sleep. Sleep 2007; 30: 1614-5.
25. Patel SR, Malhotra A, Gottlieb DJ, White DP, Hu FB. Correlates of long sleep duration. Sleep 2006; 29: 881-9.
26. Stranges S, Dorn JM, Shipley MJ, Kandala NB, Trevisan M, Miller MA, Donahue RP, Hovey KM, Ferrie JE, Marmot MG, et al. Correlates of short and long sleep duration: a cross-cultural comparison between the Unit- ed Kingdom and the United States: the Whitehall II Study and the West- ern New York Health Study. Am J Epidemiol 2008; 168: 1353-64.
27. Pradhan AD, Manson JE, Rifai N, Buring JE, Ridker PM. C-reactive pro- tein, interleukin 6, and risk of developing type 2 diabetes mellitus. JAMA 2001; 286: 327-34.
28. Boyle PJ, Scott JC, Krentz AJ, Nagy RJ, Comstock E, Hoffman C. Dimin- ished brain glucose metabolism is a significant determinant for falling rates of systemic glucose utilization during sleep in normal humans. J Clin Invest 1994; 93: 529-35.
29. De la Eva RC, Baur LA, Donaghue KC, Waters KA. Metabolic correlates with obstructive sleep apnea in obese subjects. J Pediatr 2002; 140: 654-9.
30. Zuo H, Shi Z, Yuan B, Dai Y, Hu G, Wu G, Hussain A. Interaction between physical activity and sleep duration in relation to insulin resistance among non-diabetic Chinese adults. BMC Public Health 2012; 12: 247.