ISSN 0378-6471 (Print)⋅ISSN 2092-9374 (Online)
http://dx.doi.org/10.3341/jkos.2016.57.11.1671
Original Article
다양한 단면 두께의 얼굴 전산화단층촬영 사진을 이용하여 측정한 안와용적 비교
Measurement of Orbital Volume from Different Slice Thickness Facial Computed Tomography Scans Using a Semi-automatic Program
김혜지1⋅한지상2⋅박인기3⋅최삼진4⋅신재호1
Hye Jee Kim, MD1, Ji Sang Han, MD2, In Ki Park, MD, PhD3, Sam Jin Choi, PhD4, Jae-Ho Shin, MD, PhD1 경희대학교 의과대학 강동경희대학교병원 안과학교실1, 서남대학교 의과대학 명지병원 안과학교실2,
경희대학교 의과대학 경희대학교병원 안과학교실3, 경희대학교 의과대학 의공학교실4
Department of Ophthalmology, Kyung Hee University Hospital at Gangdong, Kyung Hee University School of Medicine1, Seoul, Korea Department of Ophthalmology, Myongji Hospital, Seonam University College of Medicine2, Goyang, Korea
Department of Ophthalmology, Kyung Hee University Hospital, Kyung Hee University School of Medicine3, Seoul, Korea Department of Bioengineering, Kyung Hee University School of Medicine4, Seoul, Korea
Purpose: To compare the orbital volume calculated from various slice thickness facial computed tomography scans using a semi-automated computer program.
Methods: Axial and coronal scans of 2, 2.5, 3 mm slice thickness facial computed tomography scans were used to measure the orbital volume. The cross-sectional area was determined from each slice using a semi-automated computer program (MATLAB 2009a®, MathWorks, Inc., Natick, MA, USA), and then the volume was calculated from serial reconstruction of the cross sections.
Results: The measured value in the 2 mm images was 33.14 ± 2.37 cm3 in the right orbit and 34.32 ± 2.60 cm3 in the left orbit for the axial scans, and 35.54 ± 3.58 cm3 in the right orbit and 34.96 ± 4.05 cm3 in the left orbit for the coronal scans. In the 2.5 mm images, the values were 33.28 ± 3.35 cm3 in the right orbit and 33.73 ± 4.10 cm3 in the left orbit for the axial scans, and 35.24 ± 3.98 cm3 in the right orbit and 35.10 ± 3.93 cm3 in the left orbit for the coronal scans. In the 3 mm images, the values were 33.23
± 2.70 cm3 in the right orbit and 33.39 ± 2.69 cm3 in the left orbit for the axial scans, and 33.20 ± 3.64 cm3 in the right orbit and 32.95 ± 3.45 cm3 in the left orbit for the coronal scans. In the 3 mm image, there was not a significant difference in the calculated volume between the axial and coronal scans (p3mm = 0.62).
Conclusions: Because there is no difference in the results of the orbital volumetric measurements between three other slice thick- nesses in the axial scan, using axial scan images with a computer program that semi-automatically calculates orbital volume is useful.
In addition, the volume measured by thick slice images has more reproducibility than the volume measured by thin slice images.
J Korean Ophthalmol Soc 2016;57(11):1671-1677
Keywords: Computed tomography (CT) slice thickness, Facial CT, Orbital volume, Volume measurement
■Received: 2016. 8. 11. ■ Revised: 2016. 8. 27.
■Accepted: 2016. 10. 20.
■Address reprint requests to Jae-Ho Shin, MD, PhD
Department of Ophthalmology, Kyung Hee University Hospital at Gangdong, #892 Dongnam-ro, Gangdong-gu, Seoul 05278, Korea
Tel: 82-2-440-6181, Fax: 82-2-440-7756 E-mail: [email protected]
ⓒ2016 The Korean Ophthalmological Society
This is an Open Access article distributed under the terms of the Creative Commons Attribution Non-Commercial License (http://creativecommons.org/licenses/by-nc/3.0/) which permits unrestricted non-commercial use, distribution, and reproduction in any medium, provided the original work is properly cited.
안와는 복잡한 원추 모양으로, 사변을 둘러싸고 있는 뼈 로 구성되어 있고 그 내부에는 안구, 외안근, 신경혈관 조 직, 눈물샘과 안와 지방 등이 있다.1,2 외상에 의한 안와 골 절 시에 안와 용적이 증가하고, 안와 용적이 1 cm3 증가하 면 약 1 mm의 안구 함몰이 발생한다. 안구 함몰은 적절한 시기에 교정하지 못하고 수술이 늦어지면 교정이 어려워진
A
D
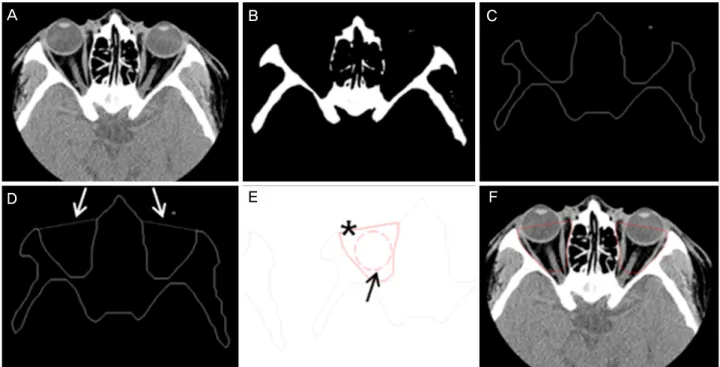
Figure 1. Volume measurement process of the computer program from axial scans images. (A) The original computed tomography
(CT) axial scan image. (B) Simplified the photograph by the algorithm of the computer program. (C) Automatic outlining the bony orbit. (D) The white arrows indicate the straight line drawn by examiner. (E) Black arrow mark the seed points and asterisks (*) in- dicate the automated outlining region. (F) Red solid line in the original CT image indicated the measured region.다.3 하지만 수상 직후 몇 주간은 안와 주변 조직의 부종과 출혈로 안구함몰이 나타나지 않아서 수상 직후에 시행한 안구돌출계(exophthalmometer) 등의 검사로는 추후 발생할 안구 함몰 여부 및 함몰 정도에 대해서 정확히 예측하기는 힘들다.4 수술 전 안와 용적의 측정은 인공 뼈 삽입물의 적 절한 크기 결정에 도움을 주어 안구 함몰 교정 성공률을 높 일 수 있다.5 외안근과 안와 지방의 비대에 의해 안구 돌출 을 보이는 갑상선 눈병증 환자에서 내과적인 치료에 반응하 지 않을 경우 안와 감압술을 시행하며 마찬가지로 수술 전 안와 용적 및 안와 구성물에 대한 정확한 평가가 수술 후 안 구 돌출에 대한 해부학적인 치료 성공률을 높일 수 있다.6
전산화단층촬영 영상을 바탕으로 안와의 용적을 측정하 는 연구가 있었으나 측정 결과가 연구에 따라 큰 차이를 보 이거나 특정 소프트웨어가 필요한 경우가 대부분이다.7-9 새 로운 측정법이 임상에 적용되기 위해서는 쉽게 사용할 수 있고 빠르고 정확하게 재현성 있는 결과를 도출할 수 있어 야 한다.
저자들은 이전 논문10에서 손쉽게 접근이 가능한 프로그 램(MATLAB 2009a®, MathWorks, Inc.,Natick, MA, USA) 으로 고안한 알고리즘을 통해 정상 성인 남녀의 얼굴 전산 화단층촬영 사진으로부터 안와 용적을 측정하여 비교 분석 함으로써 저자들이 고안한 측정 방법의 유용성을 확인한 바 있다. 본 연구에서는 세 가지 단면 두께(2 mm, 2.5 mm,
3 mm)로 촬영한 정상 30대 성인 남자의 얼굴 전산화단층 촬영 사진으로부터 안와 용적을 측정하여 이들의 측정값을 비교함으로써 어떤 단면 두께와 어떤 절단면(section plane) 을 사용하는 것이 적절한지에 대한 평가와 저자들이 고안 한 안와 용적 측정 방법의 임상적 유용성을 확인하고자 하 였다.
대상과 방법
2014년 1월부터 12월까지 서울 내 세 곳의 대학병원을 방문하여 얼굴 전산화단층촬영을 시행한 환자들 중 30대 남자 환자 50명을 대상으로 하였다. 이 중 과거력 혹은 단 면촬영 당시 안와 용적에 영향을 일으킬 수 있는 안와 골절 및 안면부 골절 등의 외상성 질환이 있거나, 안과적 수술 과거력 또는 안와 내부 공간을 침범하는 병변이 있었던 병 력이 있는 자는 대상에서 제외하였다.
얼굴 전산화단층촬영은 2 mm (15명), 2.5 mm (15명), 3 mm (20명) 간격의 단면 두께(section thickness)로 시행하였고, 촬영 사진들 중 축영상(axial scan)과 관상영상(coronal scan) 을 대상으로 저자들의 이전 논문10에서 소개하였던 경희대학 교 의공학교실에서 고안한 컴퓨터 프로그램(MATLAB 2009a®)의 알고리즘을 통해 숙련된 1명의 안과 의사가 안 와 용적을 반자동으로 측정하였다.
B C
E F
A
D
Figure 2. Volume measurement process of the computer program from coronal scans images. (A) The original computed tomog-
raphy (CT) coronal scan image. (B) Simplified the photograph by the algorithm of the computer program. (C) Automatic outlining the bony orbit. (D) The white arrows indicate the straight line drawn by examiner. (E) Black arrow mark the seed points and aster- isks (*) indicate the automated outlining region. (F) Red solid line in the original CT image indicated the measured region.컴퓨터 프로그램(MATLAB 2009a®)에 단층촬영 영상을 입력하면 알고리즘에 의해 얼굴 뼈가 단순화되어 출력되고, 경계의 기준점이 되는 곳을 관찰자가 지정하면 알고리즘에 따라 단면적을 측정하여 단면적의 화소(pixel)값을 구한 후, 이를 통해 부피(voxel)를 계산하여 안와의 용적(cm3)을 도 출하였다. 알고리즘에 대한 자세한 설명은 저자들이 발표 한 이전 논문에 자세히 기술하였다.10
이전 연구와 마찬가지로 축영상 사진은 안와 공간(orbital space)이 보이는 시점부터 아래안와연(inferior orbital rim) 이 보이는 시점까지의 영상을 사용하였고, 관상영상 사진 은 아래안와연의 절반 이상이 보이는 시점부터 시신경관 (optic canal)까지 측정하였다. 축영상에서 안와의 앞쪽 경 계는 안쪽안와연(medial orbital rim)과 가쪽안와연(lateral orbital rim)을 관찰자가 임의로 직선으로 연결하여 측정하 였고(Fig. 1), 관상영상에서 가쪽안와연이 존재하지 않아 뼈 로 경계 짓지 못한 사진도 역시 관찰자가 임의로 직선으로 연결하여 측정하였다(Fig. 2).
본 연구는 후향적 연구로 강동경희대학교병원 임상연구
심사위원회(institutional review board, IRB)의 면제를 받았 다. 통계학적인 분석은 SPSS ver. 18 (SPSS Inc., Chicago, IL, USA)을 사용하였으며 정규성 검정 및 대응표본 t 검정 (paired t-test)을 이용하여 양측의 안와 용적을 비교하고, 축 영상과 관상영상에서 측정한 안와 용적의 촬영 간격에 따 른 상관성을 비교하여 분석하였다.
결 과
얼굴 전산화단층촬영을 시행한 30대 남자 환자 50명 중 제외 기준에 해당하는 과거 안와 골절 기왕력이 있는 6명 과 갑상선 눈병증으로 진단된 4명을 제외한 40명(2 mm 간 격 13명, 2.5 mm 간격 13명, 3 mm 간격 14명)을 대상으로 하였고, 이들의 평균 연령은 33.60 ± 3.40세(range: 30-39) 였다.
안와 용적의 측정 결과, 2.0 mm 단면으로 측정한 얼굴 전산화단층촬영 사진의 축영상(axial scan)에서 우측 33.14
± 2.37 cm3, 좌측 34.32 ± 2.60 cm3, 관상영상(coronal scan)
B C
E F
Table 1. Comparison of the right and left orbit volume (cm
3)2.0 mm thickness 2.5 mm thickness 3.0 mm thickness
Axial Coronal Axial Coronal Axial Coronal
Right orbit 33.14 ± 2.37 35.54 ± 3.58 33.28 ± 3.35 35.24 ± 3.98 33.23 ± 2.70 33.20 ± 3.64 Left orbit 34.32 ± 2.60 34.96 ± 4.05 33.73 ± 4.10 35.10 ± 3.93 33.39 ± 2.69 32.95 ± 3.45
p-value* 0.002 0.189 0.257 0.670 0.527 0.302
Values are presented as mean ± SD unless otherwise indicated.
*Paired t-test.
Table 2. Difference in measured volume (cm
3) between axial and coronal scan2.0 mm thickness 2.5 mm thickness 3.0 mm thickness p-value†
Axial scan 33.73 ± 2.51 33.50 ± 3.67 33.31 ± 2.65 0.87
Coronal scan 35.25 ± 3.76 35.17 ± 3.88 33.08 ± 3.48 0.05
p-value* 0.025 0.013 0.62
Values are presented as mean ± SD unless otherwise indicated.
*Paired t-test; †One way analysis of variance (ANOVA).
Table 3. Measured volume (cm
3) variation of computed tomography (CT) slice thickness (mm)Total CT image group (N)* Average (cm3) Standard deviation
2.0 mm thickness 52 34.49 3.25
2.5 mm thickness 52 34.34 3.83
3.0 mm thickness 56 33.19 3.07
p-value† 0.095
N = Right orbit axial scan image group + Left orbit axial scan image group + Right orbit coronal scan image group + Left orbit coronal scan image group.
*Total CT image group; †One way analysis of variance (ANOVA).
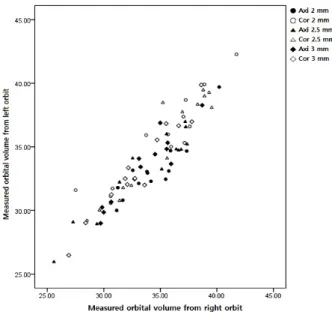
Figure 3. The correlation of measured orbital volume from
right orbit with from left orbit. There is a strong positive cor- relation between measured orbital volume from right orbit and left orbit. The correlation coefficients are +0.9. rAxi 2mm = 0.913, rCor 2mm = 0.965, rAxi 2.5mm = 0.903, rCor 2.5mm = 0.912, rAxi 3mm= 0.984, rCor 3mm = 0.943.
에서 우측 35.54 ± 3.58 cm3, 좌측 34.96 ± 4.05 cm3로 측정 되었다. 2.5 mm 간격으로 측정한 얼굴 전산화단층촬영 사진
의 축영상에서 우측 33.28 ± 3.35 cm3, 좌측 33.73 ± 4.10 cm3, 관상영상에서 우측 35.24 ± 3.98 cm3, 좌측 35.10 ± 3.93 cm3 로 측정되었다. 3.0 mm 간격으로 측정한 얼굴 전산화단층 촬영 사진의 축영상에서 우측 33.23 ± 2.70 cm3, 좌측 33.39
± 2.69 cm3, 관상영상에서 우측 33.20 ± 3.64 cm3, 좌측 32.95 ± 3.45 cm3로 측정되었다. 촬영 간격과 단면 방향에 따라 나눈 여섯 군에서 2 mm 두께로 측정한 축영상을 제외 하고 나머지 다섯 군에서 우측과 좌측의 안구 용적이 모두 통계적으로 유의한 차이가 없었으며(p>0.05) (Table 1), 상관 계수(r, correlation coefficient)는 여섯 군 모두 0.9 이상으로 양측 안와 용적이 높은 상관 관계를 보였다(Fig. 3).
촬영 간격에 따른 측정값의 평균은 2 mm 간격의 축영상 에서 33.73 ± 2.51 cm3, 관상영상에서 35.25 ± 3.76 cm3였 고, 2.5 mm 간격의 축영상에서 33.50 ± 3.67 cm3, 관상영상 에서 35.17 ± 3.88 cm3, 3 mm 간격의 축영상에서 33.31 ± 2.65 cm3, 관상영상에서 33.08 ± 3.48 cm3로 측정되었다.
촬영 간격이 2 mm와 2.5 mm인 축영상과 관상영상 사진으로 부터 각각 측정한 안와 용적 간에는 통계적으로 유의한 차이 가 있었으나(p2mm=0.025, p2.5mm=0.013), 촬영 간격이 3 mm인 축영상과 관상영상 사진으로부터 각각 측정한 안와 용적 간에 통계적으로 유의한 차이를 보이지 않았다(p3mm=0.62) (Table 2). 또한 모든 촬영 두께에서 축영상과 관상영상의
Fixel CT value Slice thickness
Fixel CT value Slice thickness
A B
Figure 4. Diagram of partial volume effect. (A) Pixel computed tomography (CT) value with thick slice. (B) Pixel CT value with
thin slice. The partial volume effect can be defined as the loss of apparent activity in small objects or regions because of the limited resolution of the imaging system.측정값은 통계적으로 유의한 높은 양의 상관 관계를 보였 다(r2mm=+0.523, r2.5mm=+0.650, r3mm=+0.701).
각 촬영 간격에 따른 측정값의 전체 평균은 2 mm 간격 에서 34.39 ± 3.25 cm3, 2.5 mm 간격에서 34.34 ± 3.83 cm3, 3 mm 간격에서 33.19 ± 3.07 cm3로 세 군 간의 통계 적으로 유의한 차이는 없었으며(p=0.095) 평균과 표준편차 는 3 mm 간격 영상에서 가장 작은 값을 보였다(Table 3).
고 찰
영상 기술의 발달과 함께 영상을 통한 다양한 조직의 정 확한 용적 측정이 여러 치료 분야에서 사용되고 있다. 특히 재건 및 성형 수술 시, 조직의 정확한 용적을 평가하는 것 은 수술의 예후를 결정하는 중요한 준비 과정 중 하나이다.
특히 안와와 같이 양쪽의 균형이 고려되어야 하는 조직의 용적 측정은 그 중요성이 더 크다. 안와의 용적 측정은 골 절로 인해 발생한 용적의 차이가 유발하는 안구 함몰을 교 정하는 데 중요한 역할을 하며, 갑상선 눈병증과 같이 안구 돌출의 증상을 보이는 환자에서 안와 용적의 측정은 치료 의 방향 및 치료법을 선택하는 데 크게 기여한다.11-13
다양한 방법의 용적 측정 방식이 연구되어 왔으며 최근에 전산화단층촬영과 자기공영영상을 3차원으로 복원하여 용적 을 측정하는 방법이 많이 소개되었다.11,14 전산화단층촬영에 서 3차원으로 영상을 재구성하는 소프트웨어가 개발됨에 따 라 간편하게 용적을 측정할 수 있는 연구가 있었으나 대부분 소프트웨어에 대한 접근성이 낮은 단점이 있다.15,16
본 연구에서는 저자들의 이전 연구와 마찬가지로 접근이 쉬운 컴퓨터 프로그램(MATLAB 2009a®)으로 고안한 알고 리즘으로 2차원적인 단층촬영 사진을 이용하여 반자동화된 방식으로 안와 용적을 측정하였다. 이 프로그램에 입력된
안와용적 측정 알고리즘은 다음과 같다: (1) 입력된 전산화단 층촬영 사진에서 관심있는 영역의 자동 윤곽 설정(automatic outlining), (2) 관찰자의 추가 경계 설정, (3) 화소(pixel) 값 계산.
위의 알고리즘으로 측정한 2차원 단층 사진의 면적 (pixel)에 높이에 해당하는 전산화단층촬영 절편 두께를 곱 하여 절편 한 개의 용적(voxel)을 계산하였고 설정된 경계 에서 구한 모든 절편의 용적(voxel)을 더하여 전체 용적 (voxel)을 구하였다. 마지막에는 이를 표준 단위(cm3)로 변환 하여 최종 용적(cm3)을 구하였으며5,9 이는 모두 MATLAB 2009a®과 Microsoft Excel만을 사용하여 비교적 간단하게 결과값을 얻을 수 있었다.
전산화단층촬영에 기초한 용적의 측정은 측정 방식, 3차 원 영상 재건 방식, 측정하고자 하는 조직과 주변 구성물 간의 대비(contrast) 등 다양한 요인에 의해 결과값에 영향 을 받는다.17 또한 본 연구와 같이 2차원적 단층 사진의 면 적을 통한 용적의 측정에서 전산화단층촬영의 간격은 결과 에 영향을 주는 중요한 인자이다.
타 장기에서는 촬영 간격에 따른 용적의 차이에 대한 연 구가 많이 있었다. Hori et al18의 연구에서 전산화단층촬영 을 이용한 간의 용적 측정 시, 촬영 간격이 커질수록 간의 용적이 작게 측정되었고 이는 다른 연구에서도 비슷한 경 향성을 보였다.19,20 또한 폐의 결절에서는 촬영 간격이 커질 수록 결절의 용적이 크게 측정되었으며 이는 작은 크기의 결절일수록 촬영 간격에 따른 측정된 용적 차이가 컸다.21,22 본 연구에서도 촬영 간격에 따라 안와 용적의 평균 값은 차 이가 있었으며 촬영 간격이 3 mm일 때 축영상과 관상영상 에서 모두 가장 작은 평균 용적 값이 측정되었다. 촬영 간 격에 따라 측정된 용적이 차이를 보이는 이유는 전산화단 층촬영 영상의 부분 용적 효과(partial volume effect)로 설
명할 수 있다.21,22 이는 인접한 두 조직의 대비(contrast)가 낮은 해상도로 인해 소실되는 것으로 촬영 간격이 클수록 부분 용적 효과로 인해 실제 크기와의 오차가 크게 나타난 다(Fig. 4). 하지만 Winer-Muram et al21은 측정하고자 하는 영역의 크기가 2,000 mm3 이하로 작을 때에만 촬영 간격에 따른 영향이 크다고 하였다. 안와 용적에 관한 대부분의 연 구에서 성인 안와 용적을 약 25-30 cm3로 측정하여8,23,24 안 와 용적 측정에 있어서 촬영 간격은 작은 크기의 조직에 비 해 큰 영향을 끼치지 않을 것으로 생각되며 이는 축성 영상 을 계산한 평균 용적 값이 각 군별로 큰 차이를 보이지 않 는 것으로 확인할 수 있다.
본 연구 결과에서 축영상과 관상영상으로 측정한 안와 용 적은 모두 통계적으로 유의한 양의 상관 관계(r2mm=+0.523, r2.5mm=+0.650, r3mm=+0.701)를 보였다. 그러나 촬영 간격이 세밀할수록 축 영상과 관상영상 간의 상관계수가 낮았고, 촬영 간격이 2 mm와 2.5 mm인 군에서는 축영상과 관상영 상으로 측정한 안와 용적 간에는 통계적으로 유의한 차이 가 있었다(p2mm=0.025, p2.5mm=0.013). 이에 반해 촬영 간격 이 3 mm인 군에서 축영상과 관상영상으로부터 각각 측정 한 안와 용적 간에는 통계적으로 유의한 차이를 보이지 않 았다(p3mm=0.62).
또한 촬영 간격과 관계없이 축영상으로 계산한 안와 용적 의 평균은 약 33 cm3로(V2mm=33.73 ± 2.51 cm3, V2.5mm=33.50
± 3.67 cm3, V3mm=33.31 ± 2.65 cm3) 촬영 간격에 따라 나 눈 각 군 간에 큰 차이를 보이지 않았으나 관상영상으로 계 산한 안와 용적은 각 군 간의 평균 차이가 약 2 cm3 이상이 었다. 이는 명확하게 앞쪽과 뒤쪽의 경계 설정이 가능한 축 성영상에 비해 앞쪽으로는 아래안와연(inferior orbital rim), 뒤쪽으로는 시신경관(optic canal)의 포함 정도를 결정해야 하는 관상 영상의 결과가 재현성이 떨어지며, 이는 촬영 간 격이 세밀할수록 측정자에 의한 오차가 크기 때문에 축영 상 결과와의 차이가 더 크게 발생하는 것으로 생각된다.
결론적으로 본 연구를 통해 저자들이 고안한 측정법으로 축영상을 이용하여 측정한 성인 남자의 안와 용적이 촬영 간격에 관계 없이 비슷하게 측정되었다는 점에서 축영상을 이용한 측정법이 촬영 간격에 관계 없이 안와 용적 측정에 유용함을 증명하였다. 또한 넓은 단면(3 mm)으로 촬영한 전산화단층촬영의 사진이 좁은 단면(2 mm, 2.5 mm)으로 촬영한 전산화단층촬영의 사진보다 안구 용적 측정에서 높 은 재현성을 보여(Table 3) 측정의 편의성 및 측정 대상의 방사선 노출량을 줄이기 위해서 3 mm 단면 두께의 전산화 단층촬영이 저자들이 고안한 측정 방법에 적절할 것이라 생각된다. 추후 안와 용적에 차이를 발생시킬 수 있는 다양 한 질환에서 본 측정 방법을 사용할 수 있을 것으로 기대되
며 저자들이 고안한 측정 방법의 유용성 증명에 대한 선행 연구로써 의미가 있을 것으로 생각된다. 이번 연구의 제한 점은 소규모 연구이며 관찰자가 한 명이어서 관찰자 간의 측정 결과의 재현성을 비교하지 못하였다는 점이다. 추후 더 많은 정상인을 대상으로 2명 이상의 관찰자가 측정하는 추가 연구가 필요할 것으로 생각된다.
REFERENCES
1) Phillips PH. The orbit. Ophthalmol Clin North Am 2001;14:109-27.
2) Cooper WC. A method for volume determination of the orbit and its contents by high resolution axial tomography and quantitative digital image analysis. Trans Am Ophthalmol Soc 1985;83:546-609.
3) Ellis E 3rd, Tan Y. Assessment of internal orbital reconstructions for pure blowout fractures: cranial bone grafts versus titanium mesh. J Oral Maxillofac Surg 2003;61:442-53.
4) Burres SA, Cohn AM, Mathog RH. Repair of orbital blowout frac- tures with Marlex mesh and Gelfilm. Laryngoscope 1981;91:1881-6.
5) Gellrich NC, Schramm A, Hammer B, et al. Computer-assisted secondary reconstruction of unilateral posttraumatic orbital deformity. Plast Reconstr Surg 2002;110:1417-29.
6) Jansen J, Schreurs R, Dubois L, et al. Orbital volume analysis: val- idation of a semi-automatic software segmentation method. Int J Comput Assist Radiol Surg 2016;11:11-8.
7) Deveci M, Oztürk S, Sengezer M, Pabuşcu Y. Measurement of orbi- tal volume by a 3-dimensional software program: an Experimental Study. J Oral Maxillofac Surg 2000;58:645-8.
8) Koppel DA, Foy RH, McCaul JA, et al. The reliability of
“Analyze” software in measuring orbital volume utilizing CT-de- rived data. J Craniomaxillofac Surg 2003;31:88-91.
9) Regensburg NI, Kok PH, Zonneveld FW, et al. A new and validated CT-based method for the calculation of orbital soft tissue volumes.
Invest Ophthalmol Vis Sci 2008;49:1758-62.
10) Choi JH, Park IK, Choi SJ, Shin JH. Measurement of orbital vol- ume from facial CT scans using a semi-automatic computer program. J Korean Ophthalmol Soc 2015;56:168-73.
11) Ye J, Kook KH, Lee SY. Evaluation of computer-based volume measurement and porous polyethylene channel implants in re- construction of large orbital wall fractures. Invest Ophthalmol Vis Sci 2006;47:509-13.
12) Forbes G, Gorman CA, Gehring D, Baker HL Jr. Computer analy- sis of orbital fat and muscle volumes in Graves ophthalmopathy.
AJNR Am J Neuroradiol 1983;4:737-40.
13) Trokel SL, Jakbiec FA. Correlation of CT scanning and pathologic features of ophthalmic Graves’ disease. Ophthalmology 1981;88:553-64.
14) Xi W, Perdanasari AT, Ong Y, et al. Objective breast volume, shape and surface area assessment: a systematic review of breast meas- urement methods. Aesthetic Plast Surg 2014;38:1116-30.
15) Kwon J, Barrera JE, Most SP. Comparative computation of orbital volume from axial and coronal CT using three-dimensional image analysis. Ophthal Plast Reconstr Surg 2010;26:26-9.
16) Bite U, Jackson IT, Forbes GS, Gehring DG. Orbital volume meas- urements in enophthalmos using three-dimensional CT imaging.
Plast Reconst Surg 1985;75:502-8.
17) Frericks BB, Caldarone FC, Nashan B, et al. 3D CT modeling of
= 국문초록 =
다양한 단면 두께의 얼굴 전산화단층촬영 사진을 이용하여 측정한 안와용적 비교
목적: 다양한 단면 두께로 촬영된 얼굴 전산화단층촬영 축영상과 관상영상 사진을 반자동화 프로그램을 사용하여 안와 용적을 측정하 여 차이를 비교하고자 하였다.
대상과 방법: 2 mm, 2.5 mm, 3 mm의 두께로 얼굴 전산화단층촬영을 시행한 30대 성인 남성 50명에 대하여, 안와 용적의 측정이 가능한 반자동화 프로그램(MATLAB 2009aⓇ)을 이용하여 얼굴 전산화단층촬영 사진의 축영상과 관상영상 사진 모두 안와 단면적을 각각 측정하였고, 측정 단면적을 누적하여 안와 용적을 계산하여 이를 비교 분석하여 보았다.
결과: 2 mm로 측정한 축영상에서 우측 33.14 ± 2.37 cm3, 좌측 34.32 ± 2.60 cm3, 관상영상에서 우측 35.54 ± 3.58 cm3, 좌측 34.96 ± 4.05 cm3로 측정되었고, 2.5 mm 간격으로 측정한 축영상에서 우측 33.28 ± 3.35 cm3, 좌측 33.73 ± 4.10 cm3, 관상영상에 서 우측 35.24 ± 3.98 cm3, 좌측 35.10 ± 3.93 cm3로 측정되었다. 3.0 mm 간격으로 측정한 축영상에서 우측 33.23 ± 2.70 cm3, 좌측 33.39 ± 2.69 cm3, 관상영상에서 우측 33.20 ± 3.64 cm3, 좌측 32.95 ± 3.45 cm3로 측정되었다. 2 mm 두께로 측정한 축영상 을 제외하고 나머지 다섯 군에서 우측과 좌측의 안구 용적이 모두 통계적으로 유의한 차이가 없었다(p>0.05). 단면 두께에 따른 측정 값의 평균은 2 mm 간격의 축영상에서 33.73 ± 2.51 cm3, 관상영상에서 35.25 ± 3.76 cm3, 2.5 mm 간격의 축영상에서 33.50 ± 3.67 cm3, 관상영상에서 35.17 ± 3.88 cm3, 3 mm 간격의 축영상에서 33.31 ± 2.65 cm3, 관상영상에서 33.08 ± 3.48 cm3로 측정되 어 촬영 간격이 3 mm인 축영상과 관상영상 사진으로부터 각각 측정한 안와 용적 간에 통계적으로 유의한 차이를 보이지 않았다 (p3mm=0.62).
결론: 본 연구에서는 단면 두께와 관계 없이 축영상으로 측정한 안와 용적이 비슷하게 측정되어 축영상을 이용한 측정법이 안와 용적 측정에 유용함을 증명하였다. 또한 넓은 단면(3 mm)으로 촬영한 전산화단층촬영의 사진이 좁은 단면(2 mm, 2.5 mm)으로 촬영한 전산화단층촬영의 사진보다 안구 용적 측정 시 높은 재현성을 보여 저자들이 고안한 프로그램을 사용하여 안와 용적을 측정할 때는 3 mm 간격의 넓은 간격의 전산화단층촬영이 적절할 것이라 생각된다.
<대한안과학회지 2016;57(11):1671-1677>
hepatic vessel architecture and volume calculation in living do- nated liver transplantation. Eur Radiol 2004;14:326-33.
18) Hori M, Suzuki K, Epstein ML, Baron RL. Computed tomography liver volumetry using 3-dimensional image data in living donor liver transplantation: effects of the slice thickness on the volume calculation. Liver Transpl 2011;17:1427-36.
19) Reiner CS, Karlo C, Petrowsky H, et al. Preoperative liver volume- try: how does the slice thickness influence the multidetector com- puted tomography- and magnetic resonance-liver volume meas- urements? J Comput Assist Tomogr 2009;33:390-7.
20) Berthelet E, Liu M, Truong P, et al. CT slice index and thickness:
impact on organ contouring in radiation treatment planning for prostate cancer. J Appl Clin Med Phys 2003;4:365-73.
21) Winer-Muram HT, Jennings SG, Meyer CA, et al. Effect of varying CT section width on volumetric measurement of lung tumors and application of compensatory equations. Radiology 2003;229:184-94.
22) Petrou M, Quint LE, Nan B, Baker LH. Pulmonary nodule volu- metric measurement variability as a function of CT slice thickness and nodule morphology. AJR Am J Roentgenol 2007;188:306-12.
23) Jurij RB, Frederick AJ. Embryology and Anatomy of the Orbit and Lacrimal System. In: Tasman W, Jaeger EA, eds. Duane's Ophthalmology. Philadelphia: Lippincott Williams & Wilkins, 2007; chap. 32.
24) Kim TH, Jun HS, Byun YJ. The normal value of adult Korean orbi- tal volume in three-dimensional computerized tomography. J Korean Ophthalmol Soc 2001;42:1011-5.