www.e-jcp.or.kr
Risk Factors of Atrophic Gastritis and Intestinal
Metaplasia in First-Degree Relatives of Gastric Cancer Patients Compared with Age-Sex Matched Controls
Original Article
Sooyeon Oh1, Nayoung Kim1,2, Hyuk Yoon2, Yun Jin Choi2, Ju Yup Lee2, Kyoung Jun Park2, Hee Jin Kim2, Kyu Keun Kang2, Dong Hyun Oh2, A Young Seo2, Jae Woo Lee1, Cheol Min Shin2, Young Soo Park2, Jane C. Oh3, Dong Ho Lee1,2, Hyun Chae Jung1
1Department of Internal Medicine and Liver Research Institute, Seoul National University College of Medicine, Seoul, 2Department of Internal Medicine, Seoul National University Bundang Hospital, 3Yonsei Plus Clinic, Seongnam, Korea
Background: To identify whether first-degree relatives (FDRs) of gastric cancer (GC) patients have increased risk for atrophic gastritis (AG) and intestinal metaplasia (IM) in relation to other risk factors of GC.
Methods: The study cohort consisted of 224 pairs of age-sex matched controls and FDRs. AG and IM in the gastric mucosa were scored histologically using the updated Sydney classification. Risk of having AG and IM was studied by comparing FDRs to controls.
Impacts of age, H. pylori infection, smoking, dietary and socioeconomic factors on the presence of AG and IM were studied.
Results: In multivariate regression analysis, FDRs had adjusted OR of 2.69 (95% CI 1.06-6.80, P=0.037) for antral IM in male population. Adjusted OR for antral AG and IM were 9.28 (95% CI 4.73-18.18, P<0.001) and 7.81 (95% CI 3.72-16.40, P<0.001) for the H. pylori infected subjects in total population. Getting old by 5 years increased the ORs of having AG and IM by approximately 1.25 fold (P<0.001). Spicy food increased the OR of antral IM by 2.28 fold (95% CI 1.36-3.84, P=0.002).
Conclusions: Family history of GC was an independent risk factor for antral IM in male in our study, which could be one reason for the increase of gastric cancer in the family member of gastric cancer. It could be an evidence for the necessity of frequent endoscopy in the presence of family history of GC compared to general population in male. (J Cancer Prev 2013;18:149-160)
Key Words: Stomach neoplasms, Helicobacter pylori, Atrophic gastritis, Metaplasia
Received May 16, 2013, Revised June 19, 2013, Accepted June 20, 2013 Correspondence to: Nayoung Kim
Department of Internal Medicine, Seoul National University Bundang Hospital, 300, Gumi-dong, Bundang-gu, Seongnam 463-707, Korea Tel: +82-31-787-7008, Fax: +82-31-787-4051, E-mail: [email protected]
Copyright © 2013 Korean Society of Cancer Prevention
cc This is an Open Access article distributed under the terms of the Creative Commons Attribution Non-Commercial License (http://creativecommons.
org/licenses/by-nc/3.0) which permits unrestricted non-commercial use, distribution, and reproduction in any medium, provided the original work is properly cited.
INTRODUCTION
Classically, gastric cancer (GC) is thought to develop because of ongoing mucosal stress by dietary carcinogen.
Preserved foods in ways of drying, smoking, and salting, which were all usual methods of preserving food from the ancient time, are abundant in nitrate compounds. These nitrate compounds convert to carcinogenic nitrites in the stomach by gastric bacteria such as H. pylori. Modern development of better preservation and refrigeration con- tributed to reduce such nitrate rich and ultimately car-
cinogenic diet, thereby reducing the incidence of GC. In addition, infection of H. pylori, which was classified as a carcinogen in 1994 by the International Agency for Re- search on Cancer,1 and shown to cause GC in 3% of infected patients compared to none of the uninfected,2 has been decreasing with the effort on eradication treatment.
Thanks to fore-mentioned changes on GC dynamics, the incidence of GC is on the gradual decrease. However, despite the global trend of decreasing incidence of GC, it is still a burdensome disease, ranking third place as a cause of cancer-related mortality worldwide.3 Moreover GC is the
2nd most prevalent cancer in Korea marking as the most and the 4th most prevalent cancer in male and female respectively. GC incidence rate was 68.4 and 64.2 cases per 100,000 person-year in 1999 and 2010 respectively according to Korea national cancer information center, showing a minimal decrease during those 10 years. To prevent GC from developing and progressing, there should be multiple strategies. For that, looking into the carcino- genesis and risk factors of GC is of utmost importance.
There are two types of GC, which include diffuse type and intestinal type, classified according to Lauren’s classifi- cation system. In intestinal type, GC is thought to develop through a sequential cascade, in which mucosal inflam- mation develops into atrophic gastritis (AG), intestinal metaplasia (IM), dysplasia and finally into gastric cancer, postulated by Correa early in time.4 This type of GC often develops in relation to H. pylori and H. pylori infected individuals with IM has GC risk increased by 6.5 fold.2 Therefore, there have been efforts to elucidate whether H.
pylori eradication can reverse or stop the cascade. Until recently, studies showed regression of atrophy but no regression of IM after H. pylori-eradication.5-10 However, H. pylori eradicated group had less progression of IM com- pared to H. pylori not eradicated group.11 Recently, we demonstrated that atrophy regressed in the body and even severe cases of IM showed improvement after H. pylori eradication.12 The important point is that in all of the studies mentioned, there were no regression of IM in the eradicated individuals, implicating that IM is considered to be the “point of no return”, even though H. pylori era- dication can help to slow down the carcinogenic process.
In secondary prevention of GC, it is important to screen individuals with high risk of developing GC and let them be checked for premalignant and malignant lesions more frequently. Risk factors of developing premalignant lesions such as AG and IM are thought to be identical to those of GC. Among the risk factors, family history of GC13 and H.
pylori infection are most important. Thus, recent studies showed that the first degree relatives (FDRs) of GC and the H. pylori-infected individuals have increased risk of IM.14,15 However, most of these studies have not been stratified according to age and sex. Since age and sex are both independent risk factors of GC, it is necessary to match the
population by age and sex to get a thorough comparison by reducing confounding effects of age and sex. Therefore, this study was aimed to find out how much family history of GC as well as sex and age factors contribute to the incidence of AG and IM through age-sex matched popu- lation study. Furthermore, this study looked into the re- levance of H. pylori infection and environmental factors to AG and IM.
MATERIALS AND METHODS
1. Subjects
This study is a case-control study, utilizing the data which had been collected prospectively for previous studies.12,16 Collected data and medical records of healthy subjects who visited Seoul National University Bundang Hospital during the period of 2003 to 2012 were analyzed. Those who were confirmed, in endoscopic exam, not to have any evidence of GC, dysplasia, mucosa-associated lymphoid tissue lymphoma, esophageal cancer, or peptic ulcer di- sease at the time of visit were screened (n=564). Among them, 244 were first degree relatives (siblings, children or parents) of GC patients, and 320 were controls without such family history of GC. FDRs came to our clinic seeking counseling for their family history of GC, while controls came for routine health check-up. For the FDRs, controls were matched for age and sex. For age matching, controls within±2 years of age difference were selected. In this process, some FDRs and controls were inevitably discarded.
The selection process was random. Finally, 68 male and 156 female pairs for both FDRs and controls were matched.
Afterward, the selected males were matched with females by age in the same fashion making 67 male and female double pairs of subjects for FDRs and controls.
All subjects had already provided detailed information on their family history of GC and answered to a questionnaire under the supervision of a well-trained interviewer. The questionnaire included questions regarding demographic (age, sex, and residency during childhood), socioeconomic (smoking, current income and school education), and die- tary (salty and spicy food diet) data. The study protocol was approved by the Ethics Committee at Seoul National University Bundang Hospital.
Table 1. Sequence of primers used for RT-PCR
No. of subjects (%)
P-value Control (n=224) FDR (n=224)
Sex Male 68 (30.4) 68 (30.4) 1
Female 156 (69.6) 156 (69.6)
Age (mean±SD) Total 51.67±10.39 51.56±10.56 0.91
Male 49.54±10.62 49.19±11.03 0.85
Female 52.59±10.19 52.59±10.21 1
H. pylori Negative 69 (30.8) 61 (27.2) 0.405
Positive 155 (69.2) 163 (72.8)
Spicy diet Low/moderate 131 (60.1) 78 (36.6) <0.001 (OR 2.61)
Severe 87 (39.9) 135 (63.4)
Salty diet Low/moderate 79 (36.1) 58 (27.1) 0.045 (OR 1.52)
Severe 140 (63.9) 156 (72.9)
Smoking Current/ex-smoker 58 (26.9) 61 (28.9) 0.635
Non-smoker 158 (73.1) 150 (71.1)
Residency during childhood Urban 127 (58.8) 110 (51.4) 0.123
Rural 89 (41.2) 104 (48.6)
Current income (US$/month) <5000 130 (62.2) 138 (67.6) 0.246
≥5000 79 (37.8) 66 (32.4)
Education Elementary 16 (7.3) 16 (7.8) 0.869
Middle-high 100 (45.5) 88 (42.9)
University 104 (47.3) 101 (49.3)
FDR, first degree relatives of gastric cancer.
P-values were calculated using χ2-test except mean age. In mean age, P-values were calculated with student t-test.
Missing values were due to non-answer to questionnaire.
2. Histological evaluation
Via gastric endoscopy, 10 biopsy specimens were ob- tained. Two biopsy specimens were taken from the greater curvature of both the mid antrum and mid body of the stomach, and three from both the lesser curvature of the antrum and body. Among the 10 specimens, one from the antrum and one from the body were fixed in formalin, stained with hematoxylin and eosin, and used for his- tological evaluation. They were assessed for the degree of inflammatory cell infiltration, AG and IM. The histological features of the gastric mucosa were recorded using the updated Sydney scoring system (0=none, 1=slight, 2=mo- derate, and 3=marked). When the specimens were not prepared well enough to evaluate full-thickness gastric mucosa due to problems such as improper fixation, inaccurate orientation, and section inappropriateness, or whenever inflammation prevented a clear distinction bet- ween nonatrophic and atrophic phenotypes, samples were classified as “indefinite for atrophy”.17 All biopsies were examined independently by two experienced patho-
logists, who were unaware of the clinical history. In the event of disagreement, the biopsies were re-examined by these two pathologists until agreement was reached.
3. Helicobacter pylori testing
Among the above-mentioned 10 biopsy specimens, each from antrum and body was fixed in formalin, stained with modified Giemsa method, and assessed for the presence of H. pylori. Another set from antrum and body was examined with rapid urease testing (CLO test, Delta West, Bentley, Australia). Third set was cultured. The antral and corporal biopsy specimens were evaluated separately, and the cultured organisms were confirmed as H. pylori if they were compatible to H. pylori in Gram staining, colony morphology, and oxidase, catalase, and urease reactions.
Anti-H. pylori immunoglobulin G was determined qua- litatively using an enzyme-linked immunosorbent (ELISA) assay (Genedia H. pylori ELISA; Green Cross Medical Science Corp, Seoul, Korea), when the three above-men- tioned H. pylori tests were negative. If the H. pylori serology was positive but no bacteria were found on the
histology, CLO test or culture, the diagnosis was past H.
pylori infection without current ongoing infection, and the cases were also classified as H. pylori-positive.
4. Statistical analysis
Data were analyzed using the Pearson χ2 test, univariate and multivariate logistic regression models, and student t-test.
The occurrence of AG and IM was analyzed in several ways, using Pearson χ2 test. First, the histological grade of AG according to updated Sydney scoring system (0=none, 1=slight, 2=moderate, and 3=marked) and the histological presence of AG (absent, present) were studied. Second, histological grade of AG was studied in subgroups, in which IM was present or absent respectively. Third, the histological presence and grade of IM were studied. Above analyses compared FDRs to controls in total (224 pairs of FDR and control subjects), male (67 pairs) and female (156 pairs) populations. Analyses comparing males to females in FDRs (67 pairs of male and female subjects) and controls (67 pairs) were followed.
The effects of family history of GC, sex, H. pylori, spicy and salty diet, smoking, residency during childhood, income, education on AG and IM were analyzed with Pearson χ2 test. In analysis of aging factor, univariate logistic regression model was used. Variables with P<0.2 were subjected to multivariate logistic regression analyses.
Although sex and FDR factors didn’t show P<0.2 in every analysis, they were entered to the model since they were considered to be important in this study. Model fits were assessed using Nagelkerke’s R2 test and Hosmer-Leme- show goodness-of-fit tests. Mean age and mean values of histological grade of AG and IM in each group were analyzed using student t-test. Differences were considered significant when the P-values were <0.05. All analyses were performed using the statistical software package SPSS (version 18.0, SPSS inc., Chicago, IL, USA).
RESULTS
1. Baseline characteristics of study subjects
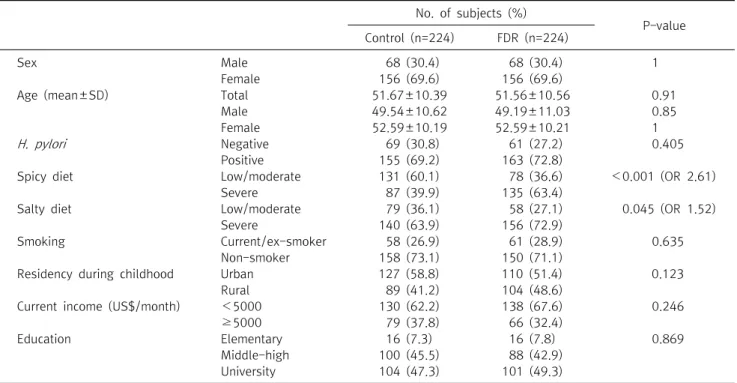
Table 1 shows baseline characteristics of study popu- lation. There were missing values less than 10% owing to
non-answer to questionnaire. For the total 224 pairs, in- cluding both male and female subjects, mean age was about 51. The two groups did not have significant differen- ces in residency during childhood, smoking history, final education, and H. pylori infection status. Regarding to H.
pylori, almost 70% of subjects were shown to be infected.
In dietary habits, the two groups had significant differen- ces. Not surprisingly, FDRs showed preference to spicy and salty food diet. FDRs eat severely spicy food and severely salty food more by 2.6 fold and 1.5 fold, respectively, compared to controls.
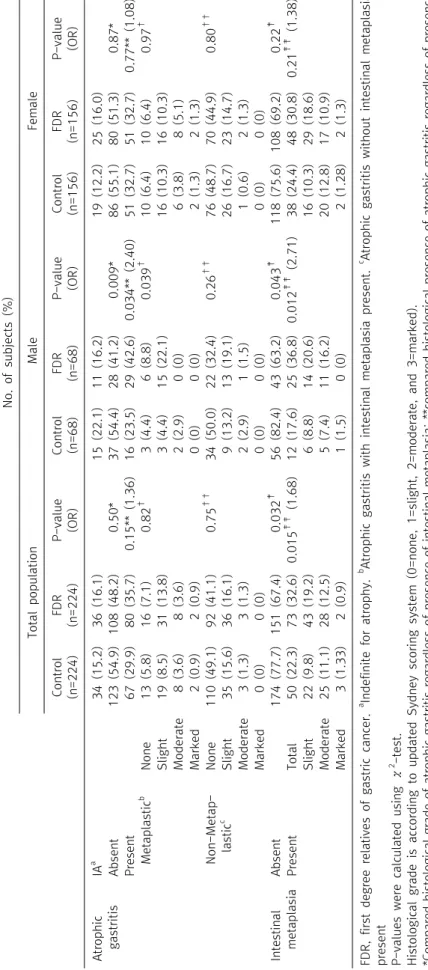
2. Association of atrophic gastritis and intestinal me- taplasia with family history of gastric cancer and sex After excluding cases indefinite for atrophy (70 in antrum and 61 in body), there were 32.8% (147 of 448) and 20.7%
(93 of 448) of AG in antrum and body, respectively. There were 27.5% (123 of 448) and 18.5% (83 of 448) of IM in antrum and body, respectively.
In antrum, there was a tendency that FDRs have AG and IM more frequently (Table 2). In male group analysis, FDRs had more cases of AG by 2.4 fold (P=0.034) and IM by 2.71 fold (P=0.012) compared to controls. In total population, FDRs had more cases of IM by 1.68 fold compared to controls (P=0.015). In terms of severity, it was not evident whether FDRs had severer cases of AG and IM owing to small number of severe cases observed. Some of the results, however, reached statistical significance. In male group analysis, FDRs seemed to have severer cases of both AG and IM with P-value of 0.009 and 0.043 respectively. In total population, FDRs had severer cases of IM with P-value of 0.032. Comparison was done between sex in FDR and control populations respectively (data not shown). In controls, males had fewer cases of AG and IM. In FDRs, males had more cases of AG and IM. In terms of severity, males were shown to have severer cases of metaplastic AG and IM with P-value of 0.066 and 0.055, respectively.
Analysis of body was done in the same manner (Table 3).
However, the results were neither consistent nor statis- tically significant.
Table 2. Atrophic gastritis and intestinal metaplasia in the antrum
No. of subjects (%) Total populationMaleFemale Control (n=224)FDR (n=224)P-value (OR)Control (n=68)FDR (n=68)P-value (OR)Control (n=156)FDR (n=156)P-value (OR) Atrophic gastritis IAa 34 (15.2)36 (16.1)15 (22.1)11 (16.2)19 (12.2)25 (16.0) Absent123 (54.9)108 (48.2)0.50*37 (54.4)28 (41.2)0.009*86 (55.1)80 (51.3)0.87* Present67 (29.9)80 (35.7)0.15** (1.36)16 (23.5)29 (42.6)0.034** (2.40)51 (32.7)51 (32.7)0.77** (1.08) Metaplasticb None 13 (5.8)16 (7.1)0.82† 3 (4.4)6 (8.8)0.039† 10 (6.4)10 (6.4)0.97† Slight19 (8.5)31 (13.8)3 (4.4)15 (22.1)16 (10.3)16 (10.3) Moderate 8 (3.6)8 (3.6)2 (2.9)0 (0)6 (3.8)8 (5.1) Marked2 (0.9)2 (0.9)0 (0)0 (0)2 (1.3)2 (1.3) Non-Metap- lasticc None110 (49.1)92 (41.1)0.75†† 34 (50.0)22 (32.4)0.26†† 76 (48.7)70 (44.9)0.80†† Slight35 (15.6)36 (16.1)9 (13.2)13 (19.1)26 (16.7)23 (14.7) Moderate 3 (1.3)3 (1.3)2 (2.9)1 (1.5)1 (0.6)2 (1.3) Marked0 (0)0 (0) 0 (0)0 (0) 0 (0)0 (0) Intestinal metaplasiaAbsent174 (77.7)151 (67.4)0.032‡56 (82.4)43 (63.2)0.043‡118 (75.6)108 (69.2)0.22‡ PresentTotal50 (22.3)73 (32.6)0.015‡‡ (1.68)12 (17.6)25 (36.8)0.012‡‡ (2.71)38 (24.4)48 (30.8)0.21‡‡ (1.38) Slight22 (9.8)43 (19.2)6 (8.8)14 (20.6)16 (10.3)29 (18.6) Moderate 25 (11.1)28 (12.5)5 (7.4)11 (16.2)20 (12.8)17 (10.9) Marked3 (1.33)2 (0.9) 1 (1.5)0 (0) 2 (1.28)2 (1.3) FDR, first degree relatives of gastric cancer. a Indefinite for atrophy. b Atrophic gastritis with intestinal metaplasia present. c Atrophic gastritis without intestinal metaplasia present P-values were calculated using χ2 -test. Histological grade is according to updated Sydney scoring system (0=none, 1=slight, 2=moderate, and 3=marked). *Compared histological grade of atrophic gastritis regardless of presence of intestinal metaplasia; **compared histological presence of atrophic gastritis regardless of presence of intestinal metaplasia; † compared histological grade of metaplastic atrophic gastritis;†† compared histological grade of non-metaplastic atrophic gastritis; ‡ compared histo- logical grade of intestinal metaplasia; ‡‡ compared histological presence of intestinal metaplasia.
Table 3. Atrophic gastritis and intestinal metaplasia in the body No. of subjects (%) Total populationMaleFemale Control (n=224)FDR (n=224)P-value (OR)Control (n=68)FDR (n=68)P-value (OR)Control (n=156)FDR (n=156)P-value (OR) Atrophic gastritis IAa 27 (12.1)34 (15.2)6 (8.8)14 (20.6)21 (13.5)20 (12.8) Absent148 (66.1)146 (65.2)0.61*51 (75)43 (63.2)0.94*97 (62.2)103 (66.0)0.49* Present49 (21.9)44 (19.6)0.69** (0.91)11 (16.2)11 (16.2)0.47** (1.19)38 (24.4)33 (21.2)0.47** (0.82) Metaplasticb None 11 (4.9)8 (3.6)0.40† 4 (5.9)2 (2.9)0.54† 7 (4.5)6 (3.85)0.57† Slight13 (5.8)18 (8.0)4 (5.9)6 (8.8)9 (5.8)12 (7.7) Moderate 7 (3.1)11 (4.9)2 (2.9)3 (4.4)5 (3.2)8 (5.1) Marked3 (1.3)1 (0.45)0 (0)0 (0)3 (1.9)1 (0.6) Non-Metap- lasticc None 137 (61.2)138 (61.6)0.19†† 47 (69.1)41 (60.3)0.54†† 90 (57.7)97 (62.2)0.22†† Slight23 (10.3)12 (5.4)4 (5.9)2 (2.9)19 (12.2)10 (6.4) Moderate 3 (1.3)2 (0.9)1 (1.5)0 (0)2 (1.3)2 (1.3) Marked0 (0)0 (0) 0 (0)0 (0) 0 (0)0 (0) Intestinal metaplasia Absent186 (83.0)179 (79.9)0.36‡57 (83.8)54 (79.4)0.66‡129 (82.7)125 (80.1)0.14‡ PresentTotal38 (17.0)45 (20.1)0.40‡‡ (1.23)11 (16.2)14 (20.6)0.51‡‡ (1.34)27 (17.3)31 (19.9)0.56‡‡ (1.19) Slight22 (9.8)29 (12.9)8 (11.8)8 (11.8)14 (9.0)21 (13.5) Moderate 12 (5.3)15 (6.7)3 (4.4)5 (7.4)9 (5.8)10 (6.4) Marked4 (1.8)1 (0.4) 0 (0)1 (1.5) 4 (2.6)0 (0) P-values were calculated using χ2 -test. Histological grade is according to updated Sydney scoring system (0=none, 1=slight, 2=moderate, and 3=marked). FDR, first degree relatives of gastric cancer. a Indefinite for atrophy. b Atrophic gastritis with intestinal metaplasia present. c Atrophic gastritis without intestinal metaplasia present *Compared histological grade of atrophic gastritis regardless of presence of intestinal metaplasia; **compared histological presence of atrophic gastritis regardless of presence of intestinal metaplasia; † compared histological grade of metaplastic atrophic gastritis;†† compared histological grade of non-metaplastic atrophic gastritis; ‡ compared histo- logical grade of intestinal metaplasia; ‡‡ compared histological presence of intestinal metaplasia.
Table 4.H. pylori, smoking, dietary and socioeconomic factors in relation to the presence of atrophic gastritis and intestinal metaplasia No. of patients (%) H. pyloriSmokingSpicy dietSalty diet Negative (n=131)Positive (n=317)P-value (OR)
Non- smoker (n=308)
Current/ ex-smoker (n=119) P-value (OR) Low/ moderate (n=209)
Severe (n=222)P-value (OR) Low/ moderate (n=137)
Severe (n=296)P-value (OR) AntrumAtrophic gastritisAbsent101 (89.4)130 (49.1)<0.001 (8.74)149 (58.0)64 (63.4)0.35 (0.80)111 (66.5)108 (55.1) 0.027 (1.62)76 (67.9)144 (57.1)0.054 (1.58)Present12 (10.6)135 (50.9)108 (42.0)37 (36.6)56 (33.5)88 (44.9)36 (32.1)108 (42.9) Intestinal metaplasiaAbsent119 (90.8)246 (77.6)<0.001 (5.96)225 (73.1)85 (71.4)0.74 (1.08)168 (80.4)145 (65.3)<0.001 (2.18)107 (78.1)206 (69.6)0.066 (1.56)Present12 (9.2)71 (22.4)83 (26.9)34 (28.6)41 (19.6)77 (34.7)30 (21.9)90 (30.4) BodyAtrophic gastritisAbsent105 (89.7)189 (70.0)<0.001 (3.75)193 (72.3)87 (85.3)0.009 (0.45)135 (77.6)147 (73.9) 0.40 (1.22)94 (78.3)189 (74.1)0.38 (1.26)Present12 (10.3)81 (30.0)74 (27.7)15 (14.7)39 (22.4)52 (26.1)26 (21.7)66 (25.9) Intestinal metaplasiaAbsent120 (91.6)205 (64.7)<0.001 (2.86)251 (81.5)97 (81.5)1.00 (1)174 (83.3)175 (78.8) 0.24 (1.34)110 (80.3)240 (81.1)0.85 (0.95)Present11 (8.4)112 (35.3)57 (18.5)22 (18.5)35 (16.7)47 (21.2)27 (19.7)56 (18.9) No. of patients (%) Residency during childhoodCurrent income (US$/month)Education Urban (n=237)Rural (n=193)P-value (OR)≥5000 (n=145)<5000 (n=268)P-value (OR)Elementary (n=32)Middle-High (n=188)University (n=205)P-value AntrumAtrophic gastritisAbsent127 (65.1)90 (53.9)0.030 (1.60)79 (65.8)137 (59.6)0.25 (1.31)17 (58.6)92 (56.1)108 (65.5)0.216 Present68 (34.9)77 (46.1)41 (34.2)93 (40.4)12 (41.4)72 (43.9)57 (34.5) Intestinal metaplasiaAbsent176 (74.3)136 (70.5)0.38 (1.21)107 (73.8)194 (72.4)0.76 (1.07)19 (59.4)134 (71.3)154 (75.1)0.167 Present61 (25.7)57 (29.5)38 (26.2)74 (27.6)13 (40.6)54 (28.7)51 (24.9) BodyAtrophic gastritisAbsent157 (78.5)125 (72.7)0.19 (1.37)100 (80.6)173 (73.3)0.122 (1.52)19 (67.9)119 (71.3)139 (79.4)0.148 Present43 (21.5)47 (27.3)24 (19.4)63 (26.7)9 (32.1)48 (28.7)36 (20.6) Intestinal metaplasiaAbsent199 (84.0)150 (77.7)0.099 (1.50)113 (77.9)222 (82.8)0.22 (0.73)26 (81.3)145 (77.1)172 (83.9)0.235 Present38 (16.0)43 (22.3)32 (22.1)46 (17.2)6 (18.8)43 (22.9)33 (16.1) P-values were calculated using χ2 -test. Missing values were due to cases "indefinite for atrophy" and non-answer to questionnaire.
Table 5. Age distribution of atrophic gastritis and intestinal metaplasia in the total population
Age n
No. of subjects (%)
Antrum Body
Atrophic gastritis Intestinal metaplasia Atrophic gastritis Intestinal metaplasia
26-30 8 1 (12.5) 0 (0.0) 0 (0.0) 0 (0.0)
31-35 28 4 (14.3) 2 (7.1) 2 (7.1) 4 (14.3)
36-40 30 8 (26.7) 9 (30.0) 2 (6.7) 2 (6.7)
41-45 57 17 (29.8) 12 (21.1) 14 (24.6) 10 (17.5)
46-50 79 26 (32.9) 16 (20.3) 15 (19.0) 7 (8.9)
51-55 75 24 (32.0) 22 (29.3) 11 (14.7) 12 (16.0)
56-60 74 26 (35.1) 25 (33.8) 16 (21.6) 16 (21.6)
61-65 54 23 (42.6) 21 (38.9) 16 (29.6) 19 (35.2)
66-70 33 13 (39.4) 13 (39.4) 13 (39.4) 10 (30.3)
71-75 10 5 (50.0) 3 (30.0) 4 (40.0) 3 (30.0)
Total 448 147 93 123 83
P-value 0.001 <0.001 <0.001 <0.001
OR (95% CI) 1.19 (1.07-1.31) 1.22 (1.10-1.36) 1.28 (1.13-1.44) 1.28 (1.13-1.45)
P-values were calculated using univariate logistic regression analysis.
3. Association of H. pylori infection with the presence of atrophic gastritis and intestinal metaplasia To evaluate the impact of H. pylori infection on devel- opment of AG and IM, the total population is sorted into H.
pylori negative and positive groups irrespective of age and sex. Since there was no significant difference in H. pylori infection between FDRs and controls in the initial analysis of demographics, the population can be conceived to be virtually H. pylori and FDR matched. The presence of AG and IM was counted in these sets of new groups (Table 4).
In this analysis, the results were prominent to show that AG and IM happen more in H. pylori infected subjects. Odds ratios of developing AG and IM in antrum were 8.74 and 5.96 (P<0.001), and in body 3.75 and 2.86 (P<0.001), respectively.
4. Association of other environmental factors with the presence of atrophic gastritis and intestinal metaplasia To evaluate the association of other environmental factors with the presence of AG and IM, the total population is sorted in the same manner used in the analysis of H. pylori infection with the presence of AG and IM (Table 4). Smo- king, which is a known risk factor of gastric cancer,18 presented rather a contradicting result. History of smoking reduced the OR of having corporal AG by 0.45 fold (P=0.009). Severely spicy food diet showed significant
association with antral AG and IM with OR (P-value) of 1.62 (0.027) and 2.18 (<0.001) respectively. Severely salty food diet failed to reach statistical significance. Childhood residency in rural area is positively associated with presen- ce of antral AG with statistical significance OR of 1.6 (P=0.03). There were no statistically significant association of current income and education with AG and IM.
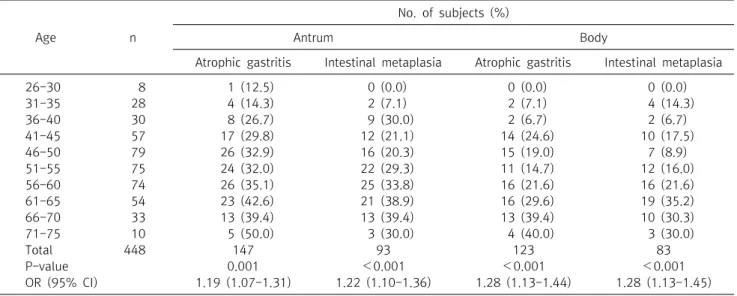
5. Presence of atrophic gastritis and intestinal meta- plasia according to age
The total population is put into age groups of 5-year interval from 26-30 to 71-75. The presence of AG and IM is counted in each group. Univariate logistic regression analysis was done according to the age groups with group 26-30 set as the reference. The distribution of AG and IM increases with age (Table 5, Fig. 1). The odds ratio was about 1.2 per 5-year (P≤0.001). Moreover, AG and IM showed more than 30% prevalence in ages above 61 years.
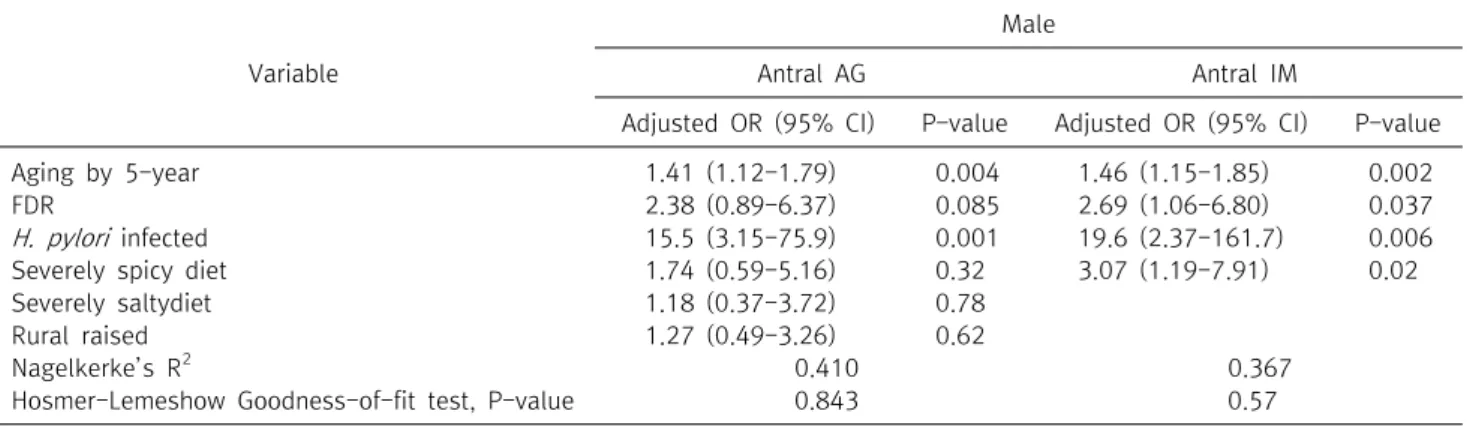
6. Multivariate logistic regression analysis of risk fac- tors of atrophic gastiritis and intestinal metaplasia Although FDR and sex didn’t show P<0.2 in every analysis, they were entered into the model since they were considered to be important in this study. In both AG and IM, age and H. pylori infection had considerable impacts. In antral IM, spicy food diet showed significant association.
FDR did not show significant association with AG and IM