vices are changing their structure [1]. Traditional supplier- focused services and post-treatment services are transform- ing into pre-treatment and user-oriented services, which consider wellness and preventative healthcare more actively than in the past. In South Korea, as low fertility rates (total fertility rate is 1.23 in 2010) and the aging society (people aged 65 and over is 11.3% of its total population in 2008) [2]
become increasingly problematic, two health-related prob- lems are emerging: increasing demand for chronic-disease related healthcare services, and the rising cost burden on the government for increased health services. U-health, called telehealth or e-health in other countries, is considered a use- ful method to manage health-related problems, although evidence of the effectiveness of it is incomplete [3]. In Korea, u-health is defined as “healthcare services delivered through ubiquitous technology such as radio frequency identification (RFID), biometric devices, and ubiquitous sensor networks.
In particular, u-health is testing intended to monitor and
I. Introduction
With the improvement of standards of living in many coun- tries worldwide, the demand for improved social welfare provisions, low birth rates, and aging societies, health ser-
U-Health Service for Managing Chronic Disease: A Case Study on Managing Metabolic Syndrome in a Health Center in South Korea
Tae-Min Song, PhD1, Seewon Ryu, PhD2, Sang Ho Lee, MBA3
1Korea Institute for Health and Social Studies, Affairs, Seoul; 2Inje Institute of Advanced Studies, Seoul; 3HealthMax Co. Ltd., Seoul, Korea
Objectives: We were to analyze the effect of managing metabolic syndrome using a u-health service in a health center. Methods:
We collected biometric data from 316 subjects living in a county (gun) in South Korea before and after the introduction of u- health services in 2010. Analysis was done by contingency table using SPSS and latent growth model using AMOS. Results:
We found that regional u-health services affected instance of metabolic syndrome. Further, biometrics and health behavior improved. After six months of u-health services, the number of subjects with three or more factors for metabolic syndrome decreased by 62.5%; 63.3% of regular drinkers stopped drinking; 83.3% of subjects who rarely exercised began to exercise twice a week or more; and 60.9% of smokers stopped smoking. Conclusions: U-health services can change health behavior and biometrics to manage metabolic syndrome in rural areas. The usefulness of u-health services is discussed.
Keywords: U-Health, Metabolic Syndrome, Effectiveness, Disease Management
Healthc Inform Res. 2011 December;17(4):260-266.
http://dx.doi.org/10.4258/hir.2011.17.4.260 pISSN 2093-3681 • eISSN 2093-369X
Submitted: September 14, 2011 Revised: September 20, 2011 Accepted: December 26, 2011 Corresponding Author Seewon Ryu, PhD
Inje Institute of Advanced Studies, 64 Jeo-dong 2-ga, Jung-gu, Seoul 100-032, Korea. Tel: +82-2-2270-0984, Fax: +82-2-2270- 0974, E-mail: [email protected]
This is an Open Access article distributed under the terms of the Creative Com- mons Attribution Non-Commercial License (http://creativecommons.org/licenses/by- nc/3.0/) which permits unrestricted non-commercial use, distribution, and reproduc- tion in any medium, provided the original work is properly cited.
ⓒ 2011 The Korean Society of Medical Informatics
manage people’s health incomes, including those of people with chronic diseases. In this situation, many countries can adopt u-health as a good countermeasure with two positive effects. First, it will ease the burden of healthcare services, which has a ripple effect throughout the healthcare industry.
Second, it has policy effects on public healthcare and disease prevention.
Worldwide, the u-health market is expected to increase 15%
or more annually by 2013, from US$ 1.057 trillion in 2007 to $ 2.537 trillion in 2013 [4]. It is anticipated that u-health services for elderly people, especially services for remote monitoring, will earn US$ 1.2 billion of net income annually.
This market will grow from US$ 1.4 billion in 2010 to US$
2.6 billion in 2014; this means a 12.5% increase every year [5]. In addition, it is expected that new job opportunities will exist for 39,000 people by 2014. Until now, u-health has been used for telemedicine and as an instrument in home healthcare for patients who have chronic diseases, by means of biosensor devices. Patients monitoring their conditions through u-health services measured their own biometric data, including temperature, blood pressure, pulse, weight,
blood sugar, body fat, electrocardiograms, and clinical tests using blood and urine.
It has been proven that telemedicine or telecare services are effective for diabetes [1,6-9], hypertension [10,11], tu- berculosis [12], asthma [13], metabolic syndrome [14,15], and quitting smoking [16]. U-health methods to manage or monitor chronic disease are regarded as useful to improve health status and lower medical expenditures [17,18]. How- ever, confirmation of whether u-health services based on ubiquitous technology would also be effective to manage chronic disease in rural Korea is to be determined.
The purpose of this study is to analyze the effectiveness of u-health services for managing people with metabolic syn- drome in a health center in Korean county (gun).
II. Methods
1. Experimental Design of U-health Services
The South Korean Ministry of Health and Welfare (MOHW) have been experimenting with the management of meta- bolic syndrome in a trial project using u-health devices and
Figure 1. u-Health metabolic syndrome care service model.
systems at the community level. The service was targeted at people aged over 20 with risk factors for metabolic syndrome in households with less than the average monthly income.
The trial project ran for six months in an urban-rural complex in Korea. It included periodical health assessment, consultation about healthy lifestyles, nutrition programs, and exercise, all using the u-health device. The main point of u-health is to provide customized healthcare services for in- dividuals, consulting services for patients, programs for self- health management with a 24-hour monitoring target and feedback to patients on health examination results.
Subjects’ bio-signals were measured daily through u- health devices such as 3D passometers, body-composition analyzers, and sphygmomanometers. The measured data were transmitted to a u-health database. A clinical-decision support system (CDSS) analyzed the data in real time and sent the information to the individual concerned directly by phone call or web service. Phone calls were made by u- health consultants: two exercise therapists and two dietitians (Figure 1).
We applied the National Cholesterol Education Program Adult Treatment Panel III (NCEP ATP III) standards [19], which are used to decide whether an individual has meta- bolic syndrome: body fat (waist greater than 90 cm in a man
and greater than 85 cm in a woman), high neutral fat (greater than 150 mg/dL), low high-density lipoprotein cholesterol (less than 40 mg/dL), blood pressure (above 130 mmHg of systolic blood pressure; above 85 mmHg of diastolic blood pressure), and fasting blood sugar (greater than 100 mg/
dL). Anyone who meets more than one of these conditions is considered to have metabolic syndrome.
We implemented the project using a one-group posttest- only design [20].
Table 1. Characteristics of sample
Characteristics Categories Cases (%)
Sex Male 120 (38.0)
Female 196 (62.0)
Age Less than 49 91 (28.8)
50-59 134 (42.4)
Above 60 91 (28.8)
Job White-color 26 (8.2)
Service 23 (7.3)
Research/professional 15 (4.7) Housewife/no-job 162 (51.3)
Agriculture 90 (28.5)
Table 2. Biometric data change six months after u-Health services Biometrics
By sex By age
Overall
Male Female Under 49 50-59 Above 60
Before After Before After Before After Before After Before After Before After SBP (mmHg) 130.08 125.36b 126.11 120.25c 114.58 114.12 127.99 122.94b 132.70 125.32c 122.98 122.66c DBP (mmHg) 79.66 75.25c 79.24 74.66c 73.09 72.52 81.42 77.8b 79.17 72.06c 79.44 74.94c Weight (kg) 71.12 69.87c 61.77 60.60 66.16 64.42b 65.69 65.06 65.79 64.13c 65.81 64.60c Body fat (%) 24.14 23.30c 36.64 35.44 30.98 28.59b 31.30 30.91 31.30 30.07c 31.24 30.20b
Muscular (%) 50.90 50.61 36.27 36.58 43.13 43.65 42.36 42.52 42.62 42.31a 42.59 42.63
BMR (kcal/day) 1,474.9 1,462.3b 1,154.7 1,155.5 1,337.0 1,340.1 1,288.1 1,288.1 1,279.0 1,263.8b 1,293.00 1,293.99 Visceral fat (g/mL) 14.21 13.97 7.71 7.28c 8.34 7.93 10.38 10.09a 11.68 11.28c 10.52 10.17c
BMD (g/cm2) 2.79 2.77 2.20 2.24 2.54 2.59 2.44 2.46 2.44 2.42 2.46 2.47
Physical age (yr) 47.79 45.81 55.39 51.94c 43.74 39.12a 52.39 50.45 55.57 52.53c 52.11 49.30c Consumed calorie (cal) 1,362.3 1,602.8 1,243.0 1,200.1 1,332.7 1,156.3 1,516.8 1,208.9b 986.1 1,693.0c 1,292.97 1,368.96
BMI 25.92 25.42c 25.49 25.02 25.35 24.63b 25.75 25.52 25.72 25.08c 25.68 25.20b
No. of walking 5,611.4 10,500.9c 5,028.6 7,753.9c 5,515.6 6,679.2 5,125.2 9,562.1c 5,371.5 9,448.2c 5,285.51 8,964.92c Waist (cm) 93.33 87.64c 89.43 81.90b 90.73 82.91c 90.43 84.27c 92.05 85.10c 90.95 84.15c Body fat (TG) 167.36 187.66 136.19 152.67b 139.66 164.20 148.58 174.53b 155.34 153.68 148.15 166.09a Blood sugar (mg/dL) 108.12 102.47a 101.13 95.10b 92.42 89.75 106.17 99.14a 110.57 103.59b 103.80 97.92c
HDL-C 49.46 50.43 50.89 50.84 49.34 48.72 51.46 51.47 49.35 51.15 50.33 50.68
SBP: systolic blood pressure, DBP: diastolic blood pressure, BMR: basal metabolic rate, BMD: bone mineral density, BMI: body mass index, TG: triglycerides, HDL-C: high-density lipoprotein cholesterol.
ap < 0.1. bp < 0.05. cp < 0.01.
2. Data Collection
The subjects were 316 residents in county A who had been medically diagnosed with metabolic syndrome and earned less than the average national monthly income. We collected biometric data on subjects twice using u-health devices:
before and six months after the implementation of u-health services. We surveyed the data about their health on the same schedule.
3. Statistical Analysis
We analyzed the data by contingency table and t-Test using SPSS ver. 19.0 (SPSS Inc., Chicago, IL, USA) In addition, a latent growth model was used to trace changing body mass index (BMI) using AMOS ver. 19.0 (SPSS Inc.).
III. Results
1. Sample Description
The sample comprised of 38.0% male, 42.4% people in their fifties, and 51.3% housewives and people without regular paid work (Table 1).
2. Changes in Basic Biometric Data
Basic biometrics for the subjects, who used u-health services to track the state of their metabolic syndrome for six months, improved significantly in that time: blood pressure, weight, abdominal visceral fat, physical age, the extent of walking, waist size and blood sugar (p < 0.01); body fat and BMI (p <
0.05); and body fat (triacylglycerol; p < 0.1) (Table 2).
3. Changes to BMI
We analyzed BMI change over time using a latent growth model. The most useful model for tracing BMI by time was a second-year model. Its mean for the first year was 26.00, and variance was 16.19%. Mean BMI change rate was -0.48, and variance was 2.56. Model fit was appropriately high: NFI (0.982), TLI (0.975), CFI (0.987), and RMSEA (0.085). Co-
variance between initial BMI value and rate of change was -3.48 (Figure 2).
4. Changes to Metabolic Syndrome
The number of people with biometric data indicating a likelihood of metabolic syndrome decreased after using the u-health service. After six months of u-health, subjects that showed one or more biometric indicator for metabolic syn- drome decreased by 24.5% (from 204 to 154 people). The number of people with two or more biometric indicators of metabolic syndrome decreased by 45.7% (from 151 to 82 people). The number of people with three or more biometric indicators decreased by 62.5% (from 88 to 33 people), and the number with four or more indicators decreased by 81.8%
(from 33 to six people). The number of people who showed five biometric indicators of metabolic syndrome decreased by 100% (from five to zero). Biometric data overall decreased more than 16%: high blood pressure decreased 73.5%, body fat 49.4%, HDL-C 35.4%, blood sugar 20.5%, and neutral fat 16.0% (Table 3).
5. Changes in Health Behavior
Drinking behavior improved owing to u-health services. The number of people who used to drink alcohol once or twice a week drank 49% and 63.3% less alcohol after three and six
Table 3. Changes of basic biometrics after u-health services
Group Waist circumference Triglycerides HDL-C Blood glucose Blood pressure
Before After Before After Before After Before After Before After
Sex Male 64 36 (56.2) 38 26 (68.4) 27 14 (51.9) 37 26 (70.3) 47 14 (29.8)
Female 108 51 (47.2) 43 42 (91.7) 21 17 (81.0) 41 36 (87.8) 55 13 (23.6)
Age (yr) ≥49 48 20 (41.7) 16 10 (62.5) 14 10 (71.4) 12 10 (83.3) 19 2 (10.5)
50-59 79 40 (50.6) 38 33 (86.8) 19 15 (78.9) 41 28 (68.3) 47 13 (27.7)
>60 45 27 (60.0) 27 25 (92.6) 15 6 (40.0) 25 24 (96.0) 36 12 (33.3)
Total 172 87 (50.6) 81 68 (16.0) 48 31 (64.6) 78 62 (79.5) 102 27 (26.5)
Values are presented as number (%), (After/Before) × 100.
Figure 2. Changing behavior of body mass index (BMI) by times after u-health services.
months respectively. People who used to drink three to five times a week also drank 22.2% less alcohol three months later and 37.0% less alcohol six months later. The number of people who used to drink six or seven times in a week also drank 10.0% and 40.0% less alcohol three and six months later, respectively (Table 4).
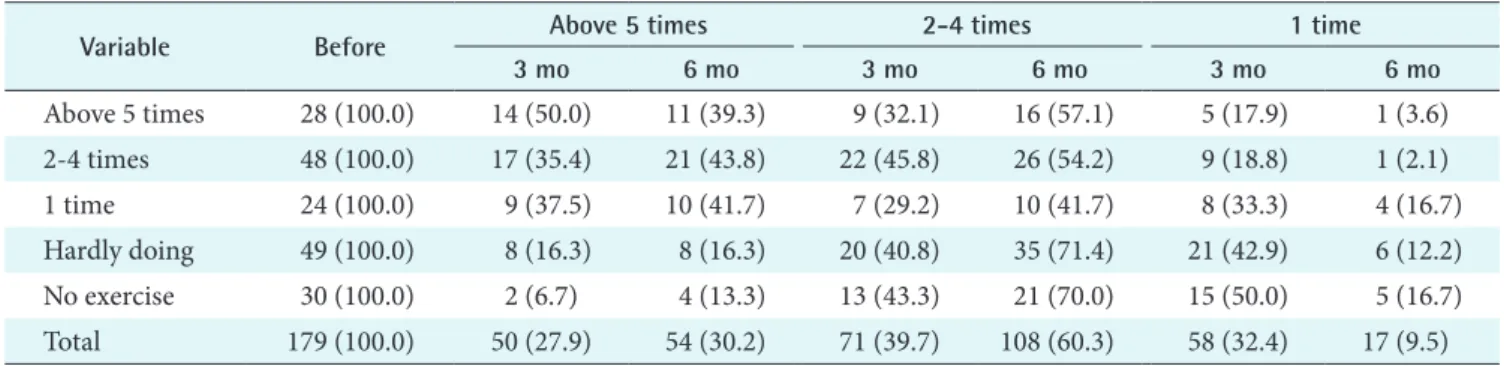
Although frequency of exercise showed less change than the drinking behavior, it also improved after u-health. Three months after beginning u-health, 50.0% of people who did not exercise before the service had started to exercise more than twice a week. Six months later, that figure was 83.3%
(Table 5).
With regard to smoking behavior, 79.3% of smokers had quit after three months and 39.1% after six months (Table 6).
IV. Discussion
This research has intended to reveal whether u-health ser- vices could be useful for improving and changing the health status and behavior of people who are living in South Ko- rean urban-rural complexes and diagnosed with metabolic syndrome. It was proven that u-health services are effective for managing the health status of people with metabolic syndrome, although there was not strong evidence for this
Table 4. Changes of drinking days per week after u-health services
Variable Before No drinking 1-2 days 3-5 days 6-7 days
3 mo 6 mo 3 mo 6 mo 3 mo 6 mo 3 mo 6 mo
No drinking 93 (100.0) 81 (87.1) 84 (90.3) 10 (10.8) 7 (7.5) 2 (2.2) 2 (2.2) - - 1-2 days 49 (100.0) 24 (49.0) 31 (63.3) 5 (10.2) 5 (10.2) 19 (38.8) 13 (26.5) 1 (2.0) - 3-5 days 27 (100.0) 6 (22.2) 10 (37.0) 3 (11.1) 3 (11.1) 16 (59.3) 12 (44.4) 2 (7.4) 2 (7.4) 6-7 days 10 (100.0) 1 (10.0) 4 (40.0) - 1 (10.0) 4 (40.0) 4 (40.0) 5 (50.0) 1 (10.0) Total 179 (100.0) 112 (62.6) 129 (72.1) 18 (10.1) 16 (8.9) 41 (22.9) 31 (17.3) 8 (4.5) 3 (1.7) Values are presented as number (%).
p < 0.001.
Table 5. Changes of exercise frequency per week after u-health services
Variable Before Above 5 times 2-4 times 1 time
3 mo 6 mo 3 mo 6 mo 3 mo 6 mo
Above 5 times 28 (100.0) 14 (50.0) 11 (39.3) 9 (32.1) 16 (57.1) 5 (17.9) 1 (3.6)
2-4 times 48 (100.0) 17 (35.4) 21 (43.8) 22 (45.8) 26 (54.2) 9 (18.8) 1 (2.1)
1 time 24 (100.0) 9 (37.5) 10 (41.7) 7 (29.2) 10 (41.7) 8 (33.3) 4 (16.7)
Hardly doing 49 (100.0) 8 (16.3) 8 (16.3) 20 (40.8) 35 (71.4) 21 (42.9) 6 (12.2)
No exercise 30 (100.0) 2 (6.7) 4 (13.3) 13 (43.3) 21 (70.0) 15 (50.0) 5 (16.7)
Total 179 (100.0) 50 (27.9) 54 (30.2) 71 (39.7) 108 (60.3) 58 (32.4) 17 (9.5)
Values are presented as number (%).
p < 0.001.
Table 6. Changes of smoking behavior after u-health services
Variable Before Smoking No smoking
3 mo 6 mo 3 mo 6 mo
Smoking 23 (100.0) 17 (79.3) 9 (39.1) 6 (26.1) 14 (60.9)
No smoking 154 (100.0) 2 (1.3) 2 (1.3) 152 (98.7) 152 (98.7)
Total 177 (100.0) 19 (10.7) 11 (6.2) 158 (89.3) 166 (93.8)
Values are presented as number (%).
p < 0.001.
in the previous research. Some previous research on diabetes showed a blood sugar decrease from 9.7% to 13.2% [1,7], but other research [16] showed no difference in it. In the context of hypertension, the u-health service was effective in promoting adherence to its plan [11]. It was proven that u-health was effective in ameliorating metabolic syndrome by decreasing HbA1C (Glycated hemoglobin), TC, TG, and HDL-C [14,15]. It has also been shown that u-health de- creases NRT adherence rate [16], HbA1C, TC, TG, HDL-C, waist size, weight, and BMI [11]. Therefore, we suggest that some u-health service models can effectively align with the offline healthcare programs or services in rural areas, includ- ing consulting or education services for patients who have chronic diseases, nonsmoking promotion services, personal- ized and visiting health-management services, preventive services for chronic diseases, emergency healthcare service for the aged living alone and for people with senile demen- tia, and care services for children who are obese.
There are differences in the settings between our u-health services and those in the previous research that did not show beneficial effects. We believe that u-health services with ap- propriate devices and systems can be useful and effective to manage the health of people with metabolic syndrome.
Some limitations of this study should be acknowledged.
The first limitation involves the fact that this study used a one-group posttest-only design, that is, we could not be sure of the pure effect of u-health services, because the influence of exogenous variables such as self-care, medical treatment, and other voluntary activities was not controlled for [20].
The second limitation is that we did not compare the results of the present study with those that can be gleaned by other methods.
The present study provides a case of effective management of metabolic syndrome using the u-health method. The find- ings indicate that real-time information and consultation about health status and behavior can be useful in managing metabolic syndrome. In particular, u-health systems played an important role in measuring bio-information using a u- health device, analyzing the information, and communicat- ing the results and implications to subjects. However, it is important for future research to compare this line of study to other candidate methods. Furthermore, research should also control for exogenous factors, as discussed above.
Conflict of Interest
No potential conflict of interest relevant to this article was reported.
References
1. Ahring KK, Ahring JP, Joyce C, Farid NR. Telephone modem access improves diabetes control in those with insulin-requiring diabetes. Diabetes Care 1992; 15: 971- 975.
2. Statistics Korea. Complete enumeration results of the 2010 population and housing census. Daejon, KR: Sta- tistics Korea; 2011.
3. Ekeland AG, Bowes A, Flottorp S. Effectiveness of tele- medicine: a systematic review of reviews. Int J Med In- form 2010; 79: 736-771.
4. BBC Research. Healthcare information system. Denver, CO: BBC Research; 2006.
5. Lee YT, Kim MS, Kim SH, Kim SY. A study of business strategy on U-health industry. Cheongwon, KR: Korea Health Industry Development Institute; 2010.
6. Benhamou PY, Melki V, Boizel R, Perreal F, Quesada JL, Bessieres-Lacombe S, Bosson JL, Halimi S, Hanaire H.
One-year efficacy and safety of Web-based follow-up using cellular phone in type 1 diabetic patients under insulin pump therapy: the PumpNet study. Diabetes Metab 2007; 33: 220-226.
7. Cho JH, Kwon HS, Yoon KH. Perspectives of "ubiqui- tous health care system" for diabetes management. J Korean Diabetes Assoc 2006; 30: 87-95.
8. Sacco WP, Morrison AD, Malone JI. A brief, regular, proactive telephone "coaching" intervention for dia- betes: rationale, description, and preliminary results. J Diabetes Complications 2004; 18: 113-118.
9. Vahatalo MA, Virtamo HE, Viikari JS, Ronnemaa T. Cel- lular phone transferred self blood glucose monitoring:
prerequisites for positive outcome. Pract Diabetes Int 2004: 21: 192-194.
10. Marquez Contreras E, de la Figuera von Wichmann M, Gil Guillen V, Ylla-Catala A, Figueras M, Balana M, Na- val J. Effectiveness of an intervention to provide infor- mation to patients with hypertension as short text mes- sages and reminders sent to their mobile phone (HTA- Alert). Aten Primaria 2004; 34: 399-405.
11. Park MJ, Kim HS, Kim KS. Cellular phone and internet- based individual intervention on blood pressure and obesity in obese patients with hypertension. Int J Med Inform 2009; 78: 704-710.
12. DeMaio J, Schwartz L, Cooley P, Tice A. The applica- tion of telemedicine technology to a directly observed therapy program for tuberculosis: a pilot project. Clin Infect Dis 2001; 33: 2082-2084.
13. Ostojic V, Cvoriscec B, Ostojic SB, Reznikoff D, Stipic- Markovic A, Tudjman Z. Improving asthma control through telemedicine: a study of short-message service.
Telemed J E Health 2005; 11: 28-35.
14. Kim HS, Song MS. Technological intervention for obese patients with type 2 diabetes. Appl Nurs Res 2008; 21:
84-89.
15. Kim SI, Kim HS. Effectiveness of mobile and internet intervention in patients with obese type 2 diabetes. Int J Med Inform 2008; 77: 399-404.
16. Brendreyen H, Kraft P. Happy ending: a randomized controlled trial of a digital multi-media smoking cessa- tion intervention. Addiction 2008; 103: 478-484.
17. Kim KH, Lee MO, Lee JG, Ryu S. Compliance of hyper- tensive patients registered in primary health care posts
implementing the Gangwon telemedicine service sys- tem. J Korean Soc Health Inf Health Stat 2008; 33: 59- 76.
18. Bergmo TS. Can economic evaluation in telemedicine be trusted? A systematic review of the literature. Cost Eff Resour Alloc 2009; 7: 18.
19. Expert Panel on Detection, Evaluation, and Treatment of High Blood Cholesterol in Adults. Executive sum- mary of the third report of the National Cholesterol Education Program (NCEP) Expert Panel on Detection, Evaluation, and Treatment of High Blood Cholesterol in Adults (Adult Treatment Panel III). JAMA 2001; 285:
2486-2497.
20. Chae SI. Survey methodology in social science. 3rd ed.
Seoul, KR: B&M Books; 2005.