D I A B E T E S & M E T A B O L I S M J O U R N A L
This is an Open Access article distributed under the terms of the Creative Commons At- tribution Non-Commercial License (http://creativecommons.org/licenses/by-nc/3.0/) which permits unrestricted non-commercial use, distribution, and reproduction in any medium, provided the original work is properly cited.
Diabetes Metab J 2015;39:498-506
Cardiovascular Disease Predicts Severe Hypoglycemia in Patients with Type 2 Diabetes
Jae-Seung Yun1, Seung-Hyun Ko1, Sun-Hye Ko1, Ki-Ho Song2, Ki-Dong Yoo3, Kun-Ho Yoon4, Yong-Moon Park5, Yu-Bae Ahn1
1Division of Endocrinology and Metabolism, Department of Internal Medicine, St. Vincent’s Hospital, College of Medicine, The Catholic University of Korea, Suwon,
2Division of Endocrinology and Metabolism, Department of Internal Medicine, Yeouido St. Mary’s Hospital, College of Medicine, The Catholic University of Korea, Seoul,
3Division of Cardiology, Department of Internal Medicine, St. Vincent’s Hospital, College of Medicine, The Catholic University of Korea, Suwon,
4Division of Endocrinology and Metabolism, Department of Internal Medicine, Seoul St. Mary’s Hospital, College of Medicine, The Catholic University of Korea, Seoul, Korea,
5Department of Epidemiology and Biostatistics, Arnold School of Public Health, University of South Carolina, Columbia, SC, USA
Background: To investigate whether a history of prior cardiovascular disease (CVD) is associated with severe hypoglycemia (SH) in patients with type 2 diabetes.
Methods: We conducted a prospective cohort study from January 2001 to December 2012 with a median follow-up time of 9.5 years (5,814 person-years). Patients aged 25 to 75 years with type 2 diabetes and without chronic kidney disease were enrolled (n=894), and 624 patients completed follow-up. SH was defined as hypoglycemic episodes requiring hospitalization or medical care in an emergency department. We used the Cox proportional hazards regression analysis to test associations between SH epi- sodes and potential explanatory variables.
Results: Among the 624 participants who completed follow-up, 60 patients (9.6%) had previous CVD. Compared to patients without CVD, patients with previous CVD were older, had a longer duration of diabetes and hypertension, received more insu- lin, and had more diabetic microvascular complications at baseline. During follow-up, 62 patients (9.9%) experienced at least one SH episode (incidence of 1.33 per 100 patient-years). The development of SH was associated with a history of CVD (hazard ratio, 1.99; 95% confidence interval, 1.07 to 3.72; P=0.031) after adjusting for sex, age, diabetic duration, hypertension, hemoglo- bin A1c levels, diabetic complications, cardiovascular autonomic neuropathy, and insulin use.
Conclusion: A history of CVD was an independent risk factor for the development of SH in patients with type 2 diabetes melli- tus. For patients with CVD, modulation of glycemic targets and diabetic education for the prevention of hypoglycemia should be implemented.
Keywords: Cardiovascular diseases; Diabetes mellitus, type 2; Severe hypoglycemia
Corresponding author: Yu-Bae Ahn
Division of Endocrinology and Metabolism, Department of Internal Medicine, St. Vincent’s Hospital, College of Medicine, The Catholic University of Korea, 93 Jungbu-daero, Paldal-gu, Suwon 16247, Korea
INTRODUCTION
After publication of the United Kingdom Prospective Diabetes Study, strict glycemic control for the prevention of diabetic complications was emphasized in patients with type 2 diabetes [1]. However, surprisingly, recently published large clinical tri- als such as the Action in Diabetes and Vascular Disease (AD-
VANCE), Action to Control Cardiovascular Risk in Diabetes (ACCORD), and the Veterans Affairs Diabetes Trial (VADT), failed to demonstrate that intensive glucose control improved primary cardiovascular outcomes in patients with type 2 dia- betes [2-4]. Notably, severe hypoglycemia (SH) requiring med- ical intervention and remarkable weight gain were reported to be the main factors associated with the limited benefits of gly- http://dx.doi.org/10.4093/dmj.2015.39.6.498
pISSN 2233-6079 · eISSN 2233-6087
cemic control [5,6]. On the basis of these results, recent clinical practice guidelines emphasize the need to individualize glyce- mic target goals [7-9] because accumulated results from car- diovascular trials have suggested that not all patients benefit from intensive glycemic treatment.
Hypoglycemia is a well-recognized side effect of diabetes treatment and is regarded as a major barrier to achieving glyce- mic targets in patients with type 2 diabetes [10], and the inci- dence of hypoglycemia has continued to increase. One system- atic review showed that the risk factors of further development of hypoglycemic events in subjects with type 2 diabetes includ- ed a history of hypoglycemia, renal insufficiency, longer diabe- tes duration, lower education level, race, history of dementia, and a history of microvascular complications [11]. A previous study comparing the incidence of SH over 10 years suggested that intensification of glycemic control led to a considerably higher incidence of SH [12,13]. According to the ADVANCE study, SH was strongly associated with increased risks of ad- verse clinical outcomes, including vascular events and death, in patients with long-standing type 2 diabetes [14]. Therefore, early detection and prevention of SH risk factors are clinically important.
Hypoglycemia is known to induce cardiovascular events [5].
Hypoglycemia has been suggested to have acute effects on sym- pathoadrenal activation, inflammation, increased platelet and neutrophil activation, and endothelial function, all of which have potential adverse cardiovascular effects [15,16]. In addi- tion, cardiac ischemia or fatal arrhythmia during hypoglycemia may be responsible for the increased risk of cardiovascular dis- ease (CVD) among patients with hypoglycemia [17]. There- fore, hypoglycemia may contribute directly to the increased risk of CVD and death, especially in elderly people with type 2 diabetes [18].
However, there is limited evidence supporting CVD history as a risk factor for SH [19-21]. Previously, we suggested that cardiovascular autonomic neuropathy (CAN) increases the risk of SH [22]. Thus, the current study attempted to investigate whether prior episodes of CVD were associated with an in- creased risk of SH, especially with regard to the effect of CAN, in a prospective cohort of patients with type 2 diabetes.
METHODS
Population
The methodology of this cohort study has been described pre-
viously [22]. From January 2001 to December 2002, 1,102 pa- tients aged 25 to 75 years with type 2 diabetes were consecu- tively recruited, and all patients underwent follow-up from January 2011 to December 2012 at the university-affiliated dia- betes center of St. Vincent’s Hospital in South Korea. Patients were excluded if they were older than 75 years, mentally ill, un- able to undertake self-care behaviors, had previously experi- enced SH, or had cognitive dysfunction, alcoholism, or any se- vere illness such as malignancy, severe infection, or liver cir- rhosis. Patients with renal impairment (estimated glomerular filtration rate [eGFR] <60 mL/min/1.73 m2) were also exclud- ed. This prospective cohort study was approved by the Institu- tional Review Board of St. Vincent’s Hospital, The Catholic University of Korea. The study was conducted in accordance with the Declaration of Helsinki. Written informed consents were obtained from all participants. All data were anonymized for analysis after collection.
Time frame for analysis
All of the participants were followed up every 3 to 6 months on an outpatient basis. If the patients visited an emergency de- partment or were hospitalized because of SH, we reviewed the medical records and identified the reason and diagnosis. The median follow-up period was 9.5 years. Two hundred forty- seven patients who did not receive follow-up care and 23 pa- tients who died during the follow-up period were excluded from the analyses.
Evaluation of previous cardiovascular disease
CVD was defined as a diagnosed history of coronary artery disease (CAD) or stroke. CAD was defined as either a diag- nosed history of angina pectoris, myocardial infarction, or coronary revascularization (coronary bypass surgery or coro- nary angioplasty). Stroke manifestations included previous transient ischemic attack or cerebral infarction. Diagnosis of clinically established CVD was based on verified medical re- cords, and the diagnosis was confirmed by a specialist (cardi- ologist, neurologist, or neurosurgeon).
Evaluation of severe hypoglycemia cases
The primary outcome of this study was the development of SH.
SH was defined as hypoglycemic episodes requiring the assis- tance of medical care in an emergency department or hospital- ization [23]. Our study was designed to observe if SH occurred spontaneously as part of the routine management of diabetes,
not as a consequence of intensive therapeutic intervention.
When the patients visited the outpatient clinic during regu- lar follow-up, the physician asked whether they had experi- enced SH episodes or visited an emergency department be- cause of SH. We also investigated the SH events of patients in our emergency department each day. If patients reported their hypoglycemic episodes or visited our emergency department as a result of SH, we obtained clinical information, such as the presence of signs or symptoms, blood glucose levels, probable causes of events, and type and dosage of current hypoglycemic medications, from the patients’ history and/or objective medi- cal records and confirmed the occurrence of an SH event. If patients did not visit our clinic for any reason, we attempted to contact the patient by telephone or electronic mail to evaluate the occurrence of SH.
Assessment of risk factors
A detailed questionnaire was used to obtain participant infor- mation, including medical history, current cigarette smoking status, and the use of medications. The patients’ height and weight were measured to determine their body mass index. Hy- pertension was defined as systolic blood pressure ≥140 mm Hg, diastolic blood pressure ≥90 mm Hg, or the use of antihyper- tensive medications. Blood samples were collected from all sub- jects after they had fasted for 12 hours, and lipid parameters (to- tal cholesterol, triglycerides, and high density lipoprotein cho- lesterol), blood glucose levels, and glycosylated hemoglobin (HbA1c) levels were also measured. Fasting and 2-hour post- prandial plasma glucose levels were measured using an auto- mated enzymatic method. The HbA1c level was measured by high-performance liquid chromatography with a reference range of 4.4% to 6.4% (Bio-Rad, Montreal, QC, Canada) every 6 months to evaluate the status of glycemic control during the fol- low-up period. The blood lipid concentrations for total choles- terol, triglycerides, and high density lipoprotein cholesterol were measured enzymatically using an automatic analyzer (model 736-40; Hitachi, Tokyo, Japan). The eGFR was used to deter- mine the chronic kidney disease classification using the 4-com- ponent Modification of Diet in Renal Disease equation [24].
Diabetic retinopathy was assessed from retinal photographs at baseline, and the findings were reviewed by an ophthalmolo- gist. Retinal findings were classified as either the absence or presence of diabetic retinopathy. Diabetic nephropathy was con- sidered if a patient was found to have microalbuminuria (30 to 300 mg/day) or macroalbuminuria (≥300 mg/day). The urinary
albumin excretion rate was measured from a 24-hour urine col- lection using immunoturbidimetry (Eiken, Tokyo, Japan).
A cardiovascular autonomic function test using the Ewing method was performed by a single examiner during the record- ing of a continuous electrocardiogram, and the RR intervals were recorded. The cardiovascular test included measurement of heart rate variability, including the expiration-to-inspiration (E/I) ratio, responses to the Valsalva maneuver, and postural change from lying to standing [17,25]. The patients were asked to fast for 12 hours before the autonomic function test and to avoid taking insulin, antidepressants, neuroleptic agents, caf- feine, nicotine, antihistamines, or sympatholytic drugs. An E/I ratio below the age-related reference value, a Valsalva ratio of
<1.2, and a posture ratio of <1.03 were considered abnormal.
Each of the three ratios described above were scored as either normal (0) or abnormal (1), for a total maximum score of 3.
The staging of CAN was confirmed as follows: a score of 0 was defined as normal autonomic function; a score of 1 was defined as early CAN; and a score of at least 2 was defined as a definite diagnosis of CAN [17,25,26].
Statistical analysis
All results are expressed as the mean±standard deviation or as proportions. P<0.05 was considered significant. Chi-square tests were used to test differences in the proportion of categori- cal variables, and independent Student t-tests were used for evaluating the difference between the mean of two continuous variables. If a patient had multiple SH events, the first recorded event was used in this analysis. After verifying the proportional hazards assumption by means of log-minus log-survival plots and testing with the methods described elsewhere [27], we used Cox proportional hazards regression analysis to test asso- ciations between the outcome (SH episodes) and potential ex- planatory variables. The relationships were analyzed after ad- justment for the following prognostic factors: sex, age, duration of diabetes, presence of hypertension, diabetic retinopathy or nephropathy, mean HbA1c throughout the study, CAN, and the use of insulin, angiotensin-converting-enzyme inhibitors (ACEi), angiotensin receptor blockers (ARBs), or β-blockers.
The results are presented as hazard ratios (HRs) and 95% confi- dence intervals (CIs). Statistical analyses were performed using SAS version 9.2 (SAS Institute, Cary, NC, USA).
RESULTS
Clinical characteristics
Among the 1,102 patients who were recruited, 208 patients were excluded. Of the 894 patients who were enrolled in the study, 624 (69.8%) completed the follow-up. The median follow-up time was 9.5 years (5,814 person-years of follow-up). The mean age and diabetic duration of patients who completed follow-up were 54.5±9.9 and 8.9±6.4 years, respectively. Among the pa- tients who completed follow-up, 60 patients (9.6%) had a pre- vious history of CVD (27 [4.3%] had a stroke, 39 [6.5%] had
CAD, six [1.0%] had a disease history of both stroke and CAD) at baseline. There were no significant differences between the participants who completed the follow-up evaluation and those who did not with respect to sex ratio (P=0.921), age (54.5±9.9 years vs. 54.7±10.6 years, P=0.783), diabetes duration (8.9±6.3 years vs. 7.9±7.6 years, P=0.063), presence of hypertension (P=0.481), or history of prior CVD (P=0.212). However, base- line HbA1c levels were significantly lower among those who completed follow-up (8.61%±1.96% vs. 9.03%±2.15%, P=0.005).
Compared to patients without CVD, those with CVD were older, had a longer duration of diabetes and hypertension, and Table 1. Comparison of baseline parameters between the patients with and without cardiovascular disease
Parameter Total CVD (–) CVD (+) P value
Number 624 564 60
Women 372 (59.6) 341 (60.5) 31 (51.7) 0.187
Age, yr 54.5±10.1 54.0±10.1 58.9±8.0 <0.001
Diabetes duration, yr 8.9±6.3 8.6±6.1 11.6±7.5 0.001
Hypertension 250 (40.1) 211 (37.4) 39 (65.0) <0.001
Smoking 141 (22.6) 124 (22.0) 17 (28.8) 0.233
Diabetes treatment
Insulin 167 (26.8) 143 (25.4) 24 (40.0) 0.015
Sulfonylurea 384 (61.5) 351 (62.2) 33 (55.0) 0.274
Hypertension treatment
ACEi 163 (26.1) 135 (23.9) 28 (46.7) <0.001
β-Blocker 26 (4.2) 18 (3.2) 8 (13.3) <0.001
Diabetic retinopathy 181 (29.0) 154 (27.3) 27 (45.0) 0.004
Diabetic nephropathy 135 (21.6) 116 (20.6) 19 (31.7) 0.047
Laboratory findings at baseline
Fasting plasma glucose, mmol/L 9.17±3.23 9.20±3.24 8.94±3.18 0.554
Postprandial 2-hour plasma glucose, mmol/L 15.57±5.43 15.55±5.44 15.89±5.32 0.675
Creatinine, μmol/L 69.8±15.9 69.0±15.9 76.9±16.8 0.001
Baseline HbA1c, % 8.6±2.0 8.6±2.0 8.8±2.0 0.488
Total cholesterol, mmol/L 4.72±0.93 4.70±0.92 4.84±0.99 0.279
Triglycerides, mmol/L 1.74±1.07 1.73±1.06 1.80±1.22 0.611
HDL-C, mmol/L 1.12±0.29 1.12±0.29 1.08±0.28 0.270
LDL-C, mmol/L 2.83±0.80 2.82±0.79 2.97±0.89 0.158
Cardiovascular autonomic neuropathy <0.001
Normal 428 (68.6) 396 (70.2) 32 (53.3)
Early 99 (15.9) 93 (16.5) 6 (10.0)
Definite 97 (15.5) 75 (13.3) 22 (36.7)
Values are presented as number (%) or mean±standard deviation.
ACEi, angiotensin-converting-enzyme inhibitor; HbA1c, glycosylated hemoglobin; HDL-C, high density lipoprotein cholesterol; LDL-C, low density lipoprotein cholesterol.
used more insulin, ACEi, and β-blockers at baseline. The pa- tients with CVD had a higher incidence of diabetic retinopathy and nephropathy. Regarding CAN, 196 patients (31.4%) had CAN at baseline. More patients with CVD had CAN than did those without CVD (46.7% vs. 29.8%, P<0.001). In the group with a CVD history, we observed a lower eGFR, but it was within the normal range. There were no differences in the pa- rameters of baseline HbA1c and lipid profiles between the two groups (Table 1).
Incidence of severe hypoglycemia
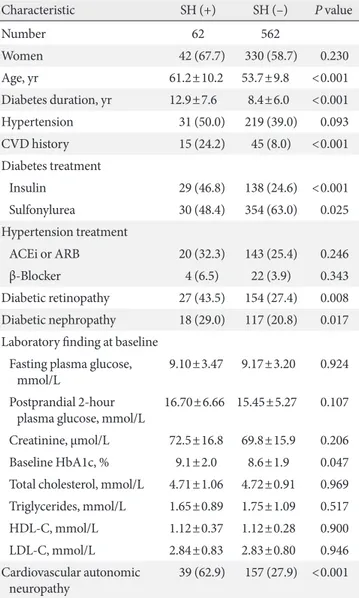
During the follow-up period, 62 patients (9.9%) experienced at least one episode of SH, with an incidence rate of 1.33 per 100 patient-years. When analyzed by age group, the incidence of SH was higher in the older age groups (5.8%, 4.4%, 6.8%, 15.0%, and 38.2% in the under 40, 41 to 50, 51 to 60, 61 to 70, and over 70 age groups, respectively; P for trend <0.001). Compared to patients without SH, those with SH had a longer duration of di- abetes and used more insulin and ACEi at baseline. The pa- tients with SH had more microvascular complications, such as retinopathy and nephropathy. Patients with SH showed signifi- cantly more CAN compared to patients without SH at baseline (SH (+) vs. SH (−), 62.9% vs. 27.9%; P<0.001). Notably, patients with a CVD history at baseline experienced SH events three times more frequently than patients without a history of CVD (24.2% vs. 8.0%, P<0.001) (Table 2).
The most common presenting symptom of SH was decreased mental status, such as coma or stupor (44.9%), and the most Table 2. Baseline characteristics of the groups with and with-
out severe hypoglycemia
Characteristic SH (+) SH (–) P value
Number 62 562
Women 42 (67.7) 330 (58.7) 0.230
Age, yr 61.2±10.2 53.7±9.8 <0.001
Diabetes duration, yr 12.9±7.6 8.4±6.0 <0.001
Hypertension 31 (50.0) 219 (39.0) 0.093
CVD history 15 (24.2) 45 (8.0) <0.001
Diabetes treatment
Insulin 29 (46.8) 138 (24.6) <0.001 Sulfonylurea 30 (48.4) 354 (63.0) 0.025 Hypertension treatment
ACEi or ARB 20 (32.3) 143 (25.4) 0.246
β-Blocker 4 (6.5) 22 (3.9) 0.343
Diabetic retinopathy 27 (43.5) 154 (27.4) 0.008 Diabetic nephropathy 18 (29.0) 117 (20.8) 0.017 Laboratory finding at baseline
Fasting plasma glucose,
mmol/L 9.10±3.47 9.17±3.20 0.924
Postprandial 2-hour
plasma glucose, mmol/L 16.70±6.66 15.45±5.27 0.107 Creatinine, μmol/L 72.5±16.8 69.8±15.9 0.206 Baseline HbA1c, % 9.1±2.0 8.6±1.9 0.047 Total cholesterol, mmol/L 4.71±1.06 4.72±0.91 0.969 Triglycerides, mmol/L 1.65±0.89 1.75±1.09 0.517 HDL-C, mmol/L 1.12±0.37 1.12±0.28 0.900 LDL-C, mmol/L 2.84±0.83 2.83±0.80 0.946 Cardiovascular autonomic
neuropathy 39 (62.9) 157 (27.9) <0.001 Values are presented as number (%) or mean±standard deviation.
CVD, cardiovascular disease; ACEi, angiotensin-converting-enzyme inhibitor; ARB, angiotensin receptor blocker; HbA1c, glycosylated hemoglobin; HDL-C, high density lipoprotein cholesterol; LDL-C, low density lipoprotein cholesterol.
Table 3. Univariable Cox hazard regression model for the pre- dictable risk of severe hypoglycemia
Hazard ratio (95% CI) P value
Female sex 1.49 (0.87–2.56) 0.149
Age (per 10 years) 2.26 (1.68–3.04) <0.001
Diabetes duration, yr <0.001
<5 1.00
5–9 2.22 (0.99–4.97) 0.054
≥10 4.18 (2.01–8.71) <0.001
CVD history (yes or no) 3.16 (1.76–5.70) <0.001 Insulin use (yes or no) 2.62 (1.58–4.32) <0.001 β-Blocker use (yes or no) 1.61 (0.58–4.44) 0.357 ACEi/ARB (yes vs. no) 1.50 (0.88–2.56) 0.137 HbA1c, %
<7.0 1.00
≥7.0 1.26 (0.60–2.66) 0.539
Diabetic retinopathy (yes vs. no) 1.99 (1.20–3.29) 0.008 Diabetic nephropathy (yes vs. no) 1.60 (0.92–2.77) 0.095 Cardiovascular autonomic
neuropathy
Normal 1.00
Early 2.73 (1.44–5.20) 0.002
Definite 4.49 (2.50–8.05) <0.001
CI, confidence interval; CVD, cardiovascular disease; ACEi, angio- tensin-converting-enzyme inhibitor; ARB, angiotensin receptor blocker; HbA1c, glycosylated hemoglobin.
common precipitating cause was missing a meal (41.9%).
Twelve patients (19.4%) in the SH group experienced recurrent SH episodes. Twenty patients (32.3%) had antecedent hypogly- cemia within 3 or 6 months of SH events. There were no signifi- cant differences in insulin dose by weight (0.64±0.29 IU/kg vs.
0.67±0.33 IU/kg, P=0.757) and type of insulin (P=0.612) at the severe hypoglycemic event between the patients with and without prior CVD history.
Association with confounding factors
Univariate Cox hazard regression analysis revealed that age, dura- tion of diabetes, history of CVD, use of insulin, and diabetic reti- nopathy were significantly associated with SH events (Table 3).
However, glycemic control status or type of antihypertensive medication did not show any association with SH. In multivariate analysis, after adjustment for age, sex, diabetes duration, presence of hypertension, mean HbA1c, diabetic complications, and the use of insulin, ARB/ACEi, or β-blockers, the patients with a his- tory of CVD exhibited a 1.90 times higher SH risk than those without a CVD history (Table 4).
In the next step, we further evaluated the relationship between a history of CVD and SH using cardiovascular autonomic dys- function as an additional confounder. Additional multivariate analysis combined with CAN stage revealed that a CVD history at enrollment remained a significant prognostic factor for the development of SH (HR, 1.99; 95% CI, 1.07 to 3.72; P=0.031) (model 4 in Table 4).
DISCUSSION
In this study, we demonstrated that previous episodes of CVD
were associated with future development of SH in patients with type 2 diabetes. Specifically, patients with a history of CVD had a two times higher risk of SH during the 10-year follow-up pe- riod compared to those patients without a CVD history. The results were independent of glycemic control status, diabetic duration, age, diabetic complications, use of insulin, or pres- ence of cardiovascular autonomic dysfunction.
Currently, three large clinical trials (the ADVANCE, AC- CORD, and VADT trials) have investigated whether intensive glycemic control could improve cardiovascular outcomes.
None of these trials demonstrated cardiovascular benefits in the intensive glycemic control group [2,3,28]. Moreover, the inten- sive glycemic control group was found to have more episodes of SH and weight gain, which were related to an increased risk of CVD. In a meta-analysis, participants in the intensive glycemic control group experienced SH events 2.5 times more frequently (95% CI, 1.9 to 3.2) than did those in the control group [29].
Another study including 903,510 people with type 2 diabetes and the ADVANCE study (n=11,140) both showed that SH was associated with more than twice the risk of CVD [14,15].
Therefore, avoiding SH is important in the prevention of CVD in patients with type 2 diabetes.
In a previously reported retrospective case-control study, pa- tient groups with CAD and stroke had 1.48 and 2.78 times higher risk of SH than control groups, respectively [21]. One retrospective study in patients with type 2 diabetes who were hospitalized for SH found that those with recurrent hypoglyce- mia had a significantly higher prevalence of CAD (odds ratio, 2.30; 95% CI, 1.04 to 5.10) compared to the non-recurrent group [30]. Another case-control study showed that patients with CAD had a 2.38 times higher relative risk for developing SH [20]. One nested case-control study in patients with type 2 diabetes revealed that CAD was present in 21.0% of hypoglyce- mia hospitalization cases compared with 7.8% of control cases (adjusted odds ratio, 1.48; 95% CI, 1.21 to 1.81) [31]. However, these reports had the limitations of being retrospective or case- control studies.
Our prospective cohort study revealed that the incidence of SH was approximately two times higher in patients with a CVD history than in those without a CVD history, after adjusting for several confounding factors. However, there are no known mechanisms by which CVD could increase the risk of future SH in patients with type 2 diabetes. There are two known main mechanisms for a normal response to hypoglycemia [32,33]:
one is a consecutive decrease in insulin secretion and an in- Table 4. Multivariable Cox hazards regression model for the
predictable risk of severe hypoglycemia Hazard ratio (95% CI)
Model 1 Model 2 Model 3 Model 4 CVD history 2.41
(1.32–4.40) 2.13
(1.16–3.93) 1.90
(1.01–3.57) 1.99 (1.07–3.72)
P value 0.004 0.015 0.038 0.031
Multivariable cox regression models were adjusted as follows: model 1, sex, age; model 2, model 1+diabetes duration, hypertension, mean hemoglobin A1c, diabetic nephropathy, diabetic retinopathy; model 3, model 2+insulin, angiotensin-converting-enzyme inhibitor or an- giotensin receptor blocker, β-blocker; model 4, model 2+insulin, car- diovascular autonomic neuropathy stage.
CI, confidence interval; CVD, cardiovascular disease.
crease in counter-regulatory hormone secretion, such as gluca- gon or adrenomedullary epinephrine, and the other is subjec- tive recognition of the hypoglycemia by autonomic nervous function. In patients with CVD, sympathetic activation and catecholamine release during hypoglycemic events usually ac- company tachycardia and elevation of blood pressure [34]. If myocardial damage or dysfunctional sympathetic innervations preexisted in patients with CVD, hypoglycemia could not be easily recognized by patients themselves. Moreover, if hypogly- cemic episodes are repeated and aggravated, hypoglycemia un- awareness may occur. In addition, preservation of whole-brain glucose uptake during hypoglycemia is different between pa- tients with tightly controlled diabetes and nondiabetic subjects [35]. Hypoglycemia counter-regulation is at least partly trig- gered by a glucose-sensitive brain region. Therefore, the brain must be responsible for adaptation to hypoglycemic events to some degree [36]. If this glucose-sensitive region of the brain is damaged by ischemic events, the response to hypoglycemia may be blunted in patients with diabetes.
CAN is associated with impaired recognition of hypoglyce- mia and impaired recovery from hypoglycemia because of de- fective endocrine counter-regulatory mechanisms [37,38]. It is well known that CAN may affect the occurrence of CVD events in patients with diabetes. Initially, we hypothesized that CAN is one of the main linkage mechanisms between CVD and the development of SH. However, in our analysis, CVD remained a significant independent prognostic factor for SH after adjusting for the presence of CAN. Furthermore, antihypertensive medi- cations, such as β-blockers, which may mask the symptoms of hypoglycemia, did not influence the risk of SH in this study.
Thus, determining the mechanism for the association between CVD and risk of SH calls for further well-designed studies.
The main strengths of our study were the long-term, well- characterized prospective approach in a large hospital-based cohort, in addition to our use of multivariate analysis to ascer- tain the risk factors of SH in patients with type 2 diabetes. In addition, SH episodes were defined from the medical records of our emergency department or outpatient clinic. Even if the patients visited other hospitals, we reviewed all medical records describing their SH episodes and confirmed the events.
However, there are some limitations to this study. First, the number of CVD patients among the patients who completed the follow-up was relatively small (approximately 10% of the total population), and this may have introduced a selection bias. Second, exclusion of patients with renal insufficiency may
also explain the relatively small number of CVD patients at baseline, although this exclusion contributed to increasing in- ternal validity. Third, this cohort study was composed entirely of an Asian population. More studies are needed to apply this finding to other ethnic groups. Last, peripheral artery disease and carotid endarterectomy were not included in the definition of CVD. We measured the ankle-brachial index but could not routinely confirm peripheral artery disease using a lower ex- tremity ultrasonogram or angiography on an outpatient basis.
In summary, we demonstrated that the risk of SH was high- er in patients with a history of CVD. The patients with estab- lished vascular complications such as CVD were found to have a high risk of developing SH. Diabetic education for the pre- vention of hypoglycemia should be emphasized for patients with previous CVD. Moreover, additional studies are needed to clarify the underlying mechanisms linking CVD and SH.
CONFLICTS OF INTEREST
No potential conflict of interest relevant to this article was re- ported.
ACKNOWLEDGMENTS
The authors thank Y.O. Cho and S.R. Jung (St. Vincent’s Hos- pital, College of Medicine, The Catholic University of Korea) for their technical assistance.
REFERENCES
1. Stratton IM, Adler AI, Neil HA, Matthews DR, Manley SE, Cull CA, Hadden D, Turner RC, Holman RR. Association of glycaemia with macrovascular and microvascular complica- tions of type 2 diabetes (UKPDS 35): prospective observation- al study. BMJ 2000;321:405-12.
2. Action to Control Cardiovascular Risk in Diabetes Study Group, Gerstein HC, Miller ME, Byington RP, Goff DC Jr, Bigger JT, Buse JB, Cushman WC, Genuth S, Ismail-Beigi F, Grimm RH Jr, Probstfield JL, Simons-Morton DG, Friedewald WT. Effects of intensive glucose lowering in type 2 diabetes. N Engl J Med 2008;358:2545-59.
3. ADVANCE Collaborative Group, Patel A, MacMahon S, Chalmers J, Neal B, Billot L, Woodward M, Marre M, Cooper M, Glasziou P, Grobbee D, Hamet P, Harrap S, Heller S, Liu L, Mancia G, Mogensen CE, Pan C, Poulter N, Rodgers A, Wil-
liams B, Bompoint S, de Galan BE, Joshi R, Travert F. Intensive blood glucose control and vascular outcomes in patients with type 2 diabetes. N Engl J Med 2008;358:2560-72.
4. Duckworth W, Abraira C, Moritz T, Reda D, Emanuele N, Reaven PD, Zieve FJ, Marks J, Davis SN, Hayward R, Warren SR, Goldman S, McCarren M, Vitek ME, Henderson WG, Huang GD; VADT Investigators. Glucose control and vascular complications in veterans with type 2 diabetes. N Engl J Med 2009;360:129-39.
5. Yakubovich N, Gerstein HC. Serious cardiovascular outcomes in diabetes: the role of hypoglycemia. Circulation 2011;123:
342-8.
6. Norris SL, Zhang X, Avenell A, Gregg E, Schmid CH, Kim C, Lau J. Efficacy of pharmacotherapy for weight loss in adults with type 2 diabetes mellitus: a meta-analysis. Arch Intern Med 2004;164:1395-404.
7. American Diabetes Association. Standards of medical care in diabetes: 2014. Diabetes Care 2014;37 Suppl 1:S14-80.
8. Inzucchi SE, Bergenstal RM, Buse JB, Diamant M, Ferrannini E, Nauck M, Peters AL, Tsapas A, Wender R, Matthews DR. Man- agement of hyperglycaemia in type 2 diabetes: a patient-cen- tered approach. Position statement of the American Diabetes Association (ADA) and the European Association for the Study of Diabetes (EASD). Diabetologia 2012;55:1577-96.
9. Ko SH, Kim SR, Kim DJ, Oh SJ, Lee HJ, Shim KH, Woo MH, Kim JY, Kim NH, Kim JT, Kim CH, Kim HJ, Jeong IK, Hong EK, Cho JH, Mok JO, Yoon KH; Committee of Clinical Practice Guidelines, Korean Diabetes Association. 2011 Clinical prac- tice guidelines for type 2 diabetes in Korea. Diabetes Metab J 2011;35:431-6.
10. Cryer PE. Hypoglycaemia: the limiting factor in the glycaemic management of type I and type II diabetes. Diabetologia 2002;
45:937-48.
11. Bloomfield HE, Greer N, Newman D, MacDonald R, Carlyle M, Fitzgerald P, Rutks I, Wilt TJ. Predictors and consequences of severe hypoglycemia in adults with diabetes: a systematic review of the evidence. Washington, DC: Department of Vet- erans Affairs; 2012.
12. Ginde AA, Espinola JA, Camargo CA Jr. Trends and dispari- ties in U.S. emergency department visits for hypoglycemia, 1993-2005. Diabetes Care 2008;31:511-3.
13. Kim JT, Oh TJ, Lee YA, Bae JH, Kim HJ, Jung HS, Cho YM, Park KS, Lim S, Jang HC, Lee HK. Increasing trend in the num- ber of severe hypoglycemia patients in Korea. Diabetes Metab J 2011;35:166-72.
14. Zoungas S, Patel A, Chalmers J, de Galan BE, Li Q, Billot L, Woodward M, Ninomiya T, Neal B, MacMahon S, Grobbee DE, Kengne AP, Marre M, Heller S; ADVANCE Collaborative Group. Severe hypoglycemia and risks of vascular events and death. N Engl J Med 2010;363:1410-8.
15. Goto A, Arah OA, Goto M, Terauchi Y, Noda M. Severe hypo- glycaemia and cardiovascular disease: systematic review and meta-analysis with bias analysis. BMJ 2013;347:f4533.
16. ORIGIN Trial Investigators, Mellbin LG, Ryden L, Riddle MC, Probstfield J, Rosenstock J, Diaz R, Yusuf S, Gerstein HC. Does hypoglycaemia increase the risk of cardiovascular events? A report from the ORIGIN trial. Eur Heart J 2013;34:3137-44.
17. Vinik AI, Maser RE, Mitchell BD, Freeman R. Diabetic auto- nomic neuropathy. Diabetes Care 2003;26:1553-79.
18. Giorgino F, Leonardini A, Laviola L. Cardiovascular disease and glycemic control in type 2 diabetes: now that the dust is settling from large clinical trials. Ann N Y Acad Sci 2013;1281:
36-50.
19. Akram K, Pedersen-Bjergaard U, Carstensen B, Borch-John- sen K, Thorsteinsson B. Frequency and risk factors of severe hypoglycaemia in insulin-treated type 2 diabetes: a cross-sec- tional survey. Diabet Med 2006;23:750-6.
20. Holstein A, Hahn M, Patzer O, Seeringer A, Kovacs P, Stingl J.
Impact of clinical factors and CYP2C9 variants for the risk of severe sulfonylurea-induced hypoglycemia. Eur J Clin Phar- macol 2011;67:471-6.
21. Quilliam BJ, Simeone JC, Ozbay AB. Risk factors for hypogly- cemia-related hospitalization in patients with type 2 diabetes:
a nested case-control study. Clin Ther 2011;33:1781-91.
22. Yun JS, Kim JH, Song KH, Ahn YB, Yoon KH, Yoo KD, Park YM, Ko SH. Cardiovascular autonomic dysfunction predicts severe hypoglycemia in patients with type 2 diabetes: a 10-year follow-up study. Diabetes Care 2014;37:235-41.
23. Workgroup on Hypoglycemia, American Diabetes Associa- tion. Defining and reporting hypoglycemia in diabetes: a re- port from the American Diabetes Association Workgroup on Hypoglycemia. Diabetes Care 2005;28:1245-9.
24. Levey AS, Bosch JP, Lewis JB, Greene T, Rogers N, Roth D. A more accurate method to estimate glomerular filtration rate from serum creatinine: a new prediction equation. Modifica- tion of Diet in Renal Disease Study Group. Ann Intern Med 1999;130:461-70.
25. Vinik AI, Ziegler D. Diabetic cardiovascular autonomic neu- ropathy. Circulation 2007;115:387-97.
26. Tesfaye S, Boulton AJ, Dyck PJ, Freeman R, Horowitz M, Kem-
pler P, Lauria G, Malik RA, Spallone V, Vinik A, Bernardi L, Valensi P; Toronto Diabetic Neuropathy Expert Group. Diabet- ic neuropathies: update on definitions, diagnostic criteria, esti- mation of severity, and treatments. Diabetes Care 2010;33:
2285-93.
27. Grambsch PM, Therneau TM. Proportional hazards tests and diagnostics based on weighted residuals. Biometrika 1994;81:
515-26.
28. Abraira C, Duckworth W, McCarren M, Emanuele N, Arca D, Reda D, Henderson W; VA Cooperative Study of Glycemic Control and Complications in Diabetes Mellitus Type 2. Design of the cooperative study on glycemic control and complications in diabetes mellitus type 2: Veterans Affairs Diabetes Trial. J Di- abetes Complications 2003;17:314-22.
29. Control G, Turnbull FM, Abraira C, Anderson RJ, Byington RP, Chalmers JP, Duckworth WC, Evans GW, Gerstein HC, Hol- man RR, Moritz TE, Neal BC, Ninomiya T, Patel AA, Paul SK, Travert F, Woodward M. Intensive glucose control and macro- vascular outcomes in type 2 diabetes. Diabetologia 2009;52:
2288-98.
30. Lin YY, Hsu CW, Sheu WH, Chu SJ, Wu CP, Tsai SH. Risk fac- tors for recurrent hypoglycemia in hospitalized diabetic pa- tients admitted for severe hypoglycemia. Yonsei Med J 2010;
51:367-74.
31. Fadini GP, Rigato M, Tiengo A, Avogaro A. Characteristics and mortality of type 2 diabetic patients hospitalized for severe iat-
rogenic hypoglycemia. Diabetes Res Clin Pract 2009;84:267-72.
32. Cryer PE. Mechanisms of hypoglycemia-associated autonomic failure in diabetes. N Engl J Med 2013;369:362-72.
33. Yun JS, Ko SH. Avoiding or coping with severe hypoglycemia in patients with type 2 diabetes. Korean J Intern Med 2015;30:
6-16.
34. Snell-Bergeon JK, Wadwa RP. Hypoglycemia, diabetes, and cardiovascular disease. Diabetes Technol Ther 2012;14 Suppl 1:
S51-8.
35. Boyle PJ, Kempers SF, O’Connor AM, Nagy RJ. Brain glucose uptake and unawareness of hypoglycemia in patients with in- sulin-dependent diabetes mellitus. N Engl J Med 1995;333:
1726-31.
36. Selvarajah D, Tesfaye S. Central nervous system involvement in diabetes mellitus. Curr Diab Rep 2006;6:431-8.
37. Bottini P, Boschetti E, Pampanelli S, Ciofetta M, Del Sindaco P, Scionti L, Brunetti P, Bolli GB. Contribution of autonomic neu- ropathy to reduced plasma adrenaline responses to hypoglyce- mia in IDDM: evidence for a nonselective defect. Diabetes 1997;
46:814-23.
38. Spallone V, Ziegler D, Freeman R, Bernardi L, Frontoni S, Pop- Busui R, Stevens M, Kempler P, Hilsted J, Tesfaye S, Low P, Va- lensi P; Toronto Consensus Panel on Diabetic Neuropathy.
Cardiovascular autonomic neuropathy in diabetes: clinical im- pact, assessment, diagnosis, and management. Diabetes Metab Res Rev 2011;27:639-53.