* Research Scientist, Spatial Science Laboratory, Texas A&M University, College Station, TX, USA, [email protected]
The Impacts on Flow by Hydrological Model with NEXRAD Data: A Case Study on a small Watershed in Texas, USA
Taesoo Lee*
레이더 강수량 데이터가 수문모델링에서 수량에 미치는 영향 -미국 텍사스의 한 유역을 사례로-
이태수*
Abstract:The accuracy of rainfall data for a hydrological modeling study is important. NEXRAD (Next Generation Radar) rainfall data estimated by WRS-88D (Weather Surveillance Radar - 1988 Doppler) radar system has advantages of its finer spatial and temporal resolution. In this study, NEXRAD rainfall data was tested and compared with conventional weather station data using the previously calibrated SWAT (Soil and Water Assessment Tool) model to identify local storms and to analyze the impacts on hydrology. The previous study used NEXRAD data from the year of 2000 and the NEXRAD data was substituted with weather station data in the model simulation in this study. In a selected watershed and a selected year (2006), rainfall data between two datasets showed discrepancies mainly due to the distance between weather station and study area. The largest difference between two datasets was 94.5 mm (NEXRAD was larger) and 71.6 mm (weather station was larger) respectively. The differences indicate that either recorded rainfalls were occurred mostly out of the study area or local storms only in the study area. The flow output from the study area was also compared with observed data, and modeled flow agreed much better when the simulation used NEXRAD data.
Key Words : Local storm, NEXRAD, Radar, Rainfall, SWAT
요약:강수량 데이터의 정확성은 수리모델링에서 중요하다. WRS-88D (Weather Surveillance Radar - 1988 Doppler) 레이더 시스 템에서 예측하는 NEXRAD (Next Generation Radar) 강수량 데이터는 높은 시, 공간 해상도를 갖는 데이터라는 장점이 있다. 이 연 구에서는 검증된SWAT (Soil and Water Assessment Tool) 모델을 이용한 이 전의 연구를 바탕으로 일반 기상관측소와 NEXRAD 강 수량 데이터를 비교하여 국지적 강우와 그 강우가 유출량에 미치는 영향에 대해 분석하였다. 이 연구에서는 NEXRAD 강수량 데이터 를 이용한 선행 연구에 기상관측소의 데이터를 대체하여 시뮬레이션을 함으로써 그 차이를 알아 보고자 하였다. 한 유역과 1년간의 데이터를 선정하여 비교 분석한 결과 두 강수량 데이터는 큰 차이를 보였다. 이는 기상관측소의 위치가 연구지역과 거리가 있기 때문 이다. 가장 큰 강수량의 차이를 보일 때는 그 차이가 94.5mm (NEXRAD 데이터가 더 큰 경우) 와 71.6mm (기상 관측소의 데이터가 더 큰 경우) 까지 나타났다. 이 차이는 강우가 대부분 실제로는 연구지역 밖에서 나타났거나 연구지역만의 국지적 강우임을 나타내는 것이다. 유출량의 비교에서는 NEXRAD를 이용한 시뮬레이션이 측정치에 더 가깝게 예측하였다.
주요어 : 국지적 강우, NEXRAD, 레이다, 강우, SWAT
1. Introduction
Precipitation is one of the most important factors for hydrology and hydrological modeling studies. The spatial distribution and the density of rainfall information can be a key factor to estimate more accurate hydrological responses in a watershed (Novotny and Olem, 1994).
Capturing the amount of rainfall using radar began in 1950s but it became available to public from 1990s. Before then, obtaining precipitation input data for a hydrological modeling study relied only on rain gauge measurements or weather stations near or within the study area.
The rainfall data was often to be averaged or estimated to cover the entire study area because the number of weather stations was limited. Since rainfall is highly variable in space and time, averaging rainfall data can make biases such as missing local storms and over or underestimate the amount of precipitation.
NEXRAD (Next Generation Radar) data from Weather Surveillance Radar - 1988 Doppler (WRS-88D) system, however, provides finer spatial resolution of rainfall data (4×4 km) as a grid format covering the most of the United States and South Korea, although only level II data (Table 1) is currently available in South Korea.
One of the benefits of NEXRAD data is that it records the spatial and temporal variation of rainfall and captures scattered and local storms instantaneously. Kim and Kim (2010) summarized the international trend of meteorological data utilization and described about the NEXRAD data in the United States. In Korea, relatively recent efforts have been made to apply the spatially distributed rainfall data such as the NEXRAD to hydrological modeling studies.
Many studies (Klazura and Imy, 1993; Moon et al., 2004; Young et al., 2000) have conducted on comparing and evaluating overall performance of
NEXRAD dataset in a watershed scale. Very few studies, however, compared at local scale storms and event based impacts to hydrology. Therefore, the objectives of this study were, first, to review the concept and mechanism of NEXRAD data and data collection as well as benefits and drawbacks, second, to compare rainfall data measured from typical weather station and WRS-88D, and to identify local and scattered storms in a small watershed in Texas, US, and the last, to analyze missing rainfall measurements and under- or over-measured rainfall by weather station or NEXRAD along with their impacts on hydrological responses. As mentioned earlier, this study focused on the comparison between two datasets (weather station and NEXRAD) on local events and their impacts on water balance. Thus, this study is expected to be a reference for studies using NEXRAD data in Korea in the future.
2. NEXRAD
1) Data processing
The original purpose of NEXRAD data was to warn people of dangerous weather and its location. The US National Weather Service (NWS) operates total 159 radar systems throughout the US and South Korea and the radar-driven weather data significantly improved in warning for severe weather, air traffic safety, resource protection at military bases, and water management. This spatially distributed precipitation data is extremely helpful to estimate flow and water balance in a watershed modeling studies which mostly use the combination of NEXRAD and weather station data, instead of using either data alone (Johnson et al., 1999; Klazura and Imy, 1993).
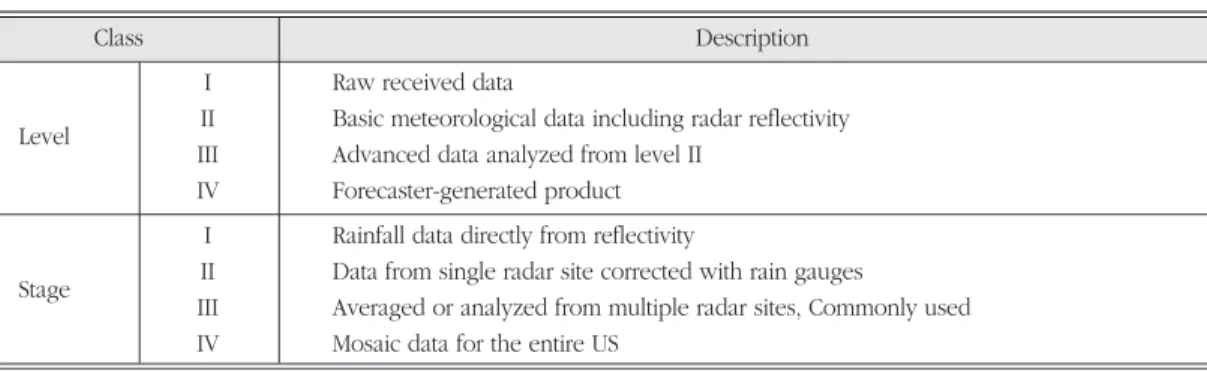
NEXRAD data can be categorized as levels and stages. Table 1 summarized the level and stage of NEXRAD data. The level is based on data processing while the stage is based on spatial scale and mergence. Level I data is a raw data from radar reflectivity, level II data is a basic precipitation data with the reflectivity, mean radial velocity, and spectrum width, level III data is an analyzed data from level II and produce 46 items including storm relative velocity, hail index, and total storm precipitation, and level IV data is a data used for forecasting. Stage I data is a precipitation data obtained directly from radar reflectivity without correction by weather station, stage II data is a data from single radar corrected by weather station, stage III data is a combined level II data from multiple radars that are available for a study area, and stage IV data is a mosaic dataset for the entire US.
Precipitation data is produced using reflectivity observation from WRS-88D and the process can be expressed with the relationship between radar reflectivity and rainfall rate as equation below (Fulton et al., 1998).
R=aZb
where R is precipitation rate (mm/hr), Z is the radar reflectivity factor (mm6/m3), and a and b are constants. The default constant values are 0.017
and 0.714 for constant a and b, respectively. Z factor can be captured from hydrometers based on moisture condition in the sampling volume.
The precipitation rate (R, Stage I) are integrated to produce hourly rainfall accumulation and converted to a grid format of 4 x 4 km, which each grid cell has a value for the amount of precipitation. In this stage, the radar-based estimation are corrected with gauge measurements using a bias adjustment factor to make a multi-sensor precipitation estimation (Krajewski, 1987), which is a stage II data. Then, using information of overlapping coverage from neighboring radar sensors, stage III data can be made. In some cases of the stage III processing, manual modifying of gauge measurement, removing or adding gauge or weather station can be done for better quality of data. More detail about the process of NEXRAD rainfall estimation is described in Young et al. (2000).
2) Data biases
NEXRAD data is more useful for hydrological modeling studies in that it provides finer resolution in spatial and temporal scale as mentioned earlier. However, there are topographical and systematical biases existing, which need to be considered when the data is used. In mountainous regions, radar beam can be
Table 1. The classification of NEXRAD data by level and stage
Class Description
I Raw received data
Level II Basic meteorological data including radar reflectivity III Advanced data analyzed from level II
IV Forecaster-generated product I Rainfall data directly from reflectivity
Stage II Data from single radar site corrected with rain gauges III Averaged or analyzed from multiple radar sites, Commonly used IV Mosaic data for the entire US
blocked by mountains and obstacles. Data collection and estimation can be difficult in a complex terrain with no weather station to correct it. Also, bias can be found in data depending on the distance from the radar (Smith and Krajewski, 1991; Smith et al., 1996). Smith et al. (1996) concluded in their study that mean hourly precipitation estimation vary by distance from the radar because of the increase of sampling volume and beam height at distance.
This kind of bias can be seen more in an area where the number of gauge stations is small and less correction can be done (Young et al., 2000).
3. Methodology and materials
1) Study area
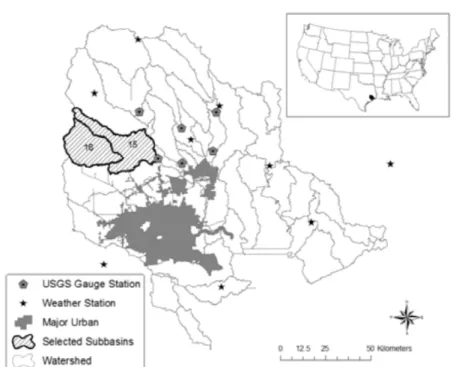
The study area is located in southeastern Texas,
USA (Figure 1). A small watershed including two subbasins (subbasin 15 and 16) as shown in Figure 1 was selected in this study from the previous modeling study by Lee et al. (2011) for the Galveston Bay Watershed. The total area of the two subbasins is 1,042 km2, 558 km2 for subbasin 15 and 484 km2 for subbasin 16, respectively. The landuse of the subbasins is the mixture of forest (31.8%), urban (22.1%), cropland/pasture (19.2%), and rangeland (16.5%)
Table 2. The percentage of each landuse category
Landuse Percentage
Water 0.5%
Urban 22.1%
Forest 31.8%
Rangeland 16.5%
Cropland/Pasture 19.2%
Wetland 9.9%
Total 100.0%
Figure 1. The location of study area, selected subbasins, flow gauge stations, and weather stations.
Numbers in subbasins indicate subbasin ID number from the previous study by Lee et al. (2011)
as listed in Table 2. The subbasins were selected because they have a relatively well-mixed landuse and a USGS (United States Geological Survey) gauge station for stream flow measurement at the outlet (Figure 1). Also, there is no weather station available within the subbasins, which is important in this study because the different rainfall pattern and rainfall amount were expected.
2) SWAT
SWAT (Soil and Water Assessment Tool) (Arnold et al., 1998) is a spatially distributed and continuous hydrological model to assess water balance, sediment, and nutrients transport and loadings from a watershed. It was developed by USDA-ARS (US Department of Agriculture - Agricultural Research Service), NRCS (Natural Resources Conservation Service), and Texas A&M University. It automatically delineates watershed boundaries and channel networks, input watershed information such as landuse and soil using GIS (Geographic Information System) dataset, and analyzes hydrological outputs in various spatial and temporal scale. SWAT uses daily weather data to simulate surface runoff, interflow calculation, groundwater cycle, and channel process. SWAT divides a watershed into smaller subbasin level and the subbasins into more detail levels with the concept of Hydrologic Response Units (HRUs). HRU is a unique combination of soil, land use, and slope in a subbasin. In this study, SWAT version 2.3.4 was used.
3) Previous study
(1) Data
Lee et al. (2011) conducted a modeling study to
estimate inflow to the bay from the Galveston Bay Watershed, Texas, US with the modeling period of 34 years from 1975 to 2008 including 2 years of model warm-up period. National Elevation Dataset (NED) at 30 meter resolution and National Landcover Dataset (NLCD) created in 2001 were obtained from NRCS Data Gateway website (http://datagateway.nrcs.usda.gov/) and the percentage of each landuse category is summarized in Table 2. Soil Survey Geographic (SSURGO) data for soil information was obtained also from the NRCS Data Gateway as a shape file format and converted to GRID format at 30m resolution. Weather data was obtained from National Climate Data Center (NCDC) for rainfall and temperature information at each weather station within and near the watersheds. There were total 11 weather stations available for Galveston Bay Watershed. The rest of weather parameters including solar radiation, wind speed, and relative humidity were simulated by SWAT.
Rainfall data from weather stations were enhanced with NEXRAD data (Level III and Stage III) from year of 2000 to 2008. NEXRAD data was available from 1995 but was considered as good data only after 2000. Therefore, rainfall data used in this study was a combination of weather station data before 2000 and NEXRAD enhanced rainfall data after 2000. Stream flow data was obtained from USGS. There were a total of six gauge stations available with continuous record for the modeling period in the watershed. More detail information about input data can be found in Lee et al. (2011).
(2) Calibration and validation
Model calibration and validation for flow was conducted against six USGS gauge stations as shown in Figure 1. The values of each adjusted parameter in calibration process varied depending on local condition and properties (Table 3). The values were adjusted mostly for
the parameters related with groundwater such as groundwater re-evaporation coefficient, groundwater storage required for return flow, and soil available water.
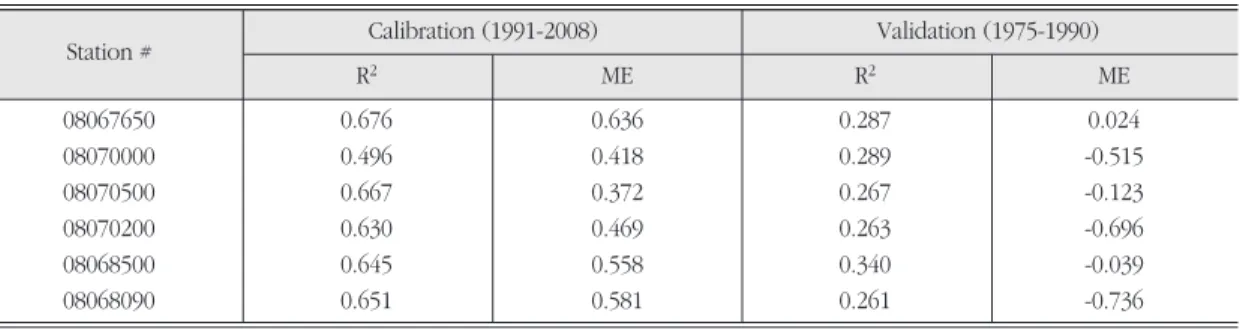
Table 4 shows the model performance for daily flow calibration and validation. Calibration was conducted from 1991 to 2008 and validation was conducted from 1977 to 1990. Calibration was done later years because the landuse used in the study was created in 2001. For model calibration, R2 ranged from 0.496 to 0.676 and ME (Nash- Sutcliffe Model Efficiency) (Nash and Sutcliffe, 1970) ranged from 0.372 to 0.636 respectively. ME was a statistical analyses of correlation between two dataset and used in the previous study by Lee et al. (2011). Model did not perform a good estimation for validation period, which R2ranged from 0.261 to 0.340 and ME ranged from -0.736 to 0.024 respectively. Lee et al. (2011) stated that
urban was rapidly expanded from 1990s and the 2001 landuse included new urbanization in the watershed, which made difficulties for model estimation to match with gauge records in earlier years.
(3) Subbasin 15 and 16
Subbasin 15 and 16 were selected in this study as mentioned earlier (Figure 2). Again, the subbasins were selected because they did not have any weather stations within the subbasins and it was valuable to compare between two rainfall data. In addition, USGS gauge station (ID:
08068500) is located at the outlet of subbasin 15 and it was possible to see the impacts of different rainfall data on the total stream flow out. SWAT used the closest weather station from the center of each subbasin and both subbasins used Dacus weather station, which is located in north of the Table 3. Adjusted parameter values for model calibration. The values varied depending on the condition of each site
Parameter Description Default Value Input Value Units
GW_REVAP Groundwater re-evaporation coefficient 0.02 0.15-0.2
GWQMN Groundwater storage required for return flow 0 1,000 mm
ALPHA_BF Baseflow alpha factor 0.048 0.048-0.4 Days-1
SURLAG Surface runoff lag time 4 1-5 hr
SOL_AWC Soil available water 0.08-0.13 0.05-0.5 mm
Source: Lee et al. (2011)
Table 4. Model performance for daily flow calibration and validation at each gauge station.
ME indicates Nash-Sutcliffe model efficiency (Nash and Sutcliffe, 1970)
Station # Calibration (1991-2008) Validation (1975-1990)
R2 ME R2 ME
08067650 0.676 0.636 0.287 0.024
08070000 0.496 0.418 0.289 -0.515
08070500 0.667 0.372 0.267 -0.123
08070200 0.630 0.469 0.263 -0.696
08068500 0.645 0.558 0.340 -0.039
08068090 0.651 0.581 0.261 -0.736
Source: Lee et al. (2011)
subbasins (Figure 2). From 2000 where the NEXRAD data was available, NEXRAD data was
substituted in the SWAT for the subbasins. In order to use NEXRAD data in each subbasin, Figure 2. The location of subbasin 15 and 16, weather stations and USGS gauge stations
Figure 3. The results of daily flow calibration (A) and validation (B) at USGS gauge station 08068500. The calibration period was from 1991 to 2008 and the validation period was from 1977 to 1990. X axe is for observed flow and Y axe is for modeled flow
hypothetical weather station was created in each subbasin in the model. Therefore, each subbasin has its own rainfall information for entire modeling period with rainfall from Dacus (1975 to 1999) and rainfall from NEXRAD (2000 to 2008).
The results of daily flow calibration and validation for gauge station 08068500 (subbasin 15 and 16) showed in Figure 3. As explained earlier, model performance for the calibration period was better (R2 was 0.645) than the validation period (R2 was 0.340). In Figure 3, X axe indicates observed data from flow gauge station and Y axe indicates modeled flow. For validation (B), model was over-estimated for the most peaks and this was because the model used landuse created in 2001, which included recently urbanized land that caused more and rapid runoff, which was not existed in the validation period.
4) Comparison of rainfall data
Rainfall data between weather station and NEXRAD were compared in the year of 2006. The year 2006 was selected because the year was
wettest year since 2000 where the NEXRAD data was available from. The average annual precipitation for recent 34 years from 1975 to 2008 in the Galveston Bay Watershed was approximately 1,220 mm and the total precipitation in 2006 in subbasin 15 and 16 was 1,315 mm. In this study, two rainfall datasets were compared as event bases, instead of total rainfall for a month or a year in order to detect any local or scattered storms. For rainfall comparison, the rainfall data in 2006 from Dacus station (Figure 2) and the NEXRAD data from each subbasin was averaged to make a single daily value to represent NEXRAD rainfall data for the two subbasins. The total averaged rainfall by NEXRAD data during 2006 was 1,233 mm, which was 82 mm less than the rainfall measurement from Dacus weather station.
There were many days of discrepancies in terms of rainfall amount between two rainfall data. During the study year, the total number of days that rainfall was recorded by weather station but no rainfall was recorded by NEXRAD was 19 days. These events probably need to be eliminated in future simulation because they are the events out of the study area. On the other
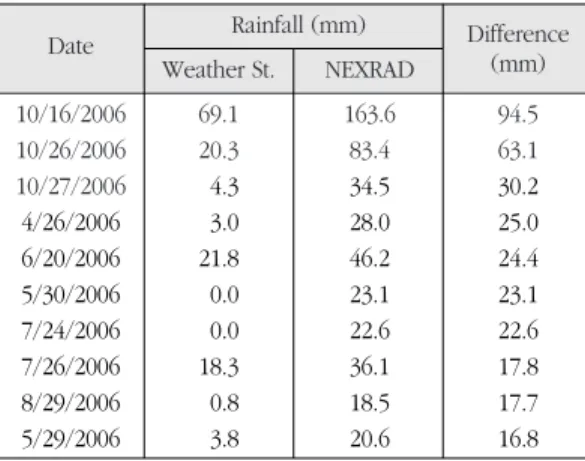
Table 5. The list of ten largest days where the rainfall amount from NEXRAD data is larger than the rainfall amount from weather station
Date Rainfall (mm) Difference Weather St. NEXRAD (mm)
10/16/2006 69.1 163.6 94.5
10/26/2006 20.3 83.4 63.1
10/27/2006 04.3 34.5 30.2
4/26/2006 03.0 28.0 25.0
6/20/2006 21.8 46.2 24.4
5/30/2006 00.0 23.1 23.1
7/24/2006 00.0 22.6 22.6
7/26/2006 18.3 36.1 17.8
8/29/2006 00.8 18.5 17.7
5/29/2006 03.8 20.6 16.8
Table 6. The list of ten largest days where the rainfall amount from weather station is larger than the rainfall amount from NEXRAD data
Date Rainfall (mm) Difference Weather St. NEXRAD (mm)
11/7/2006 71.6 0.0 71.6
9/17/2006 65.0 0.8 64.2
7/22/2006 62.7 2.1 60.7
7/23/2006 58.2 0.0 58.2
1/23/2006 43.2 0.0 43.2
2/11/2006 36.3 0.0 36.3
10/17/2006 33.0 0.0 33.0
9/11/2006 29.7 0.1 29.6
7/27/2006 30.5 1.4 29.1
12/30/2006 30.5 4.0 26.6
hand, total number of days that rainfall was recorded by NEXRAD but no rainfall was recorded by weather station was 58 days. It indicates that there were a number of local storms in subbasin 15 and 16 when Dacur weather station did not record any rainfall due to the distance from study area. Although the NEXRAD data was estimated within the study area some events need to be cleaned up because they can be estimated by biases such as haze or fog, especially smaller events. Table 5 and Table 6 list ten largest differences of rainfall amount between weather station data and NEXRAD rainfall. The largest differences were 94.5 mm (when NEXRAD estimation was larger) and 71.6 mm (when weather station measurement was larger). Those differences indicate that there were large different amount of rainfall between Dacur weather station and the study area.
5) Simulation with weather station data
NEXRAD enhance rainfall data was used after year 2000 in the original model as mentioned earlier and the NEXRAD data was manually
substituted with weather station data (Dacus) to compare the impacts on hydrology in the subbasins in this study. Because there were differences in many numbers of days and substantial amount of rainfall between NEXRAD data and weather station, it would impact on the total stream flow at the outlet. The model was run for entire modeling period (34 years) and daily stream flow at the outlet of subbasin 15 was compared with the observed flow from USGS gauge station (08068500).
4. Results and discussion
The model simulation for flow with weather station rainfall data was conducted for entire modeling period and the result in 2006 compared with observed flow from USGS gauge station as plotted in Figure 4 (B). Plot (A) in Figure 4 is the result of model run with NEXRAD enhanced rainfall data in 2006. The estimated runoff agreed well with observation in plot (A) (R2=0.669) while the estimated runoff did not agree well with
Figure 4. Comparison between observed flow and modeled flow at UGSG gauge station in 2006. Left plot (A) is the result of using NEXRAD enhanced rainfall data and right plot (B) is the result of using rainfall from weather station
observation in plot (B) (R2=0.299). This was mainly due to the discrepancies between two rainfall data, especially when there were 58 days that weather station did not record rainfall while NEXRAD did as described earlier. It should be noted, however, that the calibration was originally conducted in the model simulation using NEXRAD enhanced data. Therefore, if the model was calibrated using rainfall data only from the weather station, the correlation would show better agreement. The both modeled flow under-estimated in total compared to observed flow. The observed total flow in 2006 at the gauge station was 2,554.0 m3/s while the estimated total flow with weather station data was 2,258.3 m3/s (11.5% less) and that with NEXRAD data was 2,201.6 (13.8% less), which indicated model under-estimated in the year overall.
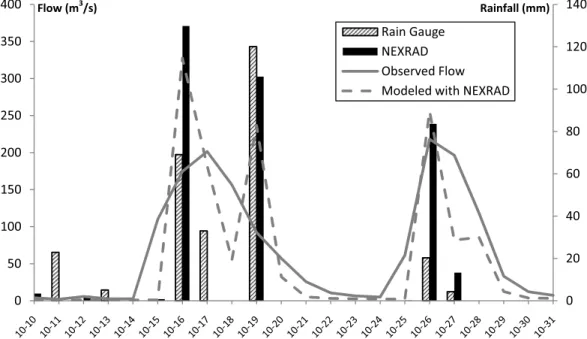
Figure 5 shows the hydrological responses based on the two rainfall datasets from October 10 to October 31, 2006. This period was shown because it had a couple of largest events in the
year. The largest rainfall recorded by NEXRAD was 163.6 mm on October 16 and that by weather station was 120.1 mm on October 19. In this period, there were also some disagreements in rainfall amount between weather station and NEXRAD. Weather station recorded 69.1 mm on Oct 16 and 20.3 mm on Oct 26 while NEXRAD recorded 163.6 mm on Oct 16 and 83.4 mm on Oct 26, respectively. Also, there were a couple of events that were recorded only by weather station on Oct 11 and Oct 17. It turned out that the event on Oct 11 recorded by weather station was not the event within the subbasin 15 and 16 because there was no response on the observed flow as shown in Figure 5. The event on Oct 17 is difficult to explain because the flow hydrograph was responded on the event by increasing from 174.6 m3/s on Oct 16 to 201.5 m3/s on Oct 17 while NEXRAD did not record any event. It should be noted that the event recorded by NEXRAD on Oct 16 was very large (163.6 mm) and it may have impacted on the
Figure 5. Comparison between rainfall data and hydrological responses in October, 2006
flow particularly if the event occurred late on the day.
Another issue that should be noticed is that USGS gauge station did not respond at all to the large event on Oct 19 where both weather station and NEXRAD recorded as one of the largest events in the year. This can be an uncertainty of observed data and it is necessary to be fixed.
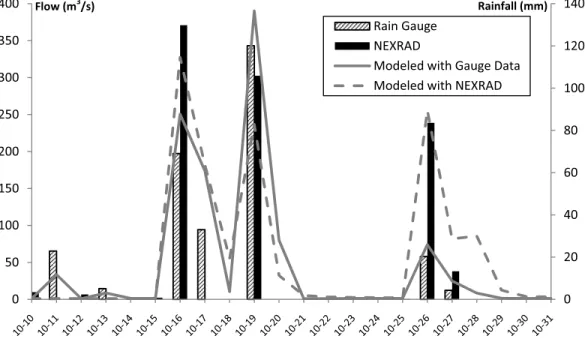
Figure 6 compares the estimated flow using two different rainfall data. In general, both modeled flow showed the similar pattern reflecting each event. The flow from the simulation with weather station data responded to the events on Oct 11 and Oct 17 where the USGS gauge station did not respond (Figure 5) although it can be controversial on the event of Oct 17 as discussed earlier. The most important issue in Figure 6 is the event on Oct 19 where flow gauge did not respond for the event.
Simulation with weather station data and NEXRAD estimated 390.3 m3/s and 236.7 m3/s respectively on the day and it was one of the
largest factors that affected negatively on the correlation between observed and modeled (Figure 4).
5. Conclusion
Rainfall data from WRS-88D (NEXRAD) has advantages of its finer spatial and temporal scale and it has been widely used for hydrological modeling studies. However, it also introduces some biases that modelers should be aware; first, the data quality is limited by some topographic obstacles like mountains, second, the accuracy is lower when it is away from the center of the radar, third, it often records haze and fog as a rainfall event. In order for better accuracy, NEXRAD data has been used as an enhanced format by combining with neighboring radar stations and weather stations.
Rainfall data from weather station and NEXRAD
Figure 6. Comparison of estimated flow using different rainfall data between weather station and NEXRAD
were compared to identify local storms and to compare with hydrologic responses at the USGS gage station. This study used the previously calibrated SWAT model in a small watershed using rainfall data from weather station that was away from the study area. The rainfall data was partially NEXRAD incorporated after year of 2000.
In many cases, the weather station away from the study area did not capture events while NEXRAD recorded the events in the study area or the events were recorded only at the weather station.
During the study year (2006), many events were recorded only in the weather station (19 days) or NEXRAD (58 days). However, it is obvious that NEXRAD data in many cases represented more accurate rainfalls in the study area simply because it was estimated within the study area. The largest differences in the amount of rainfall between two datasets were 94.5 mm (when NEXRAD rainfall was larger) and 71.6 mm (when rainfall from weather station was larger) respectively. The differences showed that there were considerable discrepancies in rainfall event and amount between weather station (Dacur) and study area.
The modeled stream flow at the outlet of the study area was compared with observed flow at USGS gage station. From the previous study that used NEXRAD enhanced rainfall data, R2between observed flow and modeled flow at the outlet of subbasin 15 was 0.669 in 2006. From this study using rainfall data from only weather station, R2 was 0.299, which is indicating NEXRAD enhanced rainfall data showed better agreement with observation. More detail analyses for the relationship between two rainfall datasets and their impacts on hydrology was conducted using data and result in October 2006 where there were a couple of largest events in the year. For the large events during October, two rainfall datasets showed some discrepancies and they impacted on the total flow estimation at the outlet. Some events (e.g. Oct 11 and 17) were recorded only at
the weather station and they were assumed to be events out of the study area. It is important not to overlook that the observation at USGS gauge station did not capture one of the largest rainfall on Oct 19 (recorded at 120.1 mm by weather station and 102.4 mm by NEXRAD). These kinds of errors often occur and impact negatively on the result of modeling study. For comparison between two modeled flows using two rainfall datasets generally agreed each other. However, in the case of simulation using rainfall from weather station, some events that were recorded only from the weather station impact on the estimated flow, which is not a correct representation.
NEXRAD data has been recognized as a very useful dataset to detect local storms and to estimate more accurate hydrology. Due to the landscape, a local storm by orographic precipitation is a large part of total rainfall in Korea and NEXRAD rainfall data can be a good option to be adopted although mountainous landscape may be sometimes an obstacle.
Reference
Arnold, J. G., Srinivasan, R., Muttiah, R. S., and Williams, J.R., 1998, Large area hydrologic modeling and assessment, Part I: Model Development. Journal of the American Water Resources Association, 34(1), 73-89.
Fulton, R. A., Breidenbach, J. P., Seo, D., Miller, D. A., and Bannon, T. O., 1998, The WSR-88D rainfall algorithm. Weather and Forecasting, 13, 377- 395.
Johnson, D., Smith, M., Koren, V., and Finnerty, B., 1999, Comparing mean areal precipitation estimates from NEXRAD and rain gauge networks, Journal of Hydrologic Engineering, 4(2), 117-124.
Kim, J. and Kim, I., 2010, The international trend for social and economical evaluation of meteorological information (in Korean), Meteorological Technology & Policy, 3(4), 123-
130.
Klazura, G. E. and Imy, D. E., 1993, A description of the initial set of analysis products available from the NEXRAD WSR-88D system, Bulletin of American Meteorological Society, 74(7), 1293-1311.
Krajewski, W. F., 1987, Cokriging radar-rainfall and rain gage data, Journal of Geophysical Research, 92(8), 9571-9580.
Lee, T., Srinivasan, R., Moon, J., and Omani, N., 2011, Estimation of fresh water inflow to bays from gaged and ungaged watersheds, (Accepted).
Applied Engineering in Agriculture.
Moon, J., Srinivasan, R., and Jacobs, J. H., 2004, Stream flow estimation using spatially distributed rainfall in the Trinity River Basin, TX, Transaction of American Society of Agricultural Engineers, 47(5), 1445-1451.
Nash, J. E. and Sutcliffe, J. V., 1970, River flow forecasting through conceptual models: Part I - A discussion of principles, Journal of Hydrology, 10, 282-190.
Novotny, V. and Olem, H., 1994, Water Quality:
Prevention, Identification, and Management of Diffuse Pollution, Van Nostrand Reinhold, New
York, NY.
Smith, J. A. and Krajewski, W. F., 1991, Estimation of the mean field bias of radar rainfall estimates, Journal of Applied Meteorology, 30, 397-412.
Smith, J. A., Seo, D., Baeck, M. L., and Hudlow, M. D., 1996, An inter-comparison study of NEXRAD precipitation estimates, Water Resources Research, 32(7), 2035-2045.
Young, B. C., Bradley, A. A., Krajewski, W. F., and Kruger, A., 2000, Evaluating NEXRAD multisensor precipitation estimates for operational hydrologic forecasting, American Meteorological Society, 1, 241-254.
Correspondence: Taesoo Lee, 1500 Research Parkway, Suite B230, College Station, TX, 77843, USA, e-mail: taesoo@tamu.
edu, phone: 1-979-820-3215
교신: 이태수, 이메일: [email protected], 전화: 1-979-820- 3215
Recieved April 6, 2011 Revised April 27, 2011 Accepted April 30, 2011