대한치과재료학회지 47(4) : 193-202, 2020 Korean Journal of Dental Materials (
Korean J Dent Mater
) ISSN:2384-4434 (Print); 2384-3268 (Online) Available online at http://www.kadm.org http://dx.doi.org/10.14815/kjdm.2020.47.4.193광조사에 따른 Bulk-fill 복합레진의 온도변화와 압축성질
이동호, 설효정, 권용훈
*
부산대학교 치의학전문대학원 치과재료학교실
Temperature changes and compressive properties of bulk-fill composites by light curing
Dong-ho Yi, Hyo-Joung Seol, Yong Hoon Kwon *
Department of Dental Materials, School of Dentistry, Pusan National University, Yangsan-si, Korea
본 연구는 광조사에 따른 bulk-fill composites (BFCs)의 온도변화와 압축성질을 평가하였다. 이를 위하여 5종의 BFCs을 포함하여 7종의 레진 기반의 복합레진(RBCs)을 택하고 이들에서 광조사 전후의 최대온도증가와 발열 그리고 4 mm 두께 상태에서 압축강도(CS)와 modulus (CM)을 평가하였다. 그 결과 광감소계수(AC)와 필러 량 사이에는 낮지 않은 상관성이 있었다. 한 제품을 제외하면 BFCs의 AC는 RBCs보다 낮았다. 4 mm 두께의 시료에서 모든 제품이 5℃ 이상의 온도 증가와 발열을 보였다. 시료들의 CS와 CM 값은 각각 69-116 MPa와 1.3-2.8 GPa 이었다. BFCs와 RBCs 사이에서 온도변화와 압축성질은 일관성 있는 차이가 없었고 통계적으로도 유의하지 않았다.
색인단어 : 벌크필 복합레진, 온도변화, 압축성질
Dong-ho Yi (ORCID: 0000-0001-9184-1179) Hyo-Joung Seol (ORCID: 0000-0002-6177-2616)
Correspondence: Yong Hoon Kwon (ORCID: 0000-0001-8097-2114) 49 Busandaehak-ro Mulgeum-eup, Yangsan-si 50612, Republic of Korea Affiliation: Department of Dental Materials, School of Dentistry Pusan National University, Yangsan-si, Republic of Korea
Tel: +82-51-510-8230, Fax: +82-51-510-8228 E-mail: [email protected]
Received: Sep . 11, 2020; Revised: Nov. 10, 2020; Accepted: Nov. 11, 2020
Introduction
Restoration of damaged tooth using a resin-based composite (RBC) is a routine process in dental clinics.
The popularity of RBCs over other conventional material such as amalgam is in acceptable features such as long working time with easy handling and short curing time,
safe, and agreeable aesthetics that can harmonize with
natural teeth (1-3). However, due to the shortening of
molecular distance by the changed governing force in
the methacrylate-based RBCs, massive filling of the cavity
is not a recommended option. To lessen polymerization
shrinkage problem, many approaches, such as develop-
ment of low shrinkage monomers, new light curing
Table 1. Materials used in the present study
Code Composition Filler content
vol% / wt%
1/ wt%
2Manufacturer
FB Bis-GMA, UDMA, Bis-EMA(6),Zirconia, silica, YbF3
42.5/64.5/60.6 3M ESPE
St. Paul, MN, USA
SF TMSPMA, EBPADMA,
TEGDMA, oxide, SiO2
/83.5/82.7 Kerr
Orange, CA, USA SS Modified UDMA, EBPADMA, TEGDMA,
Ba-Al-F-B-Si glass, Sr-F-Si glass 45/68/66.1 Dentsply Caulk Milford, DE, USA
TB Bis-GMA, UDMA,
Ba-Al-Si glass, YbF3,PPF 60-61/79-81/71.5 Ivoclar Vivadent Schann, Liechtenstein
VB UDMA, EMPADMA,
Ba-Al-F-SiO2, YbF3, SiO2
38/65/59.7 Heraeus Kulzer, GmbH, Hanau, Germany
TN Bis-EMA, TEGDMA, UDMA,
Barium glass, YbF3,SiO2
57/80.5/72.5 Ivoclar Vivadent Schann, Liechtenstein
ZF Bis-GMA, TEGDMA,
Zirconia/silica cluster fillers 55/65/58.7 3M ESPE
St. Paul, MN, USA
FB: Filtek Bulk Fill flowable, SF: SonicFill, SS: Surefil SDR, TB: Tetric N-Ceram Bulk Fill, VB: Venus Bulk Filll, TN: Tetric N-Ceram, ZF: Filtek Z350XT flowable.
Bis-EMA: ethoxylated bisphenol-A-glycidyl methacrylate, Bis-GMA: bisphenol glycidyl dimethacrylate, EBPADMA: ethoxylated bisphenol-A-dimethacrylate, TEGDMA: triethyleneglycol dimethacrylate, TMSPMA: 3-trimethoxysilypropyl methacrylate, UDMA: urethane dimethacrylate.
wt%
1: nominal weight (according to the information supplied by the manufacturers).
wt%
2: weight by ash method.
protocols, and incremental layering techniques, have been introduced (4-6). Among them, incremental layering less than 2-mm thick became a routine procedure despite it is a time-consuming process (7, 8).
Recently introduced bulk-fill composites (BFCs) are claimed to fill the tooth cavity up to 6 mm at one time (9-11). To achieve one-time deep bulk filling, some BFCs have high diluent (triethyleneglycol dimethacrylate, TEGDMA) content or low filler content to increase flow.
Ultrasound device was used to loosen the resin paste that is dense due to high filler content. However, unlike RBCs which minimize their filling less than 2-mm thick at one time to minimize light attenuation and reduce polymerization shrinkage, BFCs were reported to have reduced contraction stress and cuspal deflection despite bulk filling, which can be beneficial in a clinical aspect.
Light curing of RBCs usually induces temperature rise
during polymerization. As a light source, light-curing unit
(LCU) supplies photons which initiate curing process in
the specimens. During the polymerization process,
exothermic reaction produces heat, and such produced
heat may increase chemical reaction within the specimens
till the heat dissipates. Since resin products are composed
of several monomers with different contents, the resultant
exothermic heat, temperature, will be diverse. Also, heat
from the light bulb or LED unit within LCU can induce
temperature rise in the resin product through the
conduction of heat (12, 13). The resultant temperature
rise by different factors can affect the vitality of pulp
if it is not properly controlled. The purpose of the present
study was to evaluate the temperature change and
compressive property of the specimens to understand
how the irradiated light affect the polymerization of BFCs.
Materials and Methods
1. Bulk-fill composites (BFCs)
For the study seven different RBCs [Filtek Bulk Fill flowable (FB), Filtek Z350XT flowable (ZF), SonicFil (SF), Surefil SDR (SS), Tetric N-Ceram (TN), Tetric N-Ceram Bulk Fill (TB), and Venus Bulk Fill (VB)] were used.
Among them, FB, SS, VB are of low viscous BFCs, SF and TB are of high viscous BFCs, and TN and ZF are of conventional RBCs. Compositional details of these resins are listed in Table 1. For light curing, a LED LCU [L.E.Demetron (DE), Kerr, Danbury, CT, USA] was used as a light source with 900 mW/cm
2condition.
2. Filler weight
To determine the filler weight (wt%) of the tested resin products, standard ash method in addition to the nominal weight which was provided by the manufacturers was performed (14). Approximately 50 mg of each resin specimen (n=5) was measured using an analytical balance, light cured, and heated to burn out the organic matrix.
The wt% was determined by dividing the weight of original specimen to that of the remaining specimen after heating in furnace.
3. Photon counts and attenuation coefficient (AC)
To estimate AC of the tested specimens by measuring the number of photons those arriving at the bottom of the specimens, specimens (n=3) of different thicknesses (diameter: 7 mm; thickness: 1, 2, 3, and 4 mm) were prepared, placed over a stage (thickness: 1 mm) which has a hole (diameter: 6 mm) on it. Light was irradiated from the above the hole. The photon detector (M1420, EG&G, PURC, Princeton, NJ, USA) was placed under the hole to measure the photons. To determine AC, the incident light was assumed to attenuate exponentially
within the specimens by following Beer-Lambert law (I
= I
0·e
-α·z, where I
0is the initial light intensity, it is the measure of photons in the absence of specimen, α is AC, and z is the specimen thickness at the time of measurement.).
4. Temperature measurements
To measure the temperature change of specimens (n=5 for each test condition) during and after the light curing, a stainless steel mold of two different thicknesses (height, 2 and 4 mm; inner diameter, 5 mm; outer diameter, 15 mm) was used. The bottom of the mold was covered with a glass slide (thickness, 200 μm). The end of a thermocouple (T-type, OMEGA Engineering, Stamford, CT, USA) was placed at the center of the test resin’s top surface. The resin was light cured for 40 s at 900 mW/cm
2. At this time, the end of the light guide of LCU was contacted on the bottom surface of the thin glass slide. Temperature was measured for 150 s. To ensure more complete curing, two additional irradiations (the second/third light irradiations) were performed for 60 s.
The second temperature measurement was performed during a fourth irradiation for 40 s at the same light intensities.
5. Compression test
The compressive properties [compressive strength (CS) and modulus (CM)] of the light cured specimens were estimated. To make specimens, a metal cylinder mold (outer diameter: 10 mm, inner diameter: 2 mm, height:
4 mm) was prepared. After the inner empty space of
the mold was filled with resin, both top and bottom
surfaces were covered with glass slides to produce a flat
surface. For all specimens, light was irradiated from the
top to bottom direction for 40 s. Additionally, for TN
and ZF, light was simultaneously irradiated for 40 s from
the top to bottom and bottom to top surfaces. The
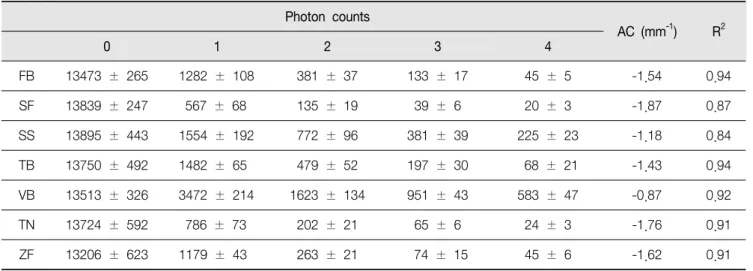
Table 2. Number of photons detected at different thicknesses and the estimated attenuation coefficients (AC) by assuming exponential decay of photon count
Photon counts
AC (mm
-1) R
20 1 2 3 4
FB 13473 ± 265 1282 ± 108 381 ± 37 133 ± 17 45 ± 5 -1.54 0.94
SF 13839 ± 247 567 ± 68 135 ± 19 39 ± 6 20 ± 3 -1.87 0.87
SS 13895 ± 443 1554 ± 192 772 ± 96 381 ± 39 225 ± 23 -1.18 0.84
TB 13750 ± 492 1482 ± 65 479 ± 52 197 ± 30 68 ± 21 -1.43 0.94
VB 13513 ± 326 3472 ± 214 1623 ± 134 951 ± 43 583 ± 47 -0.87 0.92
TN 13724 ± 592 786 ± 73 202 ± 21 65 ± 6 24 ± 3 -1.76 0.91
ZF 13206 ± 623 1179 ± 43 263 ± 21 74 ± 15 45 ± 6 -1.62 0.91
The number 0, 1, 2, 3, 4 represent thickness (mm) of specimens.
specimens cured were removed from the mold and stored (n=5 for each group) in a 37℃ dry and dark chamber for 24 h. After storage, compression tests were performed using the universal test machine (Instron 3345, Grove City, PA, USA) at a crosshead speed of 1 mm/min. CS (σ
cin MPa) was determined using the following formula
σ
c= P/A
where P is maximum failure load (N) and A is the cross-sectional area of the specimen. CM (in GPa) is defined as the slope of the linear portion of the load-displacement curve.
6. Statistical analysis
The results of temperature change and compressive properties were analyzed using one-way ANOVA and t-test. A post-hoc Tukey test was used to determine significant differences between individual groups. All tests were analyzed at p<0.05.
Results
The number of photons detected from the specimens of different thicknesses and the AC (mm
-1) values estimated using the exponential decrease fit based on the number of photons detected are shown in Table 2. AC values ranged from -0.87 to -1.87. Among the specimens, except SF, AC values of BFCs (<-1.55) were lower than those of two RBCs (-1.62 and -1.76). SF and VB showed the highest and lowest AC values (-1.87 and -0.87), respectively.
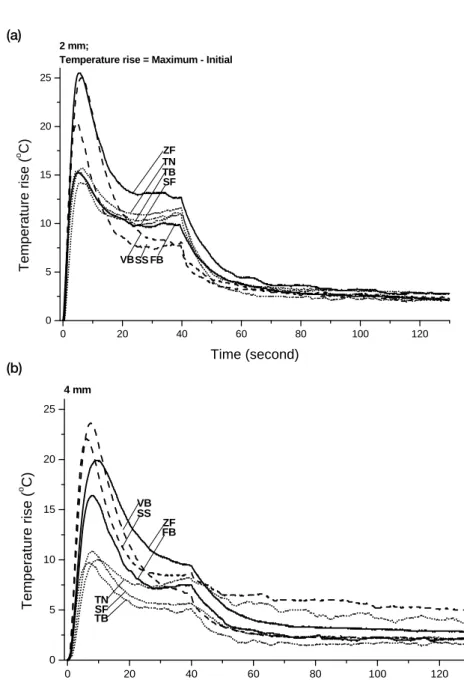
Figure 1 shows the temperature profiles of the specimens with different thicknesses during the first light curing. All specimens showed the maximum temperature rise during the first 10 seconds of light curing. After that, temperature decreased greatly despite continued light curing.
Table 3 shows the maximum temperature rise and the
estimated exothermic heat. The maximum temperature
rise ranged 14.2-25.9℃ and 9.8-23.6℃ for 2-mm and
4-mm thick specimens, respectively. For 4-mm thick
(a)
0 20 40 60 80 100 120
0 5 10 15 20 25
2 mm;
Temperature rise = Maximum - Initial
SF TB TN
SS VB FB
ZF
Temperature rise (
oC)
Time (second)
(b)
0 20 40 60 80 100 120
0 5 10 15 20 25
4 mm
TB TNSF
VB SS
FBZF
Tem perature rise (
oC)
Time (Second)
Figure 1. Temperature distribution of the specimens with different thicknesses (a: 2 mm; b: 4 mm) during and after light curing.
specimens, SF and VB showed the lowest (9.8℃) and highest temperature rise (23.6℃), respectively. Both of them are BFCs. The corresponding exothermic heat ranged 4.3-17.2℃ and 4.2-18.3℃ for 2-mm and 4-mm thick specimens, respectively. For 4-mm thick specimens, TN and VB showed the lowest (4.2℃) and highest exothermic heat (18.3℃), respectively. TN and VB are RBC and BFC, respectively. Both BFCs had RBCs had
no statistically consistent difference between them in their maximum temperature rise and exothermic heat.
Table 4 shows the compressive properties (CS and CM) of the specimens. CS ranged 69.2-115.4 MPa if specimens were irradiated only from the top to bottom surface.
Among the specimens, VB (BFC) and TN (RBC) showed
the highest (115.4 MPa) and lowest (69.2 MPa) CS,
respectively. However, if the specimens were irradiated
Table 3. Maximum temperature (℃) and the estimated exothermic heat (℃) in the specimens of different thicknesses Maximum temperature rise compared
to initial temperature Exothermic heat
2 mm 4 mm 2 mm 4 mm
FB 15.5 ± 1.0A 16.9 ± 2.8A 6.0 ± 1.0A 10.8 ± 1.8A
SF 14.2 ± 0.8A 9.8 ± 1.5B 5.8 ± 0.5A 6.0 ± 0.3B
SS 21.9 ± 2.9B 20.1 ± 1.8AC 13.6 ± 1.4B 14.5 ± 1.0AC
TB 15.4 ± 0.4A 9.9 ± 0.7B 5.6 ± 0.6A 6.1 ± 0.9B
VB 25.1 ± 2.4B 23.6 ± 3.8C 17.2 ± 1.3C 18.3 ± 2.9C
TN 15.6 ± 2.1A 10.3 ± 1.8B 4.3 ± 0.8A 4.2 ± 1.2B
ZF 25.9 ± 1.6B 19.0 ± 2.2AC 13.9 ± 0.9B 13.1 ± 1.1A
p-value <0.001 <0.001 <0.001 <0.001
t
- Test SD NSD* Statistically significant difference on resin product is shown by superscript letters
A, B…. Same letters in the same column are not significantly different (p>0.05).
SD: Significantly different; NSD: Not significantly different.
Table 4. Compressive strength and modulus of the tested specimens
Light curing from the top surface Light curing both from the top and bottom surfaces at the same time*
CS (MPa) CM (GPa) CS (MPa) CM (GPa)
FB 101.2 ± 12.6AB 1.68 ± 0.17A 101.2 ± 12.6AB 1.68 ± 0.17A
SF 110.0 ± 1.7A 2.28 ± 0.19B 110.0 ± 1.7ABC 2.28 ± 0.19B
SS 90.3 ± 5.3B 2.30 ± 0.23B 90.3 ± 5.3B 2.30 ± 0.23B
TB 111.3 ± 7.2A 2.81 ± 0.18C 111.3 ± 7.2ABC 2.81 ± 0.18CD
VB 115.4 ± 15.0A 1.65 ± 0.31A 115.4 ± 15.0AC 1.65 ± 0.31A
TN 69.2 ± 5.2C 1.36 ± 0.04A *122.4 ± 8.0CD 2.97 ± 0.11D
ZF 110.8 ± 2.6A 1.32 ± 0.08A *147.4 ± 15.7D 2.55 ± 0.13BC
p
- value <0.001 <0.001 <0.001 <0.001both from the top and bottom surfaces simultaneously, TN and ZF (RBCs) have much higher CS value (76.7 and 33.0%, respectively). CM ranged 1.32-2.81 GPa if specimens were irradiated only from the top to bottom
surface. CM of BFCs (>1.36 GPa) was greater than that
of RBCs. No statistically consistent difference between
BFCs had RBCs was found in their CS and CM.
Discussion
The tested specimens have wide range of filler content (vol and wt%). Among them, except SF (vol% of this product is not known), BFCs TB and VB have the highest and lowest filler content, respectively. To achieve bulk filling at one time, generally, BFCs contain less fillers than general RBCs to decrease viscosity for easy and fast treatment. As filler content (vol%) decreases, light transmission within the specimen can be increased because fillers are one of major obstacles those block light path (15, 16). In the present study, the tested specimens did not show low correlation coefficient (R:
0.70 for vol% and 0.59 for wt%) between their filler content and AC values. Due to high filler content of RBCs, they have high AC values compared with BFCs. In case of VB, the lowest AC value would be possibly due to the lowest filler content among the specimens. However, low AC value of TB despite highest (except unknown SF) filler content may indicate any involvement of a new component in its composition. According to the manufacturer, TB contains a new photoinitiator, Ivocerin, in addition to camphorquinone (CQ). Ivocerin absorbs light from 370 to 460 nm and has higher light absorption than CQ, so rapid and high depth of cure could be possible despite high AC value (which means low light transmission).
An inverse linear correlation between filler content and maximum temperature rise and exothermic heat ranged 0.45-0.88 and 0.57-0.97, respectively, depending on specimen thickness. For BFCs only, the correlation ranged 0.56-0.89 and 0.67-0.89, respectively. According to t-test, as specimens thickened, maximum temperature rise has significantly lowered, but exothermic heat has insignifi- cantly changed (p<0.001). A significant decrease of maximum temperature rise for the thickened specimen is attributable to the increased distance between the heat source (LCU) and detector (thermocouple). The measured
temperature at the first light curing is the result of mixed contributions such as exothermic heat during polymeri- zation process, heat conduction from LCU through the fiber optic, and interactions between photons and chromophores, such as CQ and pigments (17, 18). For a fixed specimen thickness and if heat conduction contribution by LCU is excluded, resin is the main source of temperature rise due to its exothermic heat, so as filler content increases, resin content decreases and then the influence on the temperature rise decreases as well. Such inverse correlation between filler content and resin was also found from other study (19). The second measure- ment after two additional light curing can register temperature rise only due to heat conduction from LCU.
The exothermic heat can be obtained from the difference between the first and second measurements and it will be constant regardless of specimen thickness. However, as specimen thickens, the distance from the end of fiber optic, which delivers light from LCU, and thermocouple will be increased and the conducted heat from the fiber optic will be decreased as shown in Table 3. In specimens regardless of BFCs and RBCs, both maximum temperature rise and exothermic heat were greater than 5℃, which can cause pulp necrosis in the pulp cavity (20, 21). To lessen thermal damage on teeth, any external cooling on teeth during light curing would be asked.
As a measure of mechanical property, compressive property (CS and CM) was tested to know the sustained resistance of the restored material against external load.
The estimated CS and CM values for all specimens had
a low (<0.50) correlation with filler content. However,
in case of BFCs, CM had not low, 0.63-0.93, correlation
with filler content. Compared with many other resin
products which were reported to have CS values at the
rage of 100-200 MPa, the resin products tested in the
present study showed low CS values, 69.2-115.4 MPa,
even though any direct comparison between them is not
practical due to the different experimental conditions (22).
Also, CM values, 1.32-2.81 GPa, were much lower than that of dentin, 11.0-18.5 GPa (23). Low CS or CM values of RBCs were due to incomplete polymerization of the specimens at the bottom side due to insufficient delivery of incident light. The specimens light cured both at the top and bottom surfaces simultaneously showed much increased, 33-118%, CS and CM values than those cured only in one direction.
Conclusion
Within the limitations of the present study, the following conclusions could be reached:
1. The tested most BFCs have a lower AC value than that of RBCs at 4-mm thick specimens.
2. BFCs have a similar range of maximum temperature rise, exothermic heat, CS, and CM values compared with those of RBCs.
3. CM values of BFCs were greater than those of RBCs.
Filler content (vol%) showed high dependence (<0.88) with temperature changes and compressive properties.
Acknowledgement
This work was supported by a 2-year Research Grant of Pusan National University
References
1. Leprince JG, Palin WM, Hadis MA, Devaux J, Leloup G. Progress in dimethacrylate-based dental composite technology and curing efficiency. Dent Mater. 2013;
29(2):139-56.
2. Stansbury JW. Dimethacrylate network formation and polymer property evolution as determined by the
selection of monomers and curing conditions. Dent Mater. 2012;28(1):13-22.
3. Ferracane JL. Resin composite-state of the art. Dent Mater. 2011;27(1):29-38.
4. Lee CH, Lim BS, Lee IB. Color and Translucency of Multi-Shade Layered Composites. Kor J Dent Mater.
2016;43(4):369-77.
5. Leprince J, Palin WM, Mullier T, Devaux J, Vreven J, Leloup G. Investigating filler morphology and mechanical properties of new low-shrinkage resin composite types. J Oral Rehabil. 2010;37(5):364-76.
6. Park WK, Choi AN, Son SA, Kwon YH, Kang ES, Park JK. Effect of layer combinations with nanocomposite and low-shrinkage composite resins on their color and mechanical properties. Kor J Dent Mater. 2017;
44(2):129-39.
7. Park J, Chang J, Ferracane J, Lee IB. How should composite be layered to reduce shrinkage stress:
incremental or bulk filling? Dent Mater. 2008;24(11):
1501-5.
8. Hickey D, Sharif O, Janjua F, Brunton PA. Bulk dentine replacement versus incrementally placed resin composite: A randomised controlled clinical trial. J Dent. 2016;46(1):18-22.
9. Fronza BM, Rueggeberg FA, Braga RR, Mogilevych B, Soares LE, Martin AA, Ambrosano G, Giannini M.
Monomer conversion, microhardness, internal marginal adaptation, and shrinkage stress of bulk-fill resin composites. Dent Mater. 2015;31(12):1542-51.
10. Margeas RC. Bulk-fill materials: simplify restorations, reduce chairtime. Compend Contin Educ Dent. 2015;
36(1):e1-4.
11. Czasch P, Ilie N. In vitro comparison of mechanical properties and degree of cure of bulk fill composites.
Clin Oral Investig. 2013;17(1):227-35.
12. Price RB, Ferracane JL, Shortall AC. Light-Curing Units:
A Review of What We Need to Know. J Dent Res.
2015;94(9):1179-86.
13. Jandt KD, Mills RW. A brief history of LED photopolymerization. Dent Mater. 2013;29(6):605-17.
14. Kim KH, Ong JL, Okuno O. The effect of filler loading and morphology on the mechanical properties of contemporary composites. J Prosthet Dent. 2002;
87(6):642-9.
15. Howard B, Wilson ND, Newman SM, Pfeifer CS, Stansbury JW. Relationships between conversion, temperature and optical properties during composite photopolymerization. Acta Biomater. 2010; 6(6):
2053-9.
16. Arikawa H, Kanie T, Fujii K, Takahashi H, Ban S.
Effect of filler properties in composite resins on light transmittance characteristics and color. Dent Mater J. 2007;26(1):38-44.
17. Bouillaguet S, Caillot G, Forchelet J, Cattani-Lorente M, Wataha JC, Krejci I. Thermal risks from LED- and high-intensity QTH-curing units during polymeri- zation of dental resins. J Biomed Mater Res B Appl
Biomater. 2005;72(2):260-7.
18. Uhl A, Mills RW, Jandt KD. Polymerization and light-induced heat of dental composites cured with LED and halogen technology. Biomaterials 2003;24 (10):1809-20.
19. Stansbury JW. Curing dental resins and composites by photopolymerization. J Esthet Dent. 2000;12(6):
300-8.
20. Zach L, Cohen G. Pulp response to externally applied heat. Oral Surg Oral Med Oral Pathol. 1965;19:515-30.
21. Lloyd CH, Joshi A, McGlynn E. Temperature rises produced by light sources and composites during curing. Dent Mater. 1986;2(4):170-4.
22. Ilie N, Hickel R. Investigations on mechanical behaviour of dental composites. Clin Oral Investig.
2009;13(4):427-38.
23. Watts DC, el Mowafy OM, Grant AA. Temperature-
dependence of compressive properties of human
dentin. J Dent Res. 1987;66(1):29-32.
Original Article
Temperature changes and compressive properties of bulk-fill composites by light curing
Dong-ho Yi, Hyo-Joung Seol, Yong Hoon Kwon *
Department of Dental Materials, School of Dentistry, Pusan National University, Yangsan-si, Korea