Received:August 17, 2018, Revised:(1st) October 4, 2018, (2nd) November 10, 2018, Accepted:November 22, 2018 Corresponding to:Young Ho Lee http://orcid.org/0000-0003-4213-1909
Department of Rheumatology, Korea University Anam Hospital, Korea University College of Medicine, 73 Inchon-ro, Seongbuk-gu, Seoul 02841, Korea. E-mail:lyhcgh@korea.ac.kr
Copyright ⓒ 2019 by The Korean College of Rheumatology. All rights reserved.
This is an Open Access article, which permits unrestricted non-commerical use, distribution, and reproduction in any medium, provided the original work is properly cited.
Causal Association between Bone Mineral Density and Osteoarthritis: A Mendelian Randomization Study
Gwan Gyu Song, Young Ho Lee
Department of Rheumatology, Korea University College of Medicine, Seoul, Korea
Objective. To examine whether bone mineral density (BMD) is causally associated with osteoarthritis (OA). Methods. We per- formed a two-sample Mendelian randomization (MR) analysis using the inverse-variance weighting (IVW), weighted median, and MR-Egger regression methods. We used publicly available summary statistics datasets of a genome-wide association study (GWAS) on femur neck (FN) BMD of individuals of European ancestry as the exposure and a GWAS for non-cancer illness code self-reported: OA from the individuals included in the UK Biobank as the outcome. Results. We selected 21 independent sin- gle-nucleotide polymorphisms with genome-wide significance (p<5.00E-08) from GWAS on FN BMD as the instrumental variables. The IVW method (beta=0.010, standard error [SE]=0.003, p=0.002) and the weighted median approach (beta=0.011, SE=0.004, p=0.006) yielded evidence of a causal association between FN BMD and OA. However, the MR-Egger analysis showed no causal association between FN BMD and OA (beta=0.005, SE=0.017, p=0.753). Since MR-Egger regression suffers from a lack of power and a susceptibility to weak instrument bias, the MR analysis results may sup- port a causal association between FN BMD and OA. Conclusion. The results of MR analysis by IVW and weighted median, but not MR-Egger regression indicate that FN BMD is likely to be causally associated with an increased risk of OA incidence The current findings may provide an opportunity to elucidate the underlying mechanisms of the effects of BMD on the OA incidence. (J Rheum Dis 2019;26:104-110)
Key Words. Bone density, Osteoarthritis, Mendelian randomization
INTRODUCTION
Osteoarthritis (OA) is the most common joint disorder characterized by a progressive degeneration of articular cartilage, joint pain, and immobility [1]. OA is the major cause of pain and disability in elderly people. The preva- lence of OA continues to increase worldwide [2] and the health burden of OA increases with increasing longevity.
Therefore, a better understanding of the causal risk fac- tors associated with OA is needed. Although the etiology of OA is not fully understood, environmental factors like- ly play an important role in the development of OA in ge- netically susceptible individuals.
Many risk factors including older age, female gender, higher body mass index, and joint injury have been identi-
fied to be associated with OA [3,4]. OA is more common in individuals with high bone mineral density (BMD), and observational studies have found that higher BMD is as- sociated with an increased risk of OA [5,6]. Although these results suggested a possible common role of bone turnover and repair in manifestations of OA, the mecha- nism for this action is unclear. In addition, causal associa- tion remains unclear, because observational studies are prone to bias, such as reverse causation and residual con- founding, thereby precluding a clear understanding of the effects of high BMD on OA [7].
Mendelian randomization (MR) is a technique that uses genetic variants as instrumental variables (IVs) to assess whether an observational association between a risk fac- tor and an outcome is consistent with a causal effect [8].
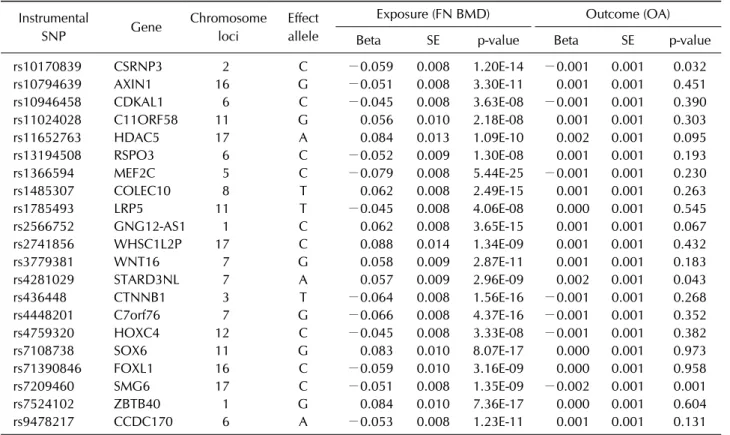
Table 1. Instrumental SNPs associated with femur neck BMD and OA GWASs Instrumental
SNP Gene Chromosome
loci
Effect allele
Exposure (FN BMD) Outcome (OA)
Beta SE p-value Beta SE p-value
rs10170839 CSRNP3 2 C −0.059 0.008 1.20E-14 −0.001 0.001 0.032
rs10794639 AXIN1 16 G −0.051 0.008 3.30E-11 0.001 0.001 0.451
rs10946458 CDKAL1 6 C −0.045 0.008 3.63E-08 −0.001 0.001 0.390
rs11024028 C11ORF58 11 G 0.056 0.010 2.18E-08 0.001 0.001 0.303
rs11652763 HDAC5 17 A 0.084 0.013 1.09E-10 0.002 0.001 0.095
rs13194508 RSPO3 6 C −0.052 0.009 1.30E-08 0.001 0.001 0.193
rs1366594 MEF2C 5 C −0.079 0.008 5.44E-25 −0.001 0.001 0.230
rs1485307 COLEC10 8 T 0.062 0.008 2.49E-15 0.001 0.001 0.263
rs1785493 LRP5 11 T −0.045 0.008 4.06E-08 0.000 0.001 0.545
rs2566752 GNG12-AS1 1 C 0.062 0.008 3.65E-15 0.001 0.001 0.067
rs2741856 WHSC1L2P 17 C 0.088 0.014 1.34E-09 0.001 0.001 0.432
rs3779381 WNT16 7 G 0.058 0.009 2.87E-11 0.001 0.001 0.183
rs4281029 STARD3NL 7 A 0.057 0.009 2.96E-09 0.002 0.001 0.043
rs436448 CTNNB1 3 T −0.064 0.008 1.56E-16 −0.001 0.001 0.268
rs4448201 C7orf76 7 G −0.066 0.008 4.37E-16 −0.001 0.001 0.352
rs4759320 HOXC4 12 C −0.045 0.008 3.33E-08 −0.001 0.001 0.382
rs7108738 SOX6 11 G 0.083 0.010 8.07E-17 0.000 0.001 0.973
rs71390846 FOXL1 16 C −0.059 0.010 3.16E-09 0.000 0.001 0.958
rs7209460 SMG6 17 C −0.051 0.008 1.35E-09 −0.002 0.001 0.001
rs7524102 ZBTB40 1 G 0.084 0.010 7.36E-17 0.000 0.001 0.604
rs9478217 CCDC170 6 A −0.053 0.008 1.23E-11 0.001 0.001 0.131
SNP: single nucleotide polymorphism, BMD: bone mineral density, OA: osteoarthritis, GWAS: genome-wide association study, FN: femur neck, Beta: beta coefficient, SE: standard error, CSRNP3: cysteine and serine rich nuclear protein 3, AXIN1: axin 1, CDKAL1: CDK5 regulatory subunit associated protein 1 like 1, C11ORF58: chromosome 11 open reading frame 58, HDAC5:
histone deacetylase 5, RSPO3: R-spondin 3, MEF2C: myocyte enhancer factor 2C, COLEC10: collectin subfamily member 10, LRP5: LDL receptor related protein 5, GNG12-AS1: GNG12 antisense RNA 1, WHSC1L2P: Wolf-Hirschhorn syndrome candidate 1-like 2, pseudogene, WNT16: Wnt family member 16, STARD3NL: STARD3 N-terminal like, CTNNB1: catenin beta 1, C7orf76:
chromosome 7 open reading frame 76, HOXC4: homeobox C4, SOX6: SRY-box 6, FOXL1: forkhead box L1, SMG6: SMG6, nonsense mediated MRNA decay factor, ZBTB40: zinc finger and BTB domain containing 40, CCDC170: coiled-coil domain containing 170.
A two-sample MR estimates causal effects where data on the exposure and outcome have been measured in differ- ent samples [9]. To the best of our knowledge, MR has not previously been used to explore causal effects of BMD on the incidence of OA. Thus, the aim of this study was to ex- amine whether BMD is causally associated with incidence of OA using a two-sample MR analysis.
MATERIALS AND METHODS
Data sources and selection of genetic variants We searched the MR Base database (http://www.mrba- se.org/), which houses a large collection of summary sta- tistics data from hundreds of genome-wide association studies (GWASs). We used publicly available summary
statistics dataset of a GWAS on FN BMD of individuals of European ancestry from the general population (up to 49,988) as the exposure [10]. Genetic variants associated with femur neck (FN) BMD were used as IVs to improve inference based on p-value threshold of 5.00E-08 (genome-wide significance). We obtained summary sta- tistics (beta coefficients and standard errors) for 21 in- dependent single-nucleotide polymorphisms (SNPs) as- sociated with FN BMD as the IVs from relevant GWAS [10]. We used the publicly available summary statistic da- tasets of a GWAS for OA from the individuals included in the UK Biobank (up to 46,268 cases and 185,610 con- trols) (http://www.nealelab.is/uk-biobank/) as the out- come [11]. Both GWAS data on BMD and OA were ad- justed for age, sex, and weight [10,11].
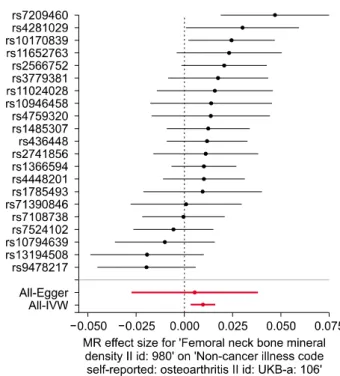
Figure 1. Forest plot of the causal effects of BMD-associated SNPs on OA. BMD: bone mineral density, SNP: single nucleo- tide polymorphism, OA: osteoarthritis, IVW: inverse-variance weighting, MR: Mendelian randomization.
Statistical analysis for Mendelian randomization MR analysis requires genetic variants to be related to, but not potential confounders of, an exposure [12]. First, we assessed the independent association of SNPs with FN BMD. Second, we examined the association between each SNP and incidence of OA. Third, we combined these find- ings to estimate the causal association between FN BMD and incidence of OA using MR analysis. We performed two-sample MR, a method used to estimate the causal ef- fects of an exposure (FN BMD) on outcomes (OA) using summary statistics from different GWASs [13], to assess the causal relationship between FN BMD and incidence of OA, using summary data from GWASs related to FN BMD and OA with 21 SNPs as IVs (Table 1).
The IVW method uses a meta-analysis approach to com- bine the Wald ratio estimates of the causal effect obtained from different SNPs and provide an estimate of the causal effect of the exposure on the outcome when each of the genetic variant satisfies the assumptions of an in- strumental variable [13]. Although the inclusion of mul- tiple variants in an MR analysis results in increased stat- istical precision, it has the potential to include pleiotropic genetic variants that are not valid IVs [14]. To explore and adjust for pleiotropy, i.e., the association of genetic var- iants with more than one variable, the weighted median and MR-Egger regression approaches were utilized.
MR-Egger regression analysis, which is robust to invalid instruments, tests and accounts for the presence of un- balanced pleiotropy by introducing a parameter for this bias by incorporating summary data estimates of causal effects from multiple individual variants [15]. MR-Egger applies a weighted linear regression of the gene-outcome coefficients on the gene-exposure coefficients [15]. The slope of this regression represents the causal effect esti- mate, and the intercept can be interpreted as an estimate of the average horizontal pleiotropic effect across the ge- netic variants [16]. MR-Egger regression was used to as- sess the potential for violations of MR assumptions and to improve the reliability of causal inference. The weight- ed median estimator provides a precise estimate of the causal effect, even when up to 50% of the information contributing to the analysis comes from genetic variants that are invalid IVs [17]. The weighted median estimator has the advantage of retaining greater precision in the es- timates compared to the MR-Egger analysis [17]. The analyses were considered statistically significant at p
<0.05. All MR analyses were performed on the MR Base platform (app version: 1.2.1 e646be (27 June 2018), R
version: 3.5.0) [18].
Heterogeneity and sensitivity test
We assessed heterogeneities between SNPs using Cochran’s Q-statistics [19] and I2 statistic [20,21]. We al- so performed a “leave-one-out” analysis, where the analy- sis is re-performed, sequentially excluding one instru- ment at a time, to test if the result was being driven by any one variant.
RESULTS
Instrumental variables for Mendelian randomization We selected 21 independent SNPs from GWAS on FN BMD as the IVs. All of them are associated with FN BMD with genome-wide significance (Table 1, Figure 1). The F-statistic was used to verify the validity of IVs. A p-value of 5.00E-08 corresponded to F>30 for each single variant [12] and a threshold of F<10 was used to define a “weak IV”. Thus, weak instrument bias was negligible. Sixteen of the 21 SNPs were associated with OA, and the associa- tion with rs7209460, rs4281029, and rs10170839 was statistically significant and the 3 SNPs also included as IVs (Table 1, Figure 1).
Table 2. The MR estimates from each method of assessing the causal effect of femur neck BMD on the incidence of OA MR method Number of
SNPs Beta SE 95 % confidence interval
Association p-value
Cochran’s
Q statistic I2 Heterogeneity p-value Inverse variance weighted 21 0.010 0.003 0.004∼0.016 0.002 27.39 0.262 0.125
MR Egger 21 0.005 0.017 −0.028∼0.038 0.753 27.28 0.304 0.098
Weighted median 21 0.011 0.004 0.003∼0.019 0.006 27.10* 0.270* 0.133*
MR: Mendelian randomization, BMD: bone mineral density, OA: osteoarthritis, SNP: single nucleotide polymorphism, Beta: beta coefficient, SE: standard error. *Maximum likelihood method, I2=(Q-df)/Q [21].
Figure 3. “Leave-one-out” analysis to investigate the possi- bility that the causal association was driven by a unique SNP.
SNP: single nucleotide polymorphism, MR: Mendelian randomization.
Figure 2. Scatter plots of genetic associations with BMD against the genetic associations with OA. The slopes of each line represent the causal association for each method. The blue line represents the inverse-variance weighting estimate, the green line represents the weighted median estimate, and the dark blue line represents the Mendelian randomization‐
Egger estimate. BMD: bone mineral density, OA: osteo- arthritis, SNP: single nucleotide polymorphism.
Mendelian randomization results
The IVW method showed evidence to support a causal association between FN BMD and OA (beta=0.010, standard error [SE]=0.003, p=0.002, OR per genetically predicted 1 standard deviation in FN BMD=1.011) (Table 2, Figures 1 and 2). The intercept represents the average pleiotropic effect across the genetic variants (the average direct effect of a variant with the outcome). If the inter- cept differs from zero (the MR-Egger test), then there is an evidence of directional pleiotropy. MR-Egger re- gression analysis revealed that directional pleiotropy was unlikely to bias the result (intercept=0.0003; p=0.784).
The MR-Egger analysis showed no causal association be- tween FN BMD and OA (beta=0.005, SE=0.017, p=0.753) (Table 2, Figures 1 and 2). However, the weighted median approach yielded evidence of a causal association between FN BMD and OA (beta=0.011,
SE=0.004, p=0.006) (Table 2, Figure 2). Thus, IVW and weighted median method suggested a causal effect of FN BMD on OA risk, whereas the MR-Egger method sug- gests a null causal effect. Considering that the weighted median estimator has the advantage of retaining greater precision compared to the MR-Egger analysis [17], it may be suggested the MR analysis results support a causal as- sociation between FN BMD and OA. The common risk factor for both high BMD and OA is obesity. Thus obesity is a major confounding factor for this analysis. Therefore, we checked whether significantly associated SNPs with OA including rs7209460, rs4281029, and rs10170839 were associated with obesity. We did a literature search on the association between leading SNPs and obesity through searching PUBMED and GWAS results database
(https://www.ebi.ac.uk/gwas/). There was no evidence of their associations with obesity, indicating obesity may not act as confounding factor in this MR analysis.
Heterogeneity and sensitivity test
Cochran’s Q test indicated no evidence of heterogeneity between IV estimates based on the individual variants (Table 2). Heterogeneity is the variability in the causal es- timates obtained for each SNP (i.e., how consistent is the causal estimate across all SNPs). Low heterogeneity sug- gested increased reliability of MR estimates. I2 values showed low heterogeneity, indicating increased reliability of MR estimates (Table 2). Results from the “leave-one-out”
analysis demonstrated that no single SNP was driving the IVW point estimate (Figure 3).
DISCUSSION
BMD has been considered to be a risk factor for OA [5,6,22]. However, it remains unclear whether BMD has a causal relationship with OA, because previously re- ported associations between BMD and osteoarthritis may be the result of bias or confounding factors inherent to observational studies, such as body weight, physical ac- tivity, reverse causation, a small number of studies of small sizes, and selection bias [7]. MR minimizes the pos- sibility of bias inherent to observational studies [23].
Thus, we carried out three different estimating methods (inverse variance weighting method, weighted median method, and MR-Egger regression) for the MR analyses.
Our study indicated that the associations between FN BMD and OA may be causal. Although the MR estimates using IVW, MR Egger, and weighted median analysis were not consistent. IVW and weighted median analysis supported a causal association between FN BMD and OA, whereas MR Egger analysis did not. As all the variants used in MR may not be the valid instruments, pleiotropy robust tools for sensitivity analysis including MR-Egger regression and the weighted median approach have been developed. Both MR-Egger and the weighted median should be considered as a tool for sensitivity analysis rather than as a primary analysis tool. However, un- fortunately, MR-Egger regression suffers from a lack of power, a susceptibility to weak instrument bias, and low precision. Considering these limitations of MR-Egger re- gression [17], a weighted median may be a better way to adjust pleiotropy than MR-Egger regression. Thus, our study corroborated the association found in previous ob-
servational studies [5,6,22].
MR studies are susceptible to bias from pleiotropy (association of genetic variants with more than one varia- ble) [24]. Although the inclusion of multiple variants in MR analysis typically leads to increased statistical pre- cision, it also results in the potential inclusion of pleio- tropic genetic variants that are not valid IVs [25].
Therefore, the approaches for the sensitivity analysis need to be applied to verify the validity of conclusions drawn from the MR study. To eliminate pleiotropy, we employed a weighted median estimator, which provides valid estimates even if 50% of the SNPs are not valid in- struments [17], and we used MR-Egger regression ap- proach to provide a test for unbalanced pleiotropy and a causal estimate of the influence of exposure on outcome in its presence [15]. Our results using all three ap- proaches were not consistent, but the MR-Egger ap- proach showed no evidence for unbalanced pleiotropy as indicated by intercept p-value. The MR-Egger method led to loss of precision and power, but our weighted median estimator results were also similar to the IVW estimator, thereby providing additional confidence for these associations. Our data was in agreement with the pre- vious observational studies, which have shown an associ- ation between BMD and OA. Increased OA risk may be a direct consequence of high BMD. Probability of OA in- cidence may be enhanced as a direct consequence of high BMD due to mechanical pressure applied to cartilage from the underlying subchondral cortical plate [26].
MR rests on three assumptions of the InSIDE (instrument strength independent of direct effect). The first assumption was evaluated directly by examining the strength of association of the IV SNPs with exposure (FN BMD). We proved the second assumption by checking that significantly associated SNPs with OA were not asso- ciated with obesity. Third assumption was evaluated by MR-egger regression test, which indicated that direc- tional pleiotropy was unlikely to bias the result. Our MR analysis may hold the InSIDE assumptions and the causal estimate may be reliable.
The present study has several limitations. First, our analysis included a relatively small number of SNPs as IVs, which might not have been statistically significant enough to detect an association; the statistical precision can be increased and a more precise causal estimate can be obtained by combining multiple genetic variants together. In addition, OA was included in this MR analy- sis regardless of OA site. Subgroup analysis by OA site
showed a trend of causal relationship between BMD and OA due to decreased sample size in each subgroup. Thus, we combined all samples into one OA group to improve statistical power, because observational studies showed associations between high BMD and OA risk of knee and hip [5,6,22]. Finally, individuals with OA were classified by non-cancer illness code self-reported, which might cause potential bias, such as selection bias and in- formation bias, compared to radiographic OA criteria.
Unlike observational studies on associations between high BMD and higher risk of OA [5,6,22], our study was not susceptible to bias from unmeasured confounders or reverse causation by adopting MR approaches, and dem- onstrated that FN BMD may play a causal role in OA etiology. MR analysis presented in this study was reliable.
Although BMD has been studied as a potential risk factor for OA, an MR study has been never performed. This is the first study on the causal relationship between BMD and OA.
CONCLUSION
In conclusion, the results of MR analysis by IVW and weighted median, but not MR-Egger regression indicate that FN BMD is likely to be causally associated with an in- creased risk of OA incidence. The current findings may provide an opportunity to elucidate the underlying mech- anisms of the effects of BMD on the OA incidence.
CONFLICT OF INTEREST
No potential conflict of interest relevant to this article was reported.
REFERENCES
1. Dieppe PA, Lohmander LS. Pathogenesis and management of pain in osteoarthritis. Lancet 2005;365:965-73.
2. Litwic A, Edwards MH, Dennison EM, Cooper C.
Epidemiology and burden of osteoarthritis. Br Med Bull 2013;105:185-99.
3. Silverwood V, Blagojevic-Bucknall M, Jinks C, Jordan JL, Protheroe J, Jordan KP. Current evidence on risk factors for knee osteoarthritis in older adults: a systematic review and meta-analysis. Osteoarthritis Cartilage 2015;23:507-15.
4. Park EH, Kim JS, Lee JS, Lee YJ, Song YW, Lee EY.
Compound K inhibits interleukin-1β-induced expression of inflammatory mediators and matrix metalloproteinases by inhibiting mitogen-activated protein kinase activation in chondrocytes. J Rheum Dis 2018;25:188-96.
5. Hart DJ, Cronin C, Daniels M, Worthy T, Doyle DV, Spector TD. The relationship of bone density and fracture to in- cident and progressive radiographic osteoarthritis of the knee: the Chingford study. Arthritis Rheum 2002;46:92-9.
6. Nevitt MC, Zhang Y, Javaid MK, Neogi T, Curtis JR, Niu J, et al. High systemic bone mineral density increases the risk of incident knee OA and joint space narrowing, but not ra- diographic progression of existing knee OA: the MOST study. Ann Rheum Dis 2010;69:163-8.
7. Ranstam J. Bias in observational studies. Acta Radiol 2008;
49:644-5.
8. Burgess S, Daniel RM, Butterworth AS, Thompson SG;
EPIC-InterAct Consortium. Network Mendelian random- ization: using genetic variants as instrumental variables to investigate mediation in causal pathways. Int J Epidemiol 2014;44:484-95.
9. Lawlor DA. Commentary: two-sample Mendelian random- ization: opportunities and challenges. Int J Epidemiol 2016;
45:908-15.
10. Zheng HF, Forgetta V, Hsu YH, Estrada K, Rosello‐Diez A, Leo PJ, et al. Whole‐genome sequencing identifies EN1 as a determinant of bone density and fracture. Nature 2015;
526:112-7.
11. Zengini E, Hatzikotoulas K, Tachmazidou I, Steinberg J, Hartwig FP, Southam L, et al. Genome-wide analyses using UK Biobank data provide insights into the genetic archi- tecture of osteoarthritis. Nat Genet 2018;50:549-58.
12. Burgess S, Butterworth A, Thompson SG. Mendelian ran- domization analysis with multiple genetic variants using summarized data. Genet epidemiol 2013;37:658-65.
13. Pierce BL, Burgess S. Efficient design for Mendelian ran- domization studies: subsample and 2-sample instrumental variable estimators. Am J Epidemiol 2013;178:1177-84.
14. Hartwig FP, Davies NM, Hemani G, Davey Smith G.
Two-sample Mendelian randomization: avoiding the down- sides of a powerful, widely applicable but potentially fallible technique. Int J Epidemiol 2016;45:1717-26.
15. Bowden J, Davey Smith G, Burgess S. Mendelian random- ization with invalid instruments: effect estimation and bias detection through Egger regression. Int J Epidemiol 2015;44:512-25.
16. Burgess S, Thompson SG. Interpreting findings from Mendelian randomization using the MR-Egger method. Eur J Epidemiol 2017;32:377-89.
17. Bowden J, Davey Smith G, Haycock PC, Burgess S.
Consistent estimation in Mendelian randomization with some invalid instruments using a weighted median estimator. Genet Epidemiol 2016;40:304-14.
18. Hemani G, Zheng J, Elsworth B, Wade KH, Haberland V, Baird D, et al. The MR-base platform supports systematic causal inference across the human phenome. Elife 2018:7.
pii: e34408.
19. Egger M, Smith GD, Phillips AN. Meta-analysis: principles and procedures. BMJ 1997;315:1533-7.
20. Bowden J, Del Greco M F, Minelli C, Davey Smith G, Sheehan NA, Thompson JR. Assessing the suitability of summary data for two-sample Mendelian randomization analyses using MR-Egger regression: the role of the I2 statistic. Int J Epidemiol 2016;45:1961-74.
21. Higgins JP, Thompson SG. Quantifying heterogeneity in a meta-analysis. Stat Med 2002;21:1539-58.
22. Nevitt MC, Lane NE, Scott JC, Hochberg MC, Pressman AR, Genant HK, et al. Radiographic osteoarthritis of the hip and bone mineral density. The study of osteoporotic fractures research group. Arthritis Rheum 1995;38:907-16.
23. Smith GD, Ebrahim S. Mendelian randomization: genetic variants as instruments for strengthening causal inference in observational studies. In: Weinstein M, Vaupel JW, Wachter KW, National Research Council (U.S.).
Committee on Advances in Collecting and Utilizing Biological Indicators and Genetic Information in Social Science Surveys., National Research Council (U.S.).
Committee on Population, 2006-2007, eds. Biosocial
surveys. Washington, D.C., National Academies Press, 2008.
24. Thompson JR, Minelli C, Bowden J, Del Greco FM, Gill D, Jones EM, et al. Mendelian randomization incorporating un- certainty about pleiotropy. Stat Med 2017;36:4627-45.
25. Smith GD, Ebrahim S. Mendelian randomization: pros- pects, potentials, and limitations. Int J Epidemiol 2004;33:
30-42.
26. Lo GH, Niu J, McLennan CE, Kiel DP, McLean RR, Guermazi A, et al. Meniscal damage associated with in- creased local subchondral bone mineral density: a Framingham study. Osteoarthritis Cartilage 2008;16:261-7.