https://doi.org/10.4174/astr.2018.94.6.312 Annals of Surgical Treatment and Research
Diagnostic value of peripheral blood immune profiling in colorectal cancer
Joungbum Choi1, Hyung Gun Maeng1, Su Jin Lee1, Young Joo Kim1, Da Woon Kim1, Ha Na Lee1, Ji Hyeon Namgung1, Hyun-Mee Oh1, Tae Joo Kim1, Ji Eun Jeong2, Sang Jean Park2, Yong Man Choi2, Yong Won Kang3, Seo Gue Yoon3, Jong Kyun Lee1,2
1Immunology Laboratory, Seoul Song Do Colorectal Hospital, Seoul, Korea
2Cancer Immune Clinic, Seoul Song Do Colorectal Hospital, Seoul, Korea
3Department of Surgical Oncology, Seoul Song Do Colorectal Hospital, Seoul, Korea
INTRODUCTION
Colorectal cancer (CRC) is the third most commonly diag- nosed cancer worldwide. The cause of CRC is not clear. However, it is regarded as a multifactorial disease affected by diverse factors such as aging, diet, obesity, smoking, drinking, and gene
mutations [1]. Therefore, the best method of preventing CRC is to live a well-regulated life and have regular screening tests for the detection of polyps before they become cancerous. To screen for CRC, stool test, sigmoidoscopy, and colonoscopy are widely used, and these are considered gold standards for the detection of CRC. In addition, several blood biomarkers of CRC have been
Received September 4, 2017, Revised October 25, 2017, Accepted November 6, 2017
Corresponding Author: Jong Kyun Lee
Department of Surgery Oncology, Immunology Laboratory, Seoul Song Do Colorectal Hospital, 78 Dasan-ro, Jung-gu, Seoul 04597, Korea Tel: +82-2-2250-7848, Fax: +82-2-2233-8528
E-mail: leejksd@gmail.com
ORCID code: https://orcid.org/0000-0002-1298-0494
Copyright ⓒ 2018, the Korean Surgical Society
cc Annals of Surgical Treatment and Research is an Open Access Journal. All articles are distributed under the terms of the Creative Commons Attribution Non- Commercial License (http://creativecommons.org/licenses/by-nc/4.0/) which permits unrestricted non-commercial use, distribution, and reproduction in any medium, provided the original work is properly cited.
Purpose: Little is known about the clinical value of peripheral blood immune profiling. Here, we aimed to identify colorectal cancer (CRC)-related peripheral blood immune cells and develop liquid biopsy-based immune profiling models for CRC diagnosis.
Methods: Peripheral blood from 131 preoperative patients with CRC and 174 healthy controls was analyzed by flow cytometry and automated hematology. CRC-related immune factors were identified by comparing the mean values of immune cell percentages and counts. Subsequently, CRC diagnostic algorithms were constructed using binary logistic regression.
Results: Significant differences were observed in percentages and counts of white blood cells, lymphocytes, neutrophils, regulatory T cells, and myeloid-derived suppressor cells (MDSCs) of patients and controls. The neutrophil/lymphocyte and Th1/Th2 ratios were also significantly different. Likewise, the percentages and counts of peripheral blood programed death 1, cytotoxic T lymphocyte antigen 4, B-and T-lymphocyte attenuator, and lymphocyte activation gene-3 were higher in patients with CRC. The binary logistic regression model included 12 variables, age, CD3+%, NK%, CD4+CD279+%, CD4+CD25+%, CD4+CD152+%, CD3+CD366+%, CD3+CD272+%, CD3+CD223+%, CD158b–CD314+CD3–CD56+%, Th2%, and MDSCs cells/μL, for the prediction of cancer. Results of retro spective and prospective evaluation of the area under the curve, sensitivity, and specificity were 0.980 and 0.940, 91.53% and 85.80%, and 93.50% and 86.20%, respectively.
Conclusion: Peripheral blood immune profiling may be valuable in evaluating the immunity of CRC patients. Our liquid biopsy-based immune diagnostic method and its algorithms may serve as a novel tool for CRC diagnosis. Future large- scale studies are needed for better characterization of its diagnostic value and potential for clinical application.
[Ann Surg Treat Res 2018;94(6):312-321]
Key Words: Colorectal neoplasms, Early diagnosis of cancer, Blood cells, Flow cytometry
reported to improve diagnostic accuracy, and identifying CRC derivatives such as circulating tumor DNA and exosomes by liquid biopsy has been a focus of research in recent years [2].
In general, cancer immunity is considered a combination of the local immune response in the tumor microenvironment and the systemic immune response in circulating peripheral blood [3]. Most studies on cancer immunity have examined tumor microenvironments alone because of uncertainty about whether or not peripheral blood immunity is correlated with tumor progression [4]. However, studying the tumor microenvironment as the source of cancer immunity has some limitations because it is neither easily accessible nor available in all patients and healthy people [5]. This technical limitation might have hampered the development of reliable immunodiagnostic tests for cancer, whereas tests for other immune disorders such as allergy, autoimmune disease, and rejection of organ transplantation are more readily available.
In this respect, peripheral blood immune cells can provide real-time accessibility and offer an alternative window on cancer immunity. However, peripheral immunity has long been regarded as a minor part of the immune system, because it is not clear whether local cancer immunity always correlate with systemic immunity [3,5].
Despite this uncertainty, considerable information on can cer immunity has been gained by studying tumor micro environ- ments in parallel with peripheral blood. Peripheral blood is rich in various immune cells and soluble molecules that generate a systemic immune response, and valuable information from studying the peripheral blood remains to be discovered [6].
In this study, we identified cancer-related blood immune cells and associated molecules, and then estimated the likelihood of developing immunodiagnostics for determining cancer prog nosis. We believe that our data shows that analyses of the peripheral blood immune system are valuable not only for cancer diagnosis and prognosis but also for personalized cancer im munotherapy.
METHODS
Subjects
Peripheral blood from 131 preoperative patients with CRC and 174 healthy individuals was drawn for this study. All par ti ci pants, before providing blood, were administered a ques tionnaire to confirm their condition and health history.
Those who did not meet our criterion of a healthy state were excluded. Exclusion criteria included chronic inflammation, auto immune disease, allergy, severe anemia, hypertension, and hyper cholesterolemia. Former cancer patients and pregnant women were also excluded. This study was performed with the approval of the Institutional Review Board of Seoul Song Do Colorectal Hospital (approval number: 2016-003) and registered
in the Clinical Research Information Service (KCT0002469).
Study design
As not much is known about the peripheral blood cancer immunity, we assumed that there exist certain cancer-related immune compartments in the blood stream equivalent to tumor microenvironment, thereby selecting potential targets as follows: (1) list of the tumor-infiltrating lymphocyte subsets and immune checkpoint (ICP) molecules well described in tumor microenvironment, (2) selection of potential diagnostic markers among them according to priority of clinical relevance in terms of usefulness for evaluation of prognosis, survival, and treat- ment of cancer, (3) technical classification of testing targets into 7 categories for flow cytometric analysis: natural killer (NK) cells, helper T cells, myeloid-derived suppressor cells (MDSCs), regulatory T cells (Tregs), cytotoxic T cells (CTLs), ICPs, and gamma-delta T cells (GDTs).
Fluorochrome-conjugated antibodies
All antibodies used in this study were tagged with 4-color fluorochromes for detection by FL1, FL2, FL3, and FL4. For each cells type, the following antibodies were used: For NK cells, anti-CD3-fluorescein isothiocyanate (FITC; 1:100; cat. no.
555339; lot no. 6125658), anti-CD56-phycoerythrin (PE; 1:20; cat.
no. 555516; lot no. 6054620), anti-CD314 (NKG2D)-PE–Cy7 (1:20;
cat. no. 555348; lot no. 6140911), and anti-CD158b (KIR2DL3)- Allophycocyanin (APC; 1:100; cat. no. 312612; lot no. B210467;
BioLegend); for helper T cells, anti-CD183 (CXCR3)-Alexa Fluor488 (1:100; cat. no. 558047; lot no. 6155849), anti-CD194 (CCR4)-PE (1:100; cat. no. 551120; lot no. 5107877), anti-CD4-PE–
Cy5 (1:100; cat. no. 555348; lot no. 5037589), and anti-CD196 (CCR6)-APC (1:200; cat. no. 560619; lot no. 5135834); for MDSCs, anti-CD3-FITC (1:100; cat. no. 555339; lot no. 6125658), anti- CD19-FITC (1:100; cat. no. 555412; lot no. 5097663), anti-CD56- PE (1:20; cat. no. 555516; lot no. 6054620), anti-CD11b-PE (1:500;
cat. no. 555388; lot. no. 4314750), anti-HLA–DR-PE–Cy5 (1:20;
cat. no. 555813; lot no. 6132725 ), and anti-CD33-APC (1:500; cat.
no. 551378; lot. no. 4288542); for Tregs, anti-CD4-FITC (1:100;
cat. no. 555346; lot no. 5097644 ), anti-CD25-PE (1:20; cat. no.
555432; lot no. 6040885), anti-CD152 (CTLA–4)-PE–Cy7 (1:20; cat.
no. 555854; lot no. 5142830), and anti-CD279 (PD–1)-APC (1:20;
cat. no. 558694; lot no. 6154800); for CTLs, anti-CD3-FITC (1:100;
cat. no. 555339; lot no. 6125658), anti-CD8-PE (1:100; cat. no.
555635; lot no. 4364551), anti-CD152 (CTLA–4)-PE–Cy7 (1:20; cat.
no. 555854; lot no. 5142830), and anti-CD279 (PD–1)-APC (1:20;
cat. no. 558694; lot no. 6154800); for ICP, anti-CD3-FITC (1:100;
cat. no. 555339; lot no. 6125658), anti-CD366 (TIM-3)-PE (1:500;
cat. no. 563422; lot. no. 5082811), anti-CD272 (BTLA)-PerCP (1:50; cat. no. FAB3354C; lot no. ABCC212071; R&D Systems, Minneapolis, MN, USA), and anti-CD223 (LAG–3)-APC (1:20; cat.
no. FAB23193A; lot no. ADXM0116041; R&D Systems); for GDT,
anti-CD3-FITC (1:100; cat. no. 555339; lot no. 6125658), and anti- γδ TCR-PE (1:50; cat. no. 555717; lot no. 5267944). All antibodies were obtained from BD Biosciences (Franklin Lakes, NJ, USA), with the exception of those companies noted in parentheses.
The cell staining volume of the antibody mixture per test was fixed at 10 μL, and the antibody dilution was calculated relative to 50 μL of blood. For instance, 0.5 μL of anti-CD3 antibody, 2.5 μL of anti-CD56 antibody, 2.5 μL of anti-CD314 antibody, and 0.5 μL of anti-CD158b antibody were mixed with 4 μL of phosphate buffered-saline (PBS) in the single tube for the NK cell analysis, because all target antigens were surface bound.
For surface staining, 0.5 μL of anti-CD4 antibody, 2.5 μL of anti- CD25 antibody, and 2.5 μL of anti-CD279 antibody were mixed with 4.5 μL of PBS in one tube, and, for intracellular staining of Tregs, 2.5 μL of anti-CD152 antibody was mixed with 7.5 μL of PBS in another tube.
Flow cytometry
For the analysis of NK cells, helper T cells, MDSCs, and GDTs, all test antigens were surface bound and directly stained with each antibody as described below: 50 μL of blood was distributed into 12 × 75-mm polypropylene round-bottom test tubes, stained with premixed mouse anti-human antibodies, and incubated for 15 min at room temperature (RT) in the dark. Then, red blood cells were lysed by adding 450 μL of FACS lysing solution (BD Biosciences) to each test tube for 15 minutes at RT in the dark.
Cells were washed two times in 2 mL of PBS by centrifugation at 250 × g for 5 minutes at RT and resuspended in 200 μL of PBS.
Another intracellular staining step was required for analysis of Tregs, CTLs, and ICP molecules. After the lysis of red blood cells, remaining cells were washed in 2 mL of permeabilization buffer composed of 0.1% saponin (Cat No. S7900, Sigma-Aldrich, Merck KGaA, Darmstadt, Germany) in PBS and then resuspended in 200 μL of PBS. Intracellular target antigens were as follows: CD152, CD366, CD272, and CD223. After staining was completed, cells were analyzed by flow cytometry (FACSCalibur; BD Biosciences).
Data were analyzed using CellQuest Pro software version 6.0 (BD Biosciences) and are presented as percentages. Lymphocyte subsets were enumerated using the double platform method to obtain absolute counts from the lymphocyte differentials using an automatic hematology analyzer (Sysmex Corp., Kobe, Japan).
Quality control
Blood samples were collected between 8:00 and 10:00 AM and processed within 2 hours. Fifty microliters of blood was reverse pipetted into the staining tube. Before the study, all antibodies were titered to optimize the test volume by 2-fold serial dilution, and the optimal titer was determined by calculating the stain index. Gating and quadrant location of markers in the dot plot analysis were determined using fluorescence minus one controls. Daily calibration of the flow
cytometer was performed using the manufacturer’s software (FACSComp software, BD Biosciences) and materials (calibrated beads, BD Biosciences).
Statistics
Age- and sex-adjusted covariance testing was used for analyzing the differences between patients and healthy con- trols, and the Student t-test was used for other data. Data analyses were processed using the IBM SPSS ver. 18.0 (IBM Co., Armonk, NY, USA). The receiver operating characteristic (ROC) curve, sensitivity, and specificity were calculated using SigmaPlot 10.0 (Systat Software, Inc., San Jose, CA, USA). Data were considered statistically significant when the P-value was less than 0.05.
RESULTS
Clinical characteristics
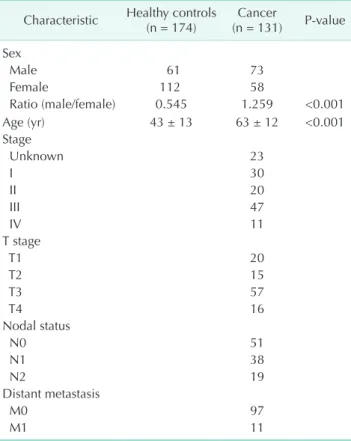
One hundred thirty-one patients (73 males and 58 females) with CRC and 174 healthy controls (61 males and 112 females) were classified by sex and age. There were age (63 ± 12 years vs. 43 ± 13 years, P < 0.001) and sex ratio (1.259 [male] vs. 0.545 [female], P < 0.001) differences between patients and healthy controls. The patients were further classified using the TNM
Table 1. Baseline characteristics of patients with colorectal cancer
Characteristic Healthy controls
(n = 174) Cancer
(n = 131) Pvalue Sex
Male 61 73
Female 112 58
Ratio (male/female) 0.545 1.259 <0.001
Age (yr) 43 ± 13 63 ± 12 <0.001
Stage
Unknown 23
I 30
II 20
III 47
IV 11
T stage
T1 20
T2 15
T3 57
T4 16
Nodal status
N0 51
N1 38
N2 19
Distant metastasis
M0 97
M1 11
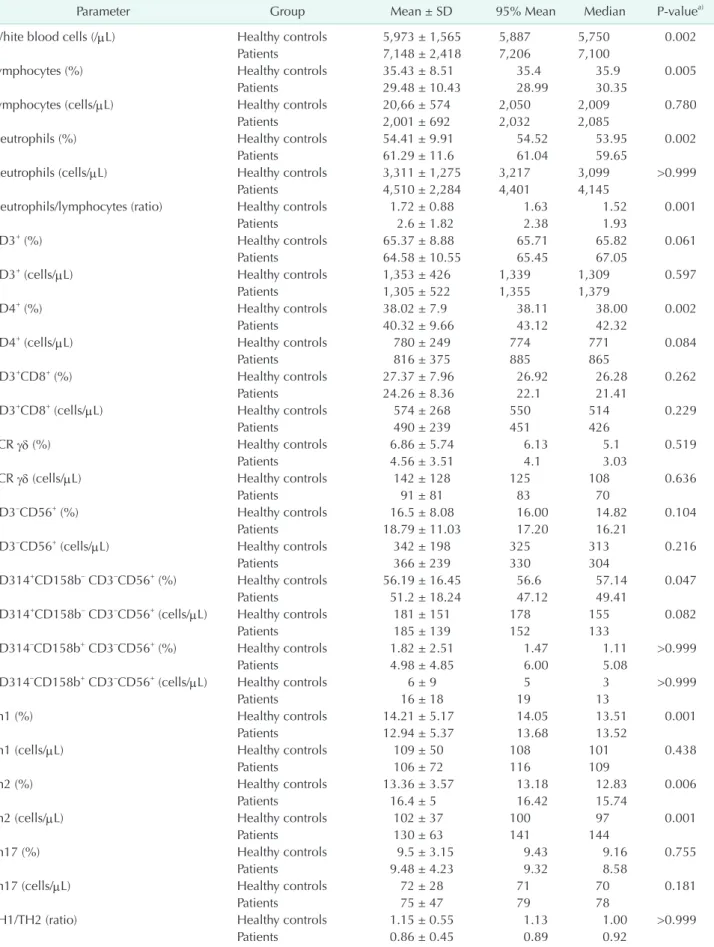
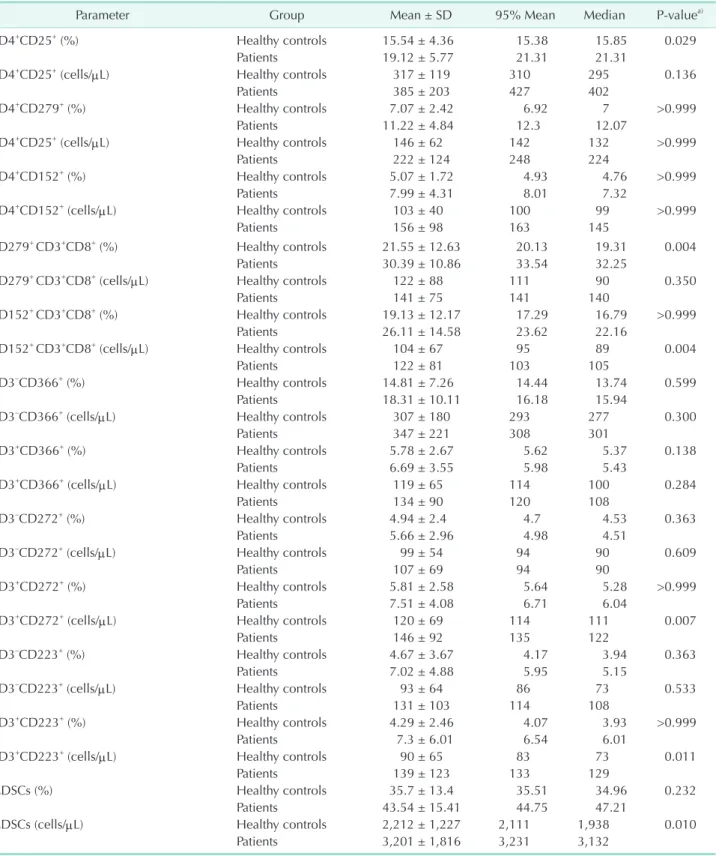
Table 2. Peripheral blood immune cells and immune checkpoint molecules in patients with colorectal cancer
Parameter Group Mean ± SD 95% Mean Median Pvaluea)
White blood cells (/μL) Healthy controls 5,973 ± 1,565 5,887 5,750 0.002
Patients 7,148 ± 2,418 7,206 7,100
Lymphocytes (%) Healthy controls 35.43 ± 8.51 35.4 35.9 0.005
Patients 29.48 ± 10.43 28.99 30.35
Lymphocytes (cells/μL) Healthy controls 20,66 ± 574 2,050 2,009 0.780
Patients 2,001 ± 692 2,032 2,085
Neutrophils (%) Healthy controls 54.41 ± 9.91 54.52 53.95 0.002
Patients 61.29 ± 11.6 61.04 59.65
Neutrophils (cells/μL) Healthy controls 3,311 ± 1,275 3,217 3,099 >0.999
Patients 4,510 ± 2,284 4,401 4,145
Neutrophils/lymphocytes (ratio) Healthy controls 1.72 ± 0.88 1.63 1.52 0.001
Patients 2.6 ± 1.82 2.38 1.93
CD3+ (%) Healthy controls 65.37 ± 8.88 65.71 65.82 0.061
Patients 64.58 ± 10.55 65.45 67.05
CD3+ (cells/μL) Healthy controls 1,353 ± 426 1,339 1,309 0.597
Patients 1,305 ± 522 1,355 1,379
CD4+ (%) Healthy controls 38.02 ± 7.9 38.11 38.00 0.002
Patients 40.32 ± 9.66 43.12 42.32
CD4+ (cells/μL) Healthy controls 780 ± 249 774 771 0.084
Patients 816 ± 375 885 865
CD3+CD8+ (%) Healthy controls 27.37 ± 7.96 26.92 26.28 0.262
Patients 24.26 ± 8.36 22.1 21.41
CD3+CD8+ (cells/μL) Healthy controls 574 ± 268 550 514 0.229
Patients 490 ± 239 451 426
TCR γδ (%) Healthy controls 6.86 ± 5.74 6.13 5.1 0.519
Patients 4.56 ± 3.51 4.1 3.03
TCR γδ (cells/μL) Healthy controls 142 ± 128 125 108 0.636
Patients 91 ± 81 83 70
CD3–CD56+ (%) Healthy controls 16.5 ± 8.08 16.00 14.82 0.104
Patients 18.79 ± 11.03 17.20 16.21
CD3–CD56+ (cells/μL) Healthy controls 342 ± 198 325 313 0.216
Patients 366 ± 239 330 304
CD314+CD158b– CD3–CD56+ (%) Healthy controls 56.19 ± 16.45 56.6 57.14 0.047
Patients 51.2 ± 18.24 47.12 49.41
CD314+CD158b– CD3–CD56+ (cells/μL) Healthy controls 181 ± 151 178 155 0.082
Patients 185 ± 139 152 133
CD314–CD158b+ CD3–CD56+ (%) Healthy controls 1.82 ± 2.51 1.47 1.11 >0.999
Patients 4.98 ± 4.85 6.00 5.08
CD314–CD158b+ CD3–CD56+ (cells/μL) Healthy controls 6 ± 9 5 3 >0.999
Patients 16 ± 18 19 13
Th1 (%) Healthy controls 14.21 ± 5.17 14.05 13.51 0.001
Patients 12.94 ± 5.37 13.68 13.52
Th1 (cells/μL) Healthy controls 109 ± 50 108 101 0.438
Patients 106 ± 72 116 109
Th2 (%) Healthy controls 13.36 ± 3.57 13.18 12.83 0.006
Patients 16.4 ± 5 16.42 15.74
Th2 (cells/μL) Healthy controls 102 ± 37 100 97 0.001
Patients 130 ± 63 141 144
Th17 (%) Healthy controls 9.5 ± 3.15 9.43 9.16 0.755
Patients 9.48 ± 4.23 9.32 8.58
Th17 (cells/μL) Healthy controls 72 ± 28 71 70 0.181
Patients 75 ± 47 79 78
TH1/TH2 (ratio) Healthy controls 1.15 ± 0.55 1.13 1.00 >0.999
Patients 0.86 ± 0.45 0.89 0.92
Table 2. Continued
Parameter Group Mean ± SD 95% Mean Median Pvaluea)
CD4+CD25+ (%) Healthy controls 15.54 ± 4.36 15.38 15.85 0.029
Patients 19.12 ± 5.77 21.31 21.31
CD4+CD25+ (cells/μL) Healthy controls 317 ± 119 310 295 0.136
Patients 385 ± 203 427 402
CD4+CD279+ (%) Healthy controls 7.07 ± 2.42 6.92 7 >0.999
Patients 11.22 ± 4.84 12.3 12.07
CD4+CD25+ (cells/μL) Healthy controls 146 ± 62 142 132 >0.999
Patients 222 ± 124 248 224
CD4+CD152+ (%) Healthy controls 5.07 ± 1.72 4.93 4.76 >0.999
Patients 7.99 ± 4.31 8.01 7.32
CD4+CD152+ (cells/μL) Healthy controls 103 ± 40 100 99 >0.999
Patients 156 ± 98 163 145
CD279+ CD3+CD8+ (%) Healthy controls 21.55 ± 12.63 20.13 19.31 0.004
Patients 30.39 ± 10.86 33.54 32.25
CD279+ CD3+CD8+ (cells/μL) Healthy controls 122 ± 88 111 90 0.350
Patients 141 ± 75 141 140
CD152+ CD3+CD8+ (%) Healthy controls 19.13 ± 12.17 17.29 16.79 >0.999
Patients 26.11 ± 14.58 23.62 22.16
CD152+ CD3+CD8+ (cells/μL) Healthy controls 104 ± 67 95 89 0.004
Patients 122 ± 81 103 105
CD3–CD366+ (%) Healthy controls 14.81 ± 7.26 14.44 13.74 0.599
Patients 18.31 ± 10.11 16.18 15.94
CD3–CD366+ (cells/μL) Healthy controls 307 ± 180 293 277 0.300
Patients 347 ± 221 308 301
CD3+CD366+ (%) Healthy controls 5.78 ± 2.67 5.62 5.37 0.138
Patients 6.69 ± 3.55 5.98 5.43
CD3+CD366+ (cells/μL) Healthy controls 119 ± 65 114 100 0.284
Patients 134 ± 90 120 108
CD3–CD272+ (%) Healthy controls 4.94 ± 2.4 4.7 4.53 0.363
Patients 5.66 ± 2.96 4.98 4.51
CD3–CD272+ (cells/μL) Healthy controls 99 ± 54 94 90 0.609
Patients 107 ± 69 94 90
CD3+CD272+ (%) Healthy controls 5.81 ± 2.58 5.64 5.28 >0.999
Patients 7.51 ± 4.08 6.71 6.04
CD3+CD272+ (cells/μL) Healthy controls 120 ± 69 114 111 0.007
Patients 146 ± 92 135 122
CD3–CD223+ (%) Healthy controls 4.67 ± 3.67 4.17 3.94 0.363
Patients 7.02 ± 4.88 5.95 5.15
CD3–CD223+ (cells/μL) Healthy controls 93 ± 64 86 73 0.533
Patients 131 ± 103 114 108
CD3+CD223+ (%) Healthy controls 4.29 ± 2.46 4.07 3.93 >0.999
Patients 7.3 ± 6.01 6.54 6.01
CD3+CD223+ (cells/μL) Healthy controls 90 ± 65 83 73 0.011
Patients 139 ± 123 133 129
MDSCs (%) Healthy controls 35.7 ± 13.4 35.51 34.96 0.232
Patients 43.54 ± 15.41 44.75 47.21
MDSCs (cells/μL) Healthy controls 2,212 ± 1,227 2,111 1,938 0.010
Patients 3,201 ± 1,816 3,231 3,132
SD, standard deviation.
a)Analysis of covariance test.
staging system (Table 1).
Immunophenotypic characterization of cancer- related peripheral blood immune cells
WBCs, neutrophils, and lymphocyte subtypes
Peripheral blood immune cells of patients were analyzed and described in percentages and counts relative to those of healthy controls (Table 2). Because of age and sex differences between the 2 groups, age- and sex-adjusted mean values were compared. We found that there were significant differences in several immune cell subtypes between patients and healthy controls. Absolute counts of white blood cells (WBCs) and percentages and counts of neutrophils were higher in patients than in healthy controls (P < 0.005). In contrast, percentages of lymphocytes were lower in patients than in healthy controls (P
= 0.005). Thus, the neutrophil-to-lymphocyte ratio (NLR) was increased in patients (P < 0.001). CD3+, CD3+CD8+, and CD4+ T cell subtypes were also examined. Percentages and counts of CD3+ and CD3+CD8+ T cells were not significantly different between patients and healthy controls (P > 0.05). However, percentages of CD4+ T cells were higher in patients than in healthy controls (P = 0.002).
NKG2D and KIR2DL3 expression on NK cells
NK cells play key roles in innate immunity. We examined NK cells and their activation (CD314) and inhibition (CD158b) signaling molecules. Percentages and counts of NK cells were not different between patients and healthy controls (P > 0.05).
Similarly, CD314+ NK cells and CD158b+ NK cells were not statistically different (data not shown). Instead, we observed that percentages of CD314+CD158b– NK cells were lower in patients than in healthy controls (P = 0.047), whereas percentages of CD314–CD158b+ NK cells were higher in patients than in healthy controls (P < 0.001).
PD-1 and CLLA-4 expression on Tregs and CTLs
Tregs are major immune suppressive cells in cancer progres- sion, whereas CTLs are the primary antitumor effector cells.
Percentages of CD4+CD25+ Tregs (P = 0.029) and percentages and counts of CD4+CD279+ and CD4+CD152+ cells were signifi- cantly higher in patients than in healthy controls (P < 0.001).
Likewise, percentages and counts of CD152+CD3+CD8+ and CD279+CD3+CD8+ cells were significantly higher in patients than in healthy controls (P < 0.005). However, CD8+CD152 and CD8+CD279+ cells were not different between patients and healthy controls (data not shown).
Th1/Th2 balance
An abnormal Th1/Th2 balance is associated with cancer, and the Th1/Th2 ratio has been used in in vitro assays of quantifying cytokines such as IFN-γ and IL4 after cell stim ula tion. However,
we analyzed the ex vivo state of the Th1/Th2 balance using surface chemokine receptors CD183, CD194, and CD196, as described in a previous report [7]. Percentages of Th1 cells were lower in patients than in healthy controls (P = 0.001). In contrast, percentages of Th2 cells were higher in patients than in healthy controls (P = 0.006). Consequently, the Th1/Th2 ratio was significantly decreased in patients (P < 0.001). However, there was no difference in Th17 cells between patients and healthy controls (P > 0.05).
Circulating MDSCs
Lineage-negative (CD3–/CD19–/56–) HLA–DR–CD11b+CD33+ MDSCs are immune suppressive cells that function similar to Tregs. Thus, these peripheral cells were also analyzed. Signifi- cantly high counts of MDSCs were observed in patients com- pared to healthy controls (P = 0.010). Likewise, the percentages of MDSCs seemed higher in patients than in healthy controls, although this difference was not statistically significant (P = 0.232).
ICPs TIM-3, LAG-3, and BTLA
In our pilot study, we observed that CD223 was rarely ex- pressed on lymphocyte surfaces, whereas CD366 and CD272 were detected on the cell surfaces. Furthermore, we found that all three molecules were stably expressed in lymphocytes, which led us to analyze their intracellular levels. Thus, we examined these molecules in both CD3+ T cells and CD3– cells. CD366 expression was not different between patients and healthy controls (P > 0.05). However, the percentages and counts of CD3+CD272+ and CD3+CD223+ T cells were significantly higher in patients than in healthy controls (P < 0.02), whereas those of CD3–CD272+ and CD3–CD223+ cells were not different between patients and healthy controls (P > 0.05).
Blood immune cells and cancer stage
Next, we wondered whether blood immune cells are altered as cancer progresses. To examine this, we classified patients into two early stage (I and II) and late stage (III and IV) groups.
The percentages of lymphocytes and neutrophils were markedly decreased and increased, respectively, as with advance cancer stages (P < 0.05), and the NLR was increased in the late stage group compared to early stage group (P < 0.05). The percentages of Th2 cells were also significantly higher in the late stage group (P = 0.029) (Table 3). Similarly, we found distant metastasis altered immune cells (Table 4). Counts of WBCs, neutrophils, CD279+CD3+CD8+ CTLs, and CD3+CD223+ cells were significantly higher in the M1 group than in the M0 group (P = 0.01). The percentages of CD3+CD366+ and CD3+CD223+ cells were also significantly higher in the metastasis group than in the non-metastasis group (P < 0.05).
Binary logistic regression analysis for cancer diagnosis
We then examined whether cancer-related changes in blood immune cell compartments would be useful in cancer diag- nosis. Because cancer prediction with a single factor is unlikely, we examined reliable algorithms that could reflect cancer- related immune dynamics, and a well-designed binary logistic regression model was used for this analysis. According to the initiation date of our study, the total data set was divided into
a training data set that included a retrospective cohort (62 patients and 100 healthy co ntrols) to establish the model and validate the data set for use with the prospective cohort (69 patients and 74 healthy controls) to confirm the model. Various forward stepwise logistic regression models were obtained. The area under the curve (AUC) of the ROC curve, sensitivity, and specificity were then calculated. Among the models, we found the best fit, and the following diagnostic equations were used:
First model: Logit(p) = –17.461 + 0.039X(CD3+ %) + 0.141X(NK %)
Table 3. Blood immune cells and cancer stage
Parameter Healthy controls Stage group
Pvalue I/II (n = 50) III/IV (n = 58)
Lymphocytes (%) 35.43 ± 8.51 31.85 ± 10.56 27.17 ± 10.13 0.021
Neutrophils (%) 54.41 ± 9.91 58.65 ± 12.16 63.50 ± 11.17 0.033
Neutrophils/lymphocytes 1.72 ± 0.88 2.21 ± 2.29 2.99 ± 2.27 0.035
Th2 (%) 13.36 ± 3.57 15.36 ± 4.89 17.50 ± 5.11 0.029
Values are presented as mean ± standard deviation.
Table 4. Blood immune cells and distant metastasis
Parameter Healthy controls Distant metastasis
Pvalue M0 (n = 97) M1 (n = 11)
White blood cells (/μL) 5,973 ± 1,565 6,848 ± 2,023 9,073 ± 3,746 0.003
Neutrophils (cells/μL) 3,311 ± 1,275 4,248 ± 1,902 6,341 ± 3,965 0.006
CD279+CD3+CD8+ (cells/μL) 122 ± 88 132 ± 64 200 ± 98 0.008
CD3+CD366+ (%) 5.78 ± 2.67 6.37 ± 3.30 9.14 ± 4.65 0.027
CD3+CD223+ (%) 4.29 ± 2.46 6.62 ± 4.78 9.22 ± 4.40 0.024
CD3+CD223+ (cells/μL) 90 ± 65 125 ± 109 185 ± 86 0.015
Values are presented as mean ± standard deviation.
Sensitivity
A B
1.0 1 - Specificity
0 1.0
0.8
0.6
0.4
0.2
Retrospective Prospective cohort AUC = 0.84
cohort AUC = 0.96
0.2 0.4 0.6 0.8
Sensitivity
1.0 1 - Specificity
0 1.0
0.8
0.6
0.4
0.2
Retrospective Prospective cohort AUC = 0.94
cohort AUC = 0.98
0.2 0.4 0.6 0.8
Fig. 1. Receiver operating curve analysis of cancer prediction using a binary logistic regression model. Retrospective (62 pa
tients and 100 healthy controls) and prospective (69 patients and 74 healthy controls) diagnostic values are presented as the area under the curve (AUC), sensitivity, and specificity. (A) Logit model including 11 variables: CD3+%, NK %, CD4+CD279+%, CD4+CD25+%, CD4+CD152+%, CD3+CD366+%, CD3+CD272+%, CD3+CD223+%, CD158b–CD314+CD3–CD56+%, Th2%, and MDSCs cells/μL. (B) Modified logit model including 12 variables (age plus the original 11 variables).
+ 0.320X(CD4+CD279+ %) + 0.196X(CD4+CD25+ %) – 0.105X(CD4+CD152+ %) + 0.157X(CD3+CD366+ %) + 0.243X(CD3+CD272+ %) + 0.006X(CD3+CD223+ %) + 0.350X(CD158b+CD314–CD3–CD56+ %) + 0.143X(Th2 %) + 0.001X(MDSCs cells/μL)
The ROC curve analysis showed that the AUC of the training data set was 0.960 and the sensitivity and specificity were 88.50% and 87.50%, respectively, with a cutoff value of 0.365, whereas the AUC of the validation data set was 0.840 and the sensitivity and specificity were 76.74% and 78.13%, respectively (Fig. 1A). Next, age was added to the 11 variables to obtain the modified equation below:
Modified model: Logit (p) = –20.323 + 0.164X(Age) – 0.012X(CD3+ %)
+ 0.046X(NK %) + 0.536X(CD4+CD279+ %) + 0.051X(CD4+CD25+ %) – 0.165X(CD4+CD152+ %) + 0.015X(CD3+CD366+ %) + 0.152X(CD3+CD272+%) + 0.215X(CD3+CD223+ %) + 0.342X(CD158b+CD314–CD3–CD56+% ) + 0.141X(Th2 %) + 0.001X(MDSCs cells/μL)
The AUC of the ROC curve, sensitivity, and specificity of the training data set and validation data set were 0.980 vs. 0.940, 91.53% vs. 85.80%, and 93.50% vs. 86.20%, respectively (Fig. 1B).
DISCUSSION
Dynamic cross-talk between various types of immune cells and secretory molecules such as cytokines and chemokines, immunoglobulins, and complement constitutes the immune network [8]. Thus, immunity is not the effect of single cells or molecules but a net effect resulting from the several com- partments of the whole immune system [6,9]. The peri pheral blood stream as opposed to the central lymphoid organs allows systemic immunity to react rapidly to exogenous and endogenous dangers that are able to breach the host in a physiologically steady state [10]. As a result, the peripheral im- mune system is sensitive and changes constantly. Circadian change in WBCs and different immune profiles depending on sex, age, and even the lifestyle are examples of this pheno- menon.
Immune changes are believed to be associated with cancer progression [11,12]. Growing evidence from animal experiments supports this idea, although the process and mechanisms of cancer immunity are not still clearly understood [13]. In fact, reports on basic and clinical studies indicate that immunity in most cancer patients is defective compared to that in healthy controls [14,15]. It is well known, for example, that Tregs [16], MDSCs [17], and tumor-associated macrophages [18] play an adverse role in anti-tumor immunity, Th2 cell dominance over Th1 cells is favorable for tumorigenesis [19], and the frequency of infiltrating tumor lymphocytes affects patient survival [20].
These observations suggest that restoring the immune balance would be beneficial for cancer treatment and therapy [21].
Therefore, cancer immunotherapy might offer promising treat ment modalities, and many different types of immuno- therapy have been applied to patients, depending on the
supposed path to anti-tumor immunity [22,23]. Among them are successful therapies targeting ICPs—crucial molecules that func tion as receptors and ligands in cell signaling pathways related to antitumor immunity [24,25]. The main strategy of the therapy is to block abnormally expressed inhibitory signaling molecules using specific antibody to restore antitumor immunity. For instance, programed death 1 (PD-1) and cytotoxic T lymphocyte antigen 4 (CTLA-4) are the most well- known target molecules associated with cytotoxic activity of effector T cells against cancer cells, and therapeutic antibodies targeting PD-1 and CTLA-4 signaling pathway components have been used clinically with U.S. Food and Drug Administration approval [26]. In addition, other signaling checkpoint molecules such as T-cell immunoglobulin and mucin-domain containing-3 (TIM-3), Lymphocyte-activation gene 3 (LAG3), B-and T-lymphocyte attenuator (BTLA), T cell immunoreceptor with Ig and ITIM domains (TIGIT), and V-domain Ig suppressor of T cell activation (VISTA) have been scrutinized for clinical application [27]. Therefore, suppressive immune cells and ICP molecules could be valuable indicators for diagnosis and treatment of cancer [28].
Based on these promising studies, we considered immuno- diag nostics for cancer feasible and attempted to identify indica- tors that could be detected in the peripheral blood. Specifically, we investigated major blood immune cells and checkpoint molecules in the peripheral blood using flow cytometry and an automatic hematology analyzer. We observed that WBCs, Tregs, MDSCs, and the NLR were increased, but that Th1/
Th2 decreased in the blood stream of cancer patients. These findings indicate that immune cells unfavorable in antitumor immunity also reside in the peripheral blood, as they do in tumor microenvironments [3,5,12].
Then, we were interested in whether ICP molecules that had mostly been reported in tumor microenvironments were also highly expressed in the peripheral blood immune com- part ment of cancer patients. KIR2DL3 and NKG2D on NK cells, and PD-1, CTLA-4, TIM-3, LAG-3, and BTLA on T cells were examined. We found that CD314 and CD158b on NK cells were only significantly elevated in CD314+CD158b–CD3–CD56+ and CD314–CD158b+CD3–CD56+ cells, but not in CD314+CD3– CD56+ and CD158b+CD3–CD56+ cells. Likewise, PD-1 was constitutively expressed on T cells subsets. However, the most significant difference between patients and controls was detected in CD4+CD279+ and CD3+CD8+CD279+ cells compared to CD4+CD25+CD279+ or CD3+CD279+ cells. In contrast, CTLA- 4 and LAG-3 was hardly expressed on cell surfaces, but we found they were stably expressed intracellularly, with the most statistical significant difference in intracellular CTLA-4 levels found in CD4+CD152+ and CD3+CD8+CD152+ cells compared to CD4+CD25+CD152+ or CD3+CD152+ cells. In addition, surface- rare LAG-3 and surface-bound BTLA were only significant
when they were examined intracellularly in CD3–CD223+ and CD3–CD272+ cells. These observations all show that the gating strategy and analytical technique are critical in identifying meaningful checkpoint molecules for the immunodiagnostics of cancer.
Finally, our main concern was to determine the likelihood of devising reliable immunodiagnostics for cancer that would show both sensitivity and specificity over 80% in accordance with the general recommendations for clinical diagnostic tests [29,30]. For this, we used a binary logistic regression analysis model comprising various combinations of blood immune cells as variables in logit equations. We found a best logit function that included 11 variables, with acceptable retrospective AUC, sensitivity, and specificity; however, the results of prospective validation were unacceptable. Next, we made a logit model that included the best 11 variables plus one more variable, age, on the supposition that age affected blood immune cells, and the result of retrospective and prospective estimation of sensitivity and specificity for predicting cancer were both acceptable at greater than 80%. This finding supports our idea that peripheral blood immunity is very valuable and the more significant peripheral indicators we can find, the better and more reliable immunodiagnostics for cancer that could be developed for use in clinics.
In conclusion, this study is a pilot test that has several
limitations: above all, the sample size was small, and age- and sex-mismatched healthy controls were used in developing logistic regression algorithm without enough test and conclu- sion of whether or not these two factors would influence an ex pression of certain markers on immune cells. This might be shortcomings because some research articles have covered age- and sex-related changes in lymphocyte subpopulations, although we did not find a statistical difference between the healthy male and female groups in all 11 parameters used in our logistic regression model. Methodologically, the double platform method was performed using a hematology analyzer and flow cytometer based on simultaneous four-color detection of target antigens. Furthermore, whether the patterns of peripheral blood cancer immunity in CRC are analogous to those of other types of cancer should be investigated. Despite these limitations, we believe that our results would appeal to the broad readership interested in cancer diagnosis and treatment, and suggest that research of peripheral blood immune system should be exten- sively conducted to develop reliable immunodiagnostics for cancer prediction and treatment.
CONFLICTS OF INTEREST
No potential conflict of interest relevant to this article was reported.
REFERENCES
1. Siegel R, Desantis C, Jemal A. Colorectal cancer statistics, 2014. CA Cancer J Clin 2014;64:104-17.
2. Crowley E, Di Nicolantonio F, Loupakis F, Bardelli A. Liquid biopsy: monitoring can cer-genetics in the blood. Nat Rev Clin Oncol 2013;10:472-84.
3. Wargo JA, Reddy SM, Reuben A, Sharma P. Monitoring immune responses in the tu mor microenvironment. Curr Opin Immunol 2016;41:23-31.
4. Gutkin DW, Shurin MR. Clinical evalu- a tion of systemic and local immune re- sponses in cancer: time for integration.
Can cer Immunol Immunother 2014;63:45- 57.
5. Stroncek DF, Butterfield LH, Cannarile MA, Dhodapkar MV, Greten TF, Grivel JC, et al. Systematic evaluation of immune regulation and modulation. J Immunother
Cancer 2017;5:21.
6. de Visser KE, Eichten A, Coussens LM.
Para doxical roles of the immune system dur ing cancer development. Nat Rev Cancer 2006;6:24-37.
7. Gosselin A, Monteiro P, Chomont N, Diaz-Griffero F, Said EA, Fonseca S, et al. Peripheral blood CCR4+CCR6+ and CXCR3+CCR6+CD4+ T cells are highly per mi ssive to HIV-1 infection. J Immunol 2010;184:1604-16.
8. Chaplin DD. Overview of the immune re- sponse. J Allergy Clin Immunol 2010;125(2 Suppl 2):S3-23.
9. Kim JC, Choi J, Lee SJ, Lee YA, Jeon YM, Kang YW, et al. Evaluation of cytolytic acti- vity and phenotypic changes of cir culating blood immune cells in pa tients with colorectal cancer by a simple preparation of peripheral blood mono nu clear cells. J
Korean Surg Soc 2013;85:230-5.
10. Kroemer G, Cuende E, Martinez C. Com- part mentalization of the peripheral im- mune system. Adv Immunol 1993;53:157- 216.
11. Pandya PH, Murray ME, Pollok KE, Renbarger JL. The immune system in cancer pathogenesis: potential therapeutic approaches. J Immunol Res 2016;2016:
4273943.
12. Finn OJ. Cancer immunology. N Engl J Med 2008;358:2704-15.
13. Swann JB, Smyth MJ. Immune sur veil- lance of tumors. J Clin Invest 2007;117:
1137-46.
14. Santegoets SJ, Welters MJ, van der Burg SH. Monitoring of the Immune Dys func- tion in Cancer Patients. Vaccines (Basel) 2016;4:1-23.
15. Kamigaki T, Ibe H, Okada S, Matsuda E,
Tanaka M, Oguma E, et al. Improvement of impaired immunological status of patients with various types of advanced cancers by autologous immune cell therapy. Anticancer Res 2015;35:4535-43.
16. Nishikawa H, Sakaguchi S. Regulatory T cells in tumor immunity. Int J Cancer 2010;127:759-67.
17. Parker KH, Beury DW, Ostrand-Rosenberg S. Myeloid-derived suppressor cells:
critical cells driving immune suppression in the tumor microenvironment. Adv Cancer Res 2015;128:95-139.
18. Ostuni R, Kratochvill F, Murray PJ, Natoli G. Macrophages and cancer: from mechanisms to therapeutic implications.
Trends Immunol 2015;36:229-39.
19. Shurin MR, Lu L, Kalinski P, Stewart- Akers AM, Lotze MT. Th1/Th2 balance in can cer, transplantation and pregnancy.
Springer Semin Immunopathol 1999;21:
339-59.
20. Galon J, Pages F, Marincola FM, Angell
HK, Thurin M, Lugli A, et al. Cancer classification using the Immunoscore: a worldwide task force. J Transl Med 2012;
10:205.
21. Apetoh L, Vegran F, Ladoire S, Ghiringhelli F. Restoration of antitumor immunity through selective inhibition of myeloid derived suppressor cells by anticancer therapies. Curr Mol Med 2011;11:365-72.
22. Lesterhuis WJ, Haanen JB, Punt CJ. Cancer immunotherapy--revisited. Nat Rev Drug Discov 2011;10:591-600.
23. Mellman I, Coukos G, Dranoff G. Cancer im muno therapy comes of age. Nature 2011;480:480-9.
24. Sharma P, Allison JP. Immune checkpoint targeting in cancer therapy: toward com- bi nation strategies with curative poten- tial. Cell 2015;161:205-14.
25. Swart M, Verbrugge I, Beltman JB. Com- bi nation approaches with immune- checkpoint blockade in cancer therapy.
Front Oncol 2016;6:233.
26. Postow MA, Callahan MK, Wolchok JD.
Immune Checkpoint Blockade in Cancer Therapy. J Clin Oncol 2015;33:1974-82.
27. Mahoney KM, Rennert PD, Freeman GJ.
Com bi nation cancer immunotherapy and new immunomodulatory targets. Nat Rev Drug Discov 2015;14:561-84.
28. Topalian SL, Taube JM, Anders RA, Pardoll DM. Mechanism-driven biomarkers to guide immune checkpoint blockade in cancer therapy. Nat Rev Cancer 2016;16:
275-87.
29. Plante E, Vance R. Selection of preschool language tests: a data-based approach.
Lang Speech Hear Serv Sch 1994;25:15-24.
30. Shahmahmood TM, Jalaie S, Soleymani Z, Haresabadi F, Nemati P. A systematic re- view on diagnostic procedures for specific lan guage impairment: the sensitivity and specificity issues. J Res Med Sci 2016;21:
67.