ISSN 2234-3806 • eISSN 2234-3814
https://doi.org/10.3343/alm.2017.37.2.137
Comparison Between Soluble ST2 and High-Sensitivity Troponin I in Predicting Short-Term Mortality for
Patients Presenting to the Emergency Department With Chest Pain
Rossella Marino, M.D.1, Laura Magrini, M.D.1, Francesca Orsini, M.D.1, Veronica Russo, M.D.1, Patrizia Cardelli, Ph.D.2, Gerardo Salerno, M.T.2, Mina Hur, M.D.3, and Salvatore Di Somma, M.D.1, on behalf of the GREAT NETWORK
Department of Medical-Surgery Sciences and Translational Medicine1, University Sapienza Rome, Sant’ Andrea Hospital, Rome, Italy; Clinical and Molecular Medicine Department2, Sant’ Andrea Hospital, School of Medicine and Psychology, “Sapienza” University, Rome, Italy; Department of Laboratory Medicine3, School of Medicine, Konkuk University, Seoul, Korea
Background: High-sensitivity cardiac troponin I (hs-cTnI) and the soluble isoform of sup- pression of tumorigenicity 2 (sST2) are useful prognostic biomarkers in acute coronary syndrome (ACS). The aim of this study was to test the short term prognostic value of sST2 compared with hs-cTnI in patients with chest pain.
Methods: Assays for hs-cTnI and sST2 were performed in 157 patients admitted to the Emergency Department (ED) for chest pain at arrival. In-hospital and 30-day follow-up mortalities were assessed.
Results: The incidence of ACS was 37%; 33 patients were diagnosed with ST elevation myocardial infarction (STEMI), and 25 were diagnosed with non-ST elevation myocardial infarction (NSTEMI). Compared with the no acute coronary syndrome (NO ACS) group, the median level of hs-cTnI was higher in ACS patients: 7.22 (5.24-14) pg/mL vs 68 (15.33 -163.50) pg/mL (P <0.0001). In all patients, the sST2 level at arrival showed higher inde- pendent predictive power than hs-cTnI (odds ratio [OR] 20.13, P <0.0001 and OR 2.61, P <0.0008, respectively). sST2 at ED arrival showed a greater prognostic value for cardio- vascular events in STEMI (area under the curve [AUC] 0.80, P <0.001) than NSTEMI pa- tients (AUC 0.72, P <0.05). Overall, 51% of the STEMI patients with an sST2 value>35 ng/mL at ED arrival died during the 30-day follow-up.
Conclusions: sST2 has a greater prognostic value for 30-day cardiac mortality after dis- charge in patients presenting to the ED for chest pain compared with hs-cTnI. In STEMI patients, an sST2 value >35 ng/mL at ED arrival showed the highest predictive power for short-term mortality.
Key Words: Emergency Department, Chest pain, Acute coronary syndrome, hs-cTnI, sST2, 30 day mortality, Prognosis
Received: July 19, 2016
Revision received: September 21, 2016 Accepted: December 5, 2016
Corresponding author: Salvatore Di Somma Department of Medical-Surgery Sciences and Translational Medicine, University Sapienza Rome, Sant’ Andrea Hospital, Grottarossa Street 1035/1039, Rome 00189, Italy
Tel: +0633775592
E-mail: [email protected]
© Korean Society for Laboratory Medicine This is an Open Access article distributed under the terms of the Creative Commons Attribution Non-Commercial License (http://creativecom- mons.org/licenses/by-nc/4.0) which permits unrestricted non-commercial use, distribution, and reproduction in any medium, provided the original work is properly cited.
INTRODUCTION
The majority of patients with acute coronary syndrome (ACS) present to the emergency department (ED) because of chest
pain [1], and both prompt diagnosis and risk stratification are crucial to start an appropriate treatment [2]. Therefore, applica- tion of current guidelines [1, 3, 4] with the use of high-sensitivity cardiac troponin I (hs-cTnI) measurement helps to expedite the
ACS distribution of myocardial infarction and rule out differential distribution [5-7]. hs-cTnI assays represent an important advance with added sensitivity for cardiac myocyte necrosis [8, 9].
Along with its diagnostic role for risk stratification in acute car- diac conditions, hs-cTnI can provide prognostic information on stable disease states. In addition, accurate risk stratification for the possible development of in-hospital death or other severe life-threatening complications is desirable. High-sensitivity Tro- ponins assays can detect minute levels of myocyte necrosis [10]. Moreover, there are several proposed mechanisms of tro- ponin release that are not related to necrosis, including apopto- sis, cellular release of proteolytic products, increased cell wall permeability with stress or stretch, and the production of mem- branous blebs that contain troponin [11]. Although the conven- tional sensitivity assays are specific for myocyte necrosis, hs-cTnI assays also show high specificity. Furthermore, there is a consid- erable amount of evidence to indicate that increasing values of hs-cTnI (and perhaps changes in values over time) correlate with the risk of adverse cardiac events [12, 13]. There is an in- ternational consensus on the role of elevated troponins as pre- dictors of adverse outcomes in patients with ACS during short- and long-term follow-ups [14]. One study showed that troponin measured with a high-sensitivity assay was a more robust pre- dictor of cardiovascular death at 1-yr follow-up in patients pre- senting to the ED with chest pain compared with the conven- tional troponin assay [15].
Furthermore, the soluble isoform of suppression of tumorige- nicity 2 (sST2) has been proposed as a prognostic marker of mortality in patients with ACS [16-23]. Circulating sST2 levels appear to be linked to the presence of adverse cardiac remodel- ing due to tissue fibrosis overproduction in response to ACS [17, 18]. Indeed, sST2 elicits a cardio-protective response to cardiac disease or injury such as an acute cardiac ischemic event [19, 20]. The loss of a correct transduction of interleukin (IL)-33/ST2L signaling leads to uncontrolled cardiac remodeling accompanied by hypertrophy of the myocytes and fibrosis with worsening of left ventricular function [24]. As a result, the heart is subjected to greater stress in the presence of high levels of sST2; thus, high levels of sST2 are associated with an increased risk of mortality in patients with myocardial infarction [18, 21-23]. The predic- tive role of sST2 for risk of death in ACS differs between patients diagnosed with non-ST elevation myocardial infarction (NSTEMI) and ST elevation myocardial infarction (STEMI) and between assessments of short-term (30-day) and long-term (>1 yr) fol- low ups [16-18, 25]. However, there are no data available on the value of sST2 compared with hs-cTnI measurements on ED
admission for the prediction of early cardiovascular-related death.
Therefore, the aims of this study were first to evaluate the prog- nostic roles of circulating levels of sST2 and hs-cTnI for the 30- day mortality in patients presenting to the ED with chest pain, and then to compare the prognostic role of sST2 and hs-cTnI in the STEMI and NSTEMI patient subgroups. In addition, the pro- posed sST2 cut-off point of >35 ng/mL as a prognostic risk fac- tor in heart failure [26] was evaluated. Overall, this study should help to best identify ACS patients with a high risk of short-term cardiovascular-related death.
METHODS
This was a prospective observational study performed in the ED of Sant’Andrea Hospital in Rome, Italy, from January 2012 to January 2013. The study was approved by Ethical Committee of Sant’Andrea Hospital. A total of 157 (110 men/47 women) pa- tients presenting to the ED for chest pain were enrolled. Ten pa- tients were lost to follow-up (they did not answer the phone call;
three were NSTEMI patients and seven were NO ACS patients).
Overall, the incidence of ACS was 37% (58 patients). In the ACS group, 57% (33 patients) had STEMI and 43% (25 patients) had NSTEMI. During the 30-day follow-up, of the 147 patients, 30 (20%) died (23 ACS, 7 NO ACS), and 117 (80%) were still alive. In the STEMI and NSTEMI groups, 12 and 11 patients had cardiovascular-related deaths at 30 days, respectively.
Patients’ characteristics are described in Table 1.The inclu- sion criteria were: chest pain at rest, chest pain with effort, and atypical chest pain with a cardiovascular risk. The exclusion cri- teria were: chest pain due to trauma, chest pain associated with osteomuscular movements, and burning chest pain without car- diovascular risk. Each patient meeting the inclusion criteria was assigned a yellow code at admission. The mean time of presen- tation to the ED from the start of symptoms was 2 hr. The mean time elapsed after the assignment of the yellow code to the tri- age work station was 5 min. The following parameters were ex- amined and recorded for each patient at admission in the ED:
anamnestic data, physical examination, evaluation of vital pa- rameters, venous blood sample for routine laboratory exams (in- cluding hs-cTnI at admission and at 2 hr after admission), and for detection of copeptin, sST2, neutrophil gelatinase-associated lipocalin (NGAL), and brain natriuretic peptide (BNP), chest X- rays. Electrocardiogram (EKG) was performed within 10 min af- ter ED arrival. The management of patients with chest pain was performed according to the European Society of cardiology (ESC) guidelines for the management of ACS and chest pain,
and any significant treatment modality between favorable and unfavorable groups was performed according to these guide- lines [1, 3, 4, 27]. A 30-day follow-up phone call was made with the aim of recording any adverse cardiovascular-related events (death) that occurred after discharge. On the basis of the final diagnosis, patients were subdivided into two groups: ACS and NO ACS groups. ACS patients were further subdivided into pa- tients diagnosed with STEMI and those diagnosed with NSTEMI.
The in-hospital management of ACS was performed according to current guidelines [1, 3, 4].
1. sST2 assay
A peripheral venous blood sample was taken from each patient, which was collected in heparinized tubes and spun for 15 min at 3,500g with cooling during centrifugation. Samples were sep- arated into 500-μL aliquots and immediately frozen at -40°C until the assay was performed. The sST2 assay (Presage ST2 Assay, Critical Diagnostics, San Diego, CA, USA) is a quantita- tive sandwich monoclonal ELISA [28]. Diluted plasma (diluted 50-fold with the sample diluent) was loaded into appropriate wells in an anti-ST2 antibody-coated plate and incubated for the
prescribed time. Following a series of steps in which the reagents were washed from the plate, and additional reagents were added and subsequently washed out, the analyte was finally detected by the addition of a colorimetric reagent, and the resulting signal was measured spectroscopically at 450 nm. According to the manufacturer instructions, the 99th percentile of the cut-off is 18.8 (14.5-25.3) ng/mL. The coefficient of variation (CV) of the assay is about 5% [28].
2. hs-cTnI assay
Peripheral venous blood samples were withdrawn from each patient, and the 10-mL blood samples in heparinized tubes were sent to our central hospital laboratory for measurement of hs- cTnI, which is a routine screening diagnostic test performed in real time at our ED for suspected cases of ACS. The ARCHITECT STAT High Sensitive Troponin I assay (Abbott Laboratories, Ab- bott Park, IL, USA) is a chemiluminescent microparticle immu- noassay for the in vitro quantitative determination of cardiac tro- ponin I, and can be used with the Abbott ARCHITECT i2000SR and i1000SR analyzers [29]. Results are available within 16 min.
The ARCHITECT STAT High Sensitive Troponin I assay kit can Table 1. Patient characteristics
Total population (N=157) NSTEMI (N=25) STEMI (N=33) NO ACS (N=99)
Age (yr, mean±SD) 61.8±14.7 66.2±15.9 66.1±12.5 59.2±14.6
Gender (N, men/women) 110/47 18/7 26/7 66/33
BMI (kg/m2, mean±SD) 26.3±3.5 25.9±3.5 27±3.8 26.2±3.4
hs-cTnI (pg/mL, median [IQR]) 12.66 (6.25–44.09) 76.8* (16.35–150) 68† (14.94–279.05) 7.22*,† (5.24–14) sST2 ng/mL median (IQR) 28.20 (19–41.97) 33.70‡ (23.77–83.32) 25.30 (11.80–79.57) 26.90‡ (20.05–36.65)
History of cardiovascular event (N)
Hypertension 76 14 14 48
Diabetes 44 7 13 24
Smoker 75 11 16 48
Family history 64 6 16 42
TIMI SCORE (mean±SD) 5±1.75 4±2 4 ±1.44 2 ±1.29
Home therapy (N)
Antiplatelets 39 100 98 20
Nitroderivates 25 65 72 15
Oral antidiabetics 28 7 12 30
Beta blockers 31 22 11 40
Insulin 23 54 31 8
Statins 32 60 51 14
*P <0.0001; †P <0.0001; ‡P <0.04.
Abbreviations: NSTEMI, non ST segment elevation myocardial infarction; STEMI, ST elevation myocardial infarction; ACS, acute coronary syndrome; NO ACS, no acute coronary syndrome; BMI, body mass index; sST2, soluble isoform of suppression of tumoregenicity 2; hs-cTnI, high sensitive cardiac troponin I;
TIMI score, thrombolysis in myocardial infarction score.
detect troponin I in 96% of the reference population, and has a recommended 99th percentile cut-off of 26.2 pg/mL. The man- ufacturer’s instructions also state a 99th percentile cut-off of 34.2 pg/mL for men and 15.6 pg/mL for women [30].
3. Statistical analysis
Continuous variables are expressed as mean ±SD or median (interquartile range [IQR]) according to whether the data followed a normal or non-normal distribution, respectively. Categorical variables are expressed as percentages (%). Statistical differ- ences between groups were compared by using the chi-square test for categorical variables and the Student t-test or U Mann-
Whitney test for continuous variables. Univariate and multivari- ate analysis were used to identify candidate variables for entry to a multivariable logistic regression model in order to select the variables most predictive of patient outcomes. We included the following variables of the patients’ baseline characteristics: body mass index (BMI), diabetes, family history of cardiovascular dis- eases, age, onset time before ED presentation, tobacco smok- ing, hypertension, thrombolysis in myocardial infarction (TIMI) score, log BNP, log copeptin, log NGAL, acute treatment, sST2, and hs-cTnI. Levels of sST2 and hs-cTnI were normalized by log transformation. Thus, the odds ratios (ORs) refer to a 10-fold increase in the levels of these markers. Receiver operating char-
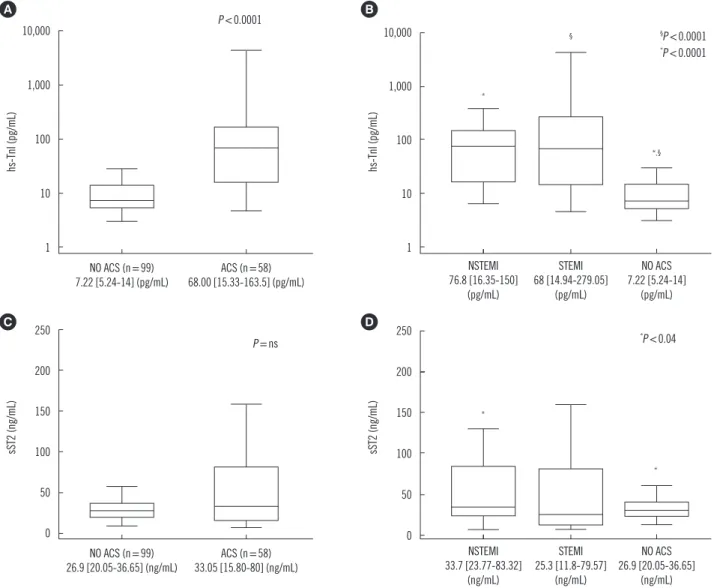
Fig. 1. Log hs-cTnI and sST2 median values in ACS and NO ACS patients and in STEMI, NSTEMI subgroups. (A) Log hs-cTnI value in NO ACS group vs ACS group, (B) Log hs-cTnI value in NSTEMI group vs STEMI group vs NO ACS, (C) Log sST2 value in NO ACS group vs ACS group, and (D) Log sST2 value in NSTEMI group vs STEMI group vs NO ACS. Bars represent the interquartile range, line in bars for median, and vertical lines represent the minimum and maximum value.
Abbreviations: ACS, acute coronary syndrome; NO ACS, no acute coronary syndrome; hs-cTnI, high sensitive cardiac troponin I; sST2, soluble isoform of an interleukin 1 receptor family member; NSTEMI, non ST segment elevation myocardial infarction; STEMI, ST elevation myocardial infarction.
10,000
1,000
100
10
1
NO ACS (n=99) 7.22 [5.24-14] (pg/mL)
ACS (n=58) 68.00 [15.33-163.5] (pg/mL)
hs-Tnl (pg/mL)
P <0.0001 A
10,000
1,000
100
10
1
NSTEMI 76.8 [16.35-150]
(pg/mL)
STEMI 68 [14.94-279.05]
(pg/mL)
NO ACS 7.22 [5.24-14]
(pg/mL)
hs-Tnl (pg/mL)
§P <0.0001
*P <0.0001
§
*,§
*
B
250 200 150 100 50
0
NO ACS (n=99)
26.9 [20.05-36.65] (ng/mL) ACS (n=58) 33.05 [15.80-80] (ng/mL)
sST2 (ng/mL)
P =ns
C 250
200 150 100 50
0
NSTEMI 33.7 [23.77-83.32]
(ng/mL)
STEMI 25.3 [11.8-79.57]
(ng/mL)
NO ACS 26.9 [20.05-36.65]
(ng/mL)
sST2 (ng/mL)
*P <0.04
*
*
D
acteristic(ROC) curves were plotted, and the area under the curve (AUC) was estimated to demonstrate the optimal cut-off points of sST2 and hs-cTnI levels for prognosis evaluation on the basis
of events and to establish appropriate sensitivity and specificity.
P values of<0.05 from two-sided tests were considered signifi- cant. All statistical analyses were performed by using Medcalc Table 2. Univariate and multivariate analyses in the total population and ACS patients only
Univariate
Total population OR 95% CI P Multivariate
Total population OR 95% CI P
BMI 1.11 1.00–1.24 0.04 Log sST2 4.40 0.72–26.70 0.10
Age 1.02 0.99–1.05 0.12 Log hs-cTnI 0.98 0.41–2.33 0.96
Hypertension 1.94 0.85–4.45 0.11 TIMI score 1.52 1.06–2.20 0.02
Tobacco smoking 0.83 0.37–1.86 0.65 BMI 1.08 0.92–1.27 0.32
Diabetes 1.15 0.74–4.12 0.19 Log BNP 1.48 0.64–3.43 0.35
Family History of cardiovascular diseases 1.25 0.56–2.81 0.57
Log sST2 20.13 4.85–83.47 <0.0001
Log hs-cTnI 2.61 1.49–4.59 0.0008
Log BNP 2.02 1.10–3.73 <0.02
Log Copeptin 1.08 0.38–3.05 0.88
Log NGAL 0.66 0.16–2.79 0.58
TIMI score 1.53 1.16–2.02 0.002
Onset time before ED visit 0.99 0.98–1.00 0.46
Beta blockers 0.74 0.21–2.59 0.63
Antiaggregants 1.43 0.63–3.21 0.38
Nitroderivates 1.69 0.45–6.22 0.42
Oxygen 2.57 0.74–8.88 0.13
LMWH 2.05 0.82–5.14 0.12
Morphine 3.25 0.41–25.60 0.26
ACS patients ACS patients
BMI 1.19 1.01–1.41 0.03 BMI 1.14 0.94–1.39 0.15
Age 1.03 0.99–1.07 0.08 Log sST2 12.10 2.31–63.25 0.003
Hypertension 2.41 0.79–7.28 0.11
Tobacco smoking 0.38 0.12–1.16 0.09
Diabetes 1.01 0.33–3.14 0.97
Family history of cardiovascular diseases 1.28 0.43–3.81 0.65
Log sST2 14.58 2.87–73.84 0.001
Log hs-cTnI 1.21 0.57–2.58 0.61
Log BNP 0.97 0.45–2.09 0.94
Log copeptin 1.19 0.37–3.84 0.76
Log NGAL 0.76 0.08–6.88 0.81
TIMI score 1.15 0.82–1.60 0.40
Onset time before ED visit 0.99 0.97–1.00 0.24
Beta blockers 0.81 0.17–3.77 0.79
Antiaggregants 1.09 0.37–3.18 0.87
Nitroderivates 1.02 0.21–4.97 0.97
Oxygen 1.22 0.26–5.66 0.79
LMWH 1.31 0.39–4.33 0.65
Morphine -- -- --
Abbreviations: OR, odds ratio; CI, confidence interval; BMI, body mass index; sST2, soluble isoform of suppression of tumoregenicity 2; hs-cTnI, high sensi- tive cardiac troponin I; BNP, brain type natriuretic peptide; NGAL, neutrophil gelatinase-associated lipocalin; TIMI, thrombolysis in myocardial infarction; ED, emergency department; LMWH, low molecular weight heparin; ACS, acute coronary syndrome.
version 12.1.4 software (Medcalc Software, Mariakerke, Belgium).
RESULTS
1. Distribution of the biomarkers
The median hs-cTnI [IQR] levels in the NO ACS and in the ACS groups are described in Fig. 1A. The median [IQR] hs-cTnI lev- eld in NSTEMI patients and in the STEMI patients are described in Fig. 1B. The median sST2 [IQR] values in the NO ACS and in the ACS patients are described in Fig. 1C. In the NSTEMI and STEMI groups, the median (IQR) sST2 levels are described in
Fig. 1D. There was no significant difference in sST2 levels be- tween the STEMI group and the NO ACS group (P =0.72). By contrast, there was a significant difference in sST2 levels between the NSTEMI group and NO ACS group (P <0.04) (Fig. 1D).
2. Prognostic results of the biomarkers
Considering the entire study population, of all clinical and de- mographic characteristics, sST2 (OR 20.13, 95% confidence interval [CI] 4.85-83.47, P <0.0001) and hs-cTnI (OR 2.61, 95%
CI 1.49-5.59, P =0.0008) independently predicted death at 30- day follow-up along with BMI (OR 1.11) and TIMI score (OR 1.53)
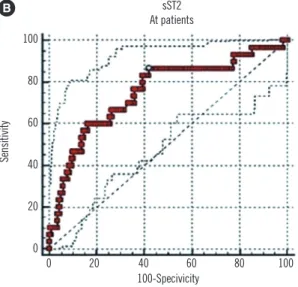
Fig. 2. hs-cTnI and sST2 ROC curve analyses. (A) hs-cTnI ROC curve for prognostic 30-day mortality in total patients; (B) sST2 ROC curve for prognostic 30-day mortality in total patients; (C) hs-cTnI+sST2 combined ROC curve for prognostic 30-day mor- tality in total patients. Red line represents the ROC curve, and grey lines represent the 95% confidence intervals.
Abbreviations: AUC, area under the curve; sST2, soluble isoform of suppression of tumoregenicity 2; hs-cTnI, high sensitive cardiac tropo- nin I; NPV, negative predictive value; PPV, positive predictive value.
100 80 60 40 20
0
0 20 40 60 80 100 100-Specivicity
AUC 0.71, P <0.0001, cut-off>23.02 pg/mL
Sensitivity 55% (95% CI 36-74) - Specificity 77.7% (95% CI 69-85) NPV 87.5%=PPV 38.1%
negative likelihood ratio 0.58-positive likelihood ratio 2.48
Sensitivity
hs-cTnl At patients A
100 80 60 40 20
0
0 20 40 60 80 100 100-Specivicity
AUC 0.75, P <0.0001, cut-off>27 ng/mL
Sensitivity 87% (95% CI 65-94) - Specificity 58% (95% CI 48-67) NPV 94%=PPV 35%
negative likelihood ratio 0.23-positive likelihood ratio 2.07
Sensitivity
sST2 At patients B
100
80 60
40 20
0
0 20 40 60 80 100 100-Specivicity
AUC 0.75, P <0.0001, cut-off>0.14 pg/mL
Sensitivity 86.2% (95% CI 68-96), specificity 58% (95% CI 48.6-67) NPV 94.4%, PPV 34%
negative likelihood ratio 0.24; positive likelihood ratio 2.06
Sensitivity
sST2+hs-cTnl C
in univariate analyses, and sST2 (OR 8.03, 95% CI 1.37-47.02, P =0.02) and TIMI score (OR 1.34, 95% CI 0.99-1.82, P =0.05) were the most predictive variables in the multivariate model (Ta- ble 2). Univariate and multivariate regression analyses in ACS patients showed the high independent predictive power of only sST2 (univariate: OR 14.58; multivariate: OR 12.10) for the risk of cardiovascular events (Table 2).
100 80 60 40 20
0
0 20 40 60 80 100 100-Specivicity
AUC 0.75, P =0.01, cut-off=150 (pg/mL)
Sensitivity 100% (95% CI 69.2-100) - Specificity 45% (95% CI 16.7-76.6) NPV 10% - PPV 62%
Negative likelihood ratio 0-positive likelihood ratio 1.83
Sensitivity
hs-cTnl (pg/mL) NSTEMI A
100 80 60 40 20
0
0 20 40 60 80 100 100-Specivicity
AUC 0.72, P <0.05, cut-off>25.4 (ng/mL)
Sensitivity 91% (95% CI 58.7-99.8) - Specificity 54% (95% CI 23.4-83.3) NPV 86% - PPV 67%
Negative likelihood ratio 0.17-positive likelihood ratio 2
Sensitivity
sST2 NSTEMI B
100 80 60 40 20
0
0 20 40 60 80 100 100-Specivicity
AUC 0.68, P =0.06, cut-off>90 (pg/mL)
Sensitivity 67% (95% CI 35-90) - Specificity 76% (95% CI 52.8-91.8) NPV 80% - PPV 65%
Negative likelihood ratio 0.44 - positive likelihood ratio 2.8
Sensitivity
hs-cTnl (pg/mL) STEMI C
100 80 60 40 20
0
0 20 40 60 80 100 100-Specivicity
AUC 0.80, P <0.001, cut-off>41.6 (ng/mL)
Sensitivity 83% (95% CI 51.6-97.9) - Specificity 81% (95% CI 58-94.6) NPV 90% - PPV 71.4%
Negative likelihood ratio 0.21-positive likelihood ratio 4.37
Sensitivity
sST2 STEMI D
Fig. 3. hs-cTnI and sST2 ROC curve analyses in NSTEMI and STEMI patients. (A) hs-cTnI ROC curve for prognostic 30-day mortality in NSTEMI patients; (B) sST2 ROC curve for prognostic 30-day mortality in NSTEMI patients; (C) hs-cTnI ROC curve for prognostic 30-day mortality in STEMI patients; (D) sST2 ROC curve for prognostic 30-day mortality in STEMI patients. Red line represents the ROC curve, and grey lines represent the 95% confidence intervals.
Abbreviations: AUC, area under the curve; sST2, soluble isoform of suppression of tumoregenicity 2; hs-cTnI, high sensitive cardiac troponin I; NPV, nega- tive predictive value; PPV, positive predictive value; NSTEMI, non ST segment elevation myocardial infarction, STEMI, ST elevation myocardial infarction.
3. ROC curve analysis for hs-cTnI and sST2
In the total population, the ROC curve for predicting the 30-day mortality with hs-cTnI and sST2 is described in Fig. 2A and B.
In the total population, the predicted probability from the binary logistic model combining the two markers yielded an AUC of 0.75 (95% CI 0.67-0.81, P <0.0001), which matched that of sST2 alone (Fig. 2C). Considering only the NSTEMI patients, the
hs-cTnI AUC for predicting the 30-day mortality was 0.75 (95%
CI 0.52-0.91, P =0.01) and the sST2 AUC was 0.72 (95% CI 0.49-0.89, P <0.05) (Fig. 3A, B). In the STEMI patients, the ROC curve AUC of hs-cTnI was 0.68 (95% CI 0.49-0.83, P =0.06) and that of sST2 was 0.80 (95% CI 0.62-0.92, P <0.001) (Fig.
3C, D).
4. hs-cTnI and sST2 in ACS patients
In ACS patients, the median (IQR) hs-cTnI level was 59.5 (17.5- 189) pg/mL in the no-events group and was 91.65 (16.35-150) pg/mL in the events group (P >0.05). The median (IQR) sST2 value was 19.92 (11.29-45.54) ng/mL in the no-events group and was 77.8 (38.18-104.62) ng/mL in the events group (P <
0.0005). Within the ACS patients, those in the STEMI group show ed a median (IQR) hs-cTnI level of 21 (10.32-81) pg/mL in the no- events group and 101.55 (35.80-1104) pg/mL in the events group (P <0.02). In the same group, the median (IQR) sST2 value was 18.7 (10.86-37.04) ng/mL in the no-events group and 80.86 (54.65-136.03) ng/mL in the events group (P <0.002).
In NSTEMI patients, the median (IQR) hs-cTnI level was 144 (35.98-240) pg/mL in the no-events group and was 76.8 (17.31 -105.7) pg/mL in the events group (P =0.13). In the same group, the median (IQR) sST2 value was 25.4 (12.58-72.35) ng/mL in the no-events group and was 69.8 (48.02-101.87) ng/mL in the events group (P <0.05).
5. Prognostic cut-off sST2 value in ACS patients
We considered the internationally recommended cut-off value of sST2 of 35 ng/mL, which is recognized as a prognostic factor in heart failure patients [26], and evaluated the events (i.e., deaths) on the basis of this cut-off. Among the STEMI patients in follow- up (n=33), 16 patients had an sST2 value>35 ng/mL, and nine of these patients died during the 30-day follow up. By contrast, 17 STEMI patients had an sST2 value<35 ng/mL, and only three of these patients died during follow up. In the univariate analy- sis, an sST2 value>35 ng/mL in STEMI patients showed highly significant predictive power for the risk of events, with an OR of 12.5 (95% CI 2.08-74.81, P =0.005). Among the NSTEMI pa- tients in follow-up (n=22), nine patients had an sST2 value >35 ng/mL and seven of these patients died during the 30-day fol- low-up. Among the 13 NSTEMI patients with an sST2 value<35 ng/mL, four patients died. In the univariate analysis, an sST2 value>35 ng/mL showed low and non-significant predictive power for cardiovascular-related deaths in NSTEMI, with an OR of 3.06 (95% CI 0.53-17.49, P =0.20).
DISCUSSION
In accordance with data from the literature, our study confirmed that in patients presenting to the ED with chest pain, sST2 has no significant distribution value for ACS [17, 23, 31]. This is con- sistent with the fact that elevations of sST2 are not specific for acute myocyte cell death, but rather reflect a non-specific in- flammatory response, as demonstrated in patients with asthma or autoimmune diseases [32]. Data from literature showed that BNP elevation in patients with ACS independently predicted the development of heart failure and all-cause mortality [33]. In our study, BNP was not predictive for ACS patients, although in the univariate analysis, BNP was predictive for cardiovascular events caused by the comorbidities presented in the study population.
Our data suggested that sST2 could be considered a powerful independent predictor for death within 30 days after admission, both in the total population presenting to the ED with chest pain and in ACS patients. The present results showed that in ED pa- tients with chest pain, sST2 and hs-cTnI were independent pa- rameters for predicting cardiovascular-related deaths at 30-day follow-up compared with the other parameters included in the univariate and multivariate analyses, such as BMI, diabetes, TIMI score, and family history of cardiovascular diseases (Table 2).
To our knowledge, this predictive value of sST2 in patients with chest pain in the ED has not been described to date. This role could be linked to its better ability to reflect global cardiac stress compared with hs-cTnI.
In ACS patients, the two biomarkers seem to be equally effec- tive in predicting cardiovascular-related deaths within 30 days af- ter ED admission. Both the univariate and multivariate analyses in this group of patients showed that the log sST2 value was the most powerful predictive biomarker, compared with the TIMI score and log hs-cTnI value. Previous studies demonstrated that in both STEMI and NSTEMI patients, the pre-discharge sST2 level could serve as an independent predictive marker for the long-term risk of cardiovascular events [15, 34, 35]. Moreover, our study demonstrated that the sST2 level at ED admission could be a good prognostic marker for 30-day mortality in both STEMI and NSTEMI patients (Fig. 3B-D). Recent studies showed con- trasting results on the prognostic role of sST2 in ACS patients [16, 18, 31, 34]. One study showed that sST2 level increased in pa- tients with ACS than in patients with stable coronary artery disease and without ACS, and that sST2 levels were associated with mor- tality in patients with STEMI but not in patients with NSTEMI or stable angina [36]. Cytokines from damaged tissues may activate neighboring cells to produce sST2. sST2 has also been shown to
regulate the expression of proinflammatory cytokines from mac- rophages, which may help prevent uncontrolled inflammatory re- actions in myocardial infarction and are a prerequisite for healing and scar formation [22]. sST2 may contribute to this process and could be responsible for myocardial fibrosis and cardiac remod- eling, which could affect prognosis after an episode of ACS [37].
To improve risk stratification of a patient with ACS in the ED, it is important to establish a standardized cut-off value of sST2.
Some studies showed that heart failure patients with sST2 levels above a clinical threshold of >35 ng/mL have a much higher risk of mortality [26]. A recent study showed that NSTEMI pa- tients are at a higher risk of adverse outcomes at 30 days when sST2 levels are above the cut-off value of 35 ng/mL [17]. Our study confirmed this finding; in fact, the sST2 cut-off value of 35 ng/mL could distinguish the high number of patients that died within 30 days from those who were alive (no events) in both STEMI (OR 12.5) and NSTEMI (OR 3.06) patients. In the ED, establishment of a reliable cut-off value to identify a patient that is likely to suffer from a major cardiovascular event (i.e., death) in the short term after an episode of ACS is of fundamental rele- vance to initiate the correct form of prevention and avoid adverse outcomes. Therefore, the aim of a physician should be not only stabilization of the patient but also achievement of an optimal sST2 value for reducing the risk of death. As stated by Richards et al [25], the greatest prognostic power is achieved when sST2 levels are measured early in the post-infarction phase; therefore, blood samples should be acquired as soon as possible in the ED. In conclusion, in patients presenting to the ED with chest pain, the sST2 levels seem to have higher prognostic value for 30-day cardiac mortality compared with hs-cTnI. In patients with ACS, sST2 assessment at ED arrival also seems to have greater prognostic value for 30-day cardiac death compared with hs-cTnI.
Therefore, compared with hs-cTnI, sST2 seems to be a useful tool to immediately detect patients at high risk of death within 30 days after hospital discharge in both STEMI and NSTEMI groups. The prognostic role of sST2 seems to increase when the cut-off value of >35 ng/mL is considered. Patients presenting to the ED with chest pain should be evaluated for sST2 levels im- mediately in order to identify the subgroup of subjects for whom a more intensive treatment strategy should be considered to avoid the occurrence of short-term cardiovascular death.
Authors’ Disclosures of Potential Conflicts of Interest
No potential conflicts of interest relevant to this article were reported.
REFERENCES
1. Hamm CW, Bassand JP, Agewall S, Bax J, Boersma E, Bueno H, et al.
ESC Guidelines for the management of acute coronary syndromes in patients presenting without persistent ST-segment elevation: The task force for the management of acute coronary syndrome (ACS) in patients presenting without persistent ST-segment elevation of the European So- ciety of Cardiology (ESC). Eur Heart J 2011;32:2999-3054.
2. Fruergaard P, Launbjerg J, Hesse B, Jørgensen F, Petri A, Eiken P, et al.
The diagnoses of patients admitted with acute chest pain but without myocardial infarction. Eur Heart J 1996;17:1028-34.
3. Amsterdam EA, Wenger NK, Brindis RG, Casey DE Jr, Ganiats TG, Hol- mes DR Jr, et al. 2014 AHA/ACC Guideline for the management of pa- tients with non-st-elevation acute coronary syndromes: A Report of the American College of Cardiology/American Heart Association Task Force on Practice Guidelines. J Am Coll Cardiol 2014;64:e139-228.
4. O’Gara P, Kushner FG, Ascheim DD, Casey DE, Chung MK, de Lemos JA, et al. 2013 ACCF/AHA guideline for the management of ST-eleva- tion Myocardial Infarction. A report of the American College of Cardiolo- gy Foundation/American Heart Association Task Force on Practice Guide- lines. J Am Coll Cardiol 2013;61:e78-140.
5. Keller T, Zeller T, Peetz D, Tzikas S, Roth A, Czyz E, et al. Sensitive tro- ponin I assay in early diagnosis of acute myocardial infarction. N Engl J Med 2009;361:868-77.
6. Reiter M, Twerenbold R, Reichlin T, Haaf P, Peter F, Meissner J, et al.
Early diagnosis of acute myocardial infarction in the elderly using more sensitive cardiac troponin assays. Eur Heart J 2011;32:1379-89.
7. Sherwood MW and Kristin Newby L. High-sensitivity troponin assays:
evidence, indications, and reasonable use. J Am Heart Assoc 2014;3:
e000403.
8. Apple FS, Collinson PO; IFCC Task Force on Clinical Applications of Car- diac Biomarkers. Analytical characteristics of high-sensitivity cardiac tro- ponin assays. Clin Chem 2012;58:54-61.
9. Twerenbold R, Jaffe A, Reichlin T, Reiter M, Mueller C. High-sensitive troponin T measurements: what do we gain and what are the challeng- es? Eur Heart J 2012;33:579-86.
10. Jaffe AS, Ravkilde J, Roberts R, Naslund U, Apple FS, Galvani M, et al.
It’s time for a change to a troponin standard. Circulation 2000;102:1216- 20.
11. White HD. Pathobiology of troponin elevations: do elevations occur with myocardial ischemia as well as necrosis? J Am Coll Cardiol 2011;57:
2406-8.
12. Cullen L, Mueller C, Parsonage WA, Wildi K, Greenslade JH, Twerenbold R, et al. Validation of high-sensitivity troponin I in a 2-hour diagnostic strat- egy to assess 30-day outcomes in emergency department patients with possible acute coronary syndrome. J Am Coll Cardiol 2013;62:1242-9.
13. de Lemos JA, Drazner MH, Omland T, Ayers CR, Khera A, Rohatgi A.
Association of troponin T detected with a highly sensitive assay and car- diac structure and mortality risk in the general population. JAMA 2010;
304:2503-12.
14. Ottani F, Galvani M, Nicolini FA, Ferrini D, Pozzati A, Di Pasquale G, et al. Elevated cardiac troponin levels predict the risk of adverse outcome in patients with acute coronary syndromes. Am Heart J 2000;140:917- 27.
15. Aldous SJ, Richards M, Cullen L, Troughton R, Than M. Diagnostic and prognostic utility of early measurement with high-sensitivity troponin T assay in patients presenting with chest pain. CMAJ 2012;184:E260-8.
16. Kohli P, Bonaca MP, Kakkar R, Kudinova AY, Scirica BM, Sabatine MS, et al. Role of ST2 in non-ST-elevation acute coronary syndrome in the
MERLIN-TIMI 36 trial. Clin Chem 58:257-66.
17. Eggers KM, Armstrong PW, Califf RM, Simoons ML, Venge P, Wallentin L, et al. ST2 and mortality in non-ST-segment elevation acute coronary syn- drome. Am Heart J 2010;159:788-94.
18. Sabatine MS, Morrow DA, Higgins LJ, MacGillivray C, Guo W, Bode C, et al. Complementary roles for biomarkers of biomechanical strain ST2 and N-terminal prohormone B-type natriuretic peptide in patients with ST-elevation myocardial infarction. Circulation 2008;117:1936-44.
19. Weinberg EO, Shimpo M, Hurwitz S, Tominaga S, Rouleau JL, Lee RT.
Identification of serum soluble ST2 receptor as a novel heart failure bio- marker. Circulation 2003;107:721-6.
20. Turnquist HR, Zhao Z, Rosborough BR, Liu Q, Castellaneta A, Isse K, et al. IL-33 expands suppressive CD11b+ Gr-1(int) and regulatory T cells, including ST2L+ Foxp3+ cells, and mediates regulatory T cell-depen- dent promotion of cardiac allograft survival. J Immunol 2011;187:4598- 610.
21. Manzano-Fernández S, Mueller T, Pascual-Figal D, Truong QA, Januzzi JL. Usefulness of soluble concentrations of interleukin family member ST2 as predictor of mortality in patients with acutely decompensated heart failure relative to left ventricular ejection fraction. Am J Cardiol 2011;107:259-67.
22. Weir RA, Millar AM, Murphy GE, Clements S, Steedman T, Connell JM, et al. Serum soluble ST2: a potential novel mediator in left ventricular and infarct remodeling after acute myocardial infarction. J Am Coll Car- diol 2010;55:243-50.
23. Miller AM, Purves D, McConnachie A, Asquith DL, Batty GD, Burns H, et al. Soluble ST2 associates with diabetes but not established cardio- vascular risk factors: a new inflammatory pathway of relevance to dia- betes? PLoS One 2012;7:e47830.
24. Seki K, Sanada S, Kudinova AY, Steinhauser ML, Handa V, Gannon J, et al. Interleukin-33 prevents apoptosis and improves survival after experi- mental myocardial infarction through ST2 signalling. Circ Heart Fail 2009;
2:684-91.
25. Richards AM, Di Somma S, Mueller T. ST2 in stable and unstable isch- emic heart diseases. Am J Cardiol 2015;115(7S):48B-58B.
26. Ky B, French B, McCloskey K, Rame JE, McIntosh E, Shahi P, et al. High- sensitivity ST2 for prediction of adverse outcomes in chronic heart fail- ure. Circ Heart Fail 2011;4:180-7.
27. Erhardt L, Herlitz J, Bossaert L, Halinen M, Keltai M, Koster R, et al. Task force on the management of chest pain. Eur Heart J 2002;23:1153-76.
28. Dieplinger B, Januzzi JL Jr, Steinmair M, Gabriel C, Poelz W, Haltmayer M, et al. Analytical and clinical evaluation of a novel high-sensitivity as- say for measurement of soluble ST2 in human plasma - the Presage ST2 assay. Clin Chim Acta 2009;409:33-40.
29. Apple FS, Collinson PO; IFCC Task Force on Clinical Applications of Car- diac Biomarkers. Analytical characteristics of high-sensitivity cardiac troponin assays. Clin Chem 2012;58:54-61.
30. Kavsak PA, MacRae AR, Yerna MJ, Jaffe AS. Analytic and clinical utility of a next-generation, highly sensitive cardiac troponin I assay for early detection of myocardial injury. Clin Chem 2009;55:573-7.
31. Brown AM, Wu AH, Clopton P, Robey JL, Hollander JE. ST2 in emer- gency department chest pain patients with potential acute coronary syn- dromes. Ann Emerg Med 2007;50:153-8.
32. Weinberg EO, Shimpo M, De Keulenaer GW, MacGillivray C, Tominaga S, Solomon SD, et al. Expression and regulation of ST2, an interleukin-1 receptor family member, in cardiomyocytes and myocardial infarction.
Circulation 2002;106:2961-6.
33. McCullough PA, Peacock WF, O’Neil B, de Lemos JA, Lepor NE, Berkow- itz R An evidence-based algorithm for the use of B-type natriuretic test- ing in acute coronary syndromes. Rev Cardiovasc Med 2010;11(S2):
S51-65.
34. Dhillon OS, Narayan HK, Khan SQ, Kelly D, Quinn PA, Squire IB, et al.
Pre-discharge risk stratification in unselected STEMI: is there a role for ST2 or its natural ligand IL-33 when compared with contemporary risk markers? Int J Cardiol 2013;167:2182-8.
35. Aldous SJ, Richards AM, Troughton NR, Than M. ST2 has diagnostic and prognostic utility for all-cause mortality and heart failure in patients presenting to the emergency department with chest pain. J Card Fail 2012;18:304-10.
36. Demyanets S, Speidl WS, Tentzeris I, Jarai R, Katsaros KM, Farhan S, et al. Soluble ST2 and interleukin-33 levels in coronary artery disease: re- lation to disease activity and adverse outcome. PLoS One 2014;9:e95055.
37. Shimpo M, Morrow DA, Weinberg EO, Sabatine MS, Murphy SA, Ant- man EM, et al. Serum levels of the interleukin-1 receptor family mem- ber ST2 predict mortality and clinical outcome in acute myocardial in- farction. Circulation 2004;109:2186-90.