467 https://doi.org/10.9713/kcer.2021.59.3.467
PISSN 0304-128X, EISSN 2233-9558
Effects of Reactor Type on the Economy of the Ethanol Dehydration Process:
Multitubular vs. Adiabatic Reactors
Kee-Youn Yoo†
Department of Chemical and Biomolecular Engineering, Seoul National University of Science and Technology, Seoul, 01811, Korea (Received 16 June 2021; Received in revised 22 June 2021; Accepted 1 July 2021)
Abstract: A kinetic model was developed for the dehydration of ethanol to ethylene based on two parallel reaction pathways. Kinetic parameters were estimated by fitting experimental data of powder catalysts in a lab-scale test, and the effectiveness factor was determined using data from pellet-type catalysts in bench-scale experiments. The developed model was used to design a multitubular fixed-bed reactor (MTR) and an adiabatic reactor (AR) at a 10 ton per day scale. The two different reactor types resulted in different process configurations: the MTR consumed the ethanol completely and did not produce the reaction intermediate, diethyl ether (DEE), resulting in simple separation trains at the expense of high equipment cost for the reactor, whereas the AR required azeotropic distillation and cryogenic distillation to recycle the unreacted ethanol and to separate the undesired DEE, respectively. Quantitative analysis based on the equipment and annual energy costs showed that, despite high equipment cost of the reactor, the MTR process had the advantages of high productivity and simple separation trains, whereas the use of additional separation trains in the AR process increased both the total equipment cost and the annual energy cost per unit production rate.
Key words: Ethanol dehydration process, Kinetic model, Multitubular fixed-bed reactor, Adiabatic reactor, Equipment cost, Energy cost
1. Introduction
Ethylene has been widely used in society to produce chemicals including polyethylene products (via polymerization), ethylene oxide (via epoxidation), and fuels (via oligomerization) [1]. The main technical process for producing ethylene is hydrocarbon cracking, which involves using petro-hydrocarbon or natural gas as raw material and the cracking of hydrocarbon compounds with a large number of carbon atoms into smaller hydrocarbon compounds at high temperature, typically in the presence of steam [2]. However, because nonrenewable fossil fuels will inevitably be depleted, it is urgent to seek nonpetroleum resources that can be used as raw materials to produce ethylene and that research focus on the catalytic dehydration of ethanol to ethylene [1-5]. Ethylene production via bioethanol dehydration has several advantages over petrochemical ethylene production processes, such as purity, organization of a closed loop production system, simplicity of technology and equipment, and low cost with short facility construction time [6,7].
Among a variety of heterogeneous catalysts, γ-alumina [8-11] and zeolite [12-16] have drawn considerable attention. Ethanol was shown to adsorb onto the surface of γ-alumina to produce ethylene and diethyl ether (DEE), and the production of acetaldehyde was observed at high temperature [10,17]. The reaction mechanism for the
production of ethanol and ethylene from DEE was suggested by the same research group, and reaction rates were measured [18]. Philips and Datta suggested a simultaneous parallel-consecutive scheme involving direct ethanol conversion and the consecutive reaction, as the production of DEE in significant quantities was observed at low temperature, and the effects of water in the ethanol feed were investigated under relatively mild operating conditions on HZSM-5 [14]. Other researchers also observed the production of DEE and proposed that the dehydration reaction proceeded via two competitive reaction paths [2,12,16,19]. Gayubo et al. proposed kinetic models for the transformation of aqueous ethanol into hydrocarbons on HZSM-5, where the selection of the kinetic model and the calculation of the kinetic parameters were conducted by fitting experimental data [13,20]. A detailed reaction network has been constructed using periodic density functional theory (DFT) calculations with dispersion corrections, where the decomposition of DEE to ethylene was investigated, apart from the direct conversion of ethanol to DEE or ethylene. In addition, after the thermodynamic and kinetic parameters were computed using statistical thermodynamics for all elementary steps, reaction path analysis for ethanol dehydration in HZSM-5 showed that ethylene is mainly produced via the direct dehydration of ethanol at high temperature, whereas the reaction path via DEE contributes significantly to ethylene formation at low temperature [21].
The bioethanol to ethylene process flowsheet includes a feedstock preparation and dosage module, an ethanol dehydration module, and an ethylene purification module, irrespective of the kind of catalyst and reactor unit type [7]. Kagyrmanova et al. [9] investigated the
†To whom correspondence should be addressed.
E-mail: [email protected]
This is an Open-Access article distributed under the terms of the Creative Com- mons Attribution Non-Commercial License (http://creativecommons.org/licenses/by- nc/3.0) which permits unrestricted non-commercial use, distribution, and reproduc- tion in any medium, provided the original work is properly cited.
dehydration of ethanol to ethylene on a commercialized Al-based catalyst, including a study of the reaction kinetics, reactor testing, and process simulation, in order to determine the operating characteristics and optimal operating conditions of an ethanol dehydration industrial tubular fixed-bed reactor with an annual output of 60,000 tons of ethylene. Detailed reviews of ethanol dehydration processes can be found in Zhang and Yu [2]. The technical and economic feasibility of different alternatives of ethylene production from biomass were assessed, where the design of the dehydration process was based on commercial technology [22]. A plant for ethylene production was also studied, where an isothermal reactor was considered to deliver a stream of 99 mol% ethylene [23], and a plant for the production of 0.1 MM ton per year (TPA) was provided with an isothermal reactor under the operating conditions of 240 °C and 1 bar (95% conversion) [24]. Meanwhile, it is thermodynamically advantageous with lower pressure, the equipment sizes will be larger. Therefore, three consecutive adiabatic reactors operating at 399 °C and 41 bar comprised a 1 MM TPA ethylene production plant (2.3 MM tons of a 95% ethanol and 5% water feed were converted) [25]. However, despite their significant role in the reaction pathways and product selectivity, the above mentioned literatures hardly consider detailed reaction kinetics in the design of the reactors and the effects of different types of reactors and catalysts on the separation schemes. Therefore, in the present study, reaction kinetics for the dehydration of ethanol are developed for both lab- and bench-scale reactors (powder- and pellet-type catalysts, respectively), and two different reactor configurations are considered to compare their performance at the pilot scale. After the details regarding the processes based on different reactors are explained, quantitative analyses such as capital investment for the reactors and
annual energy cost are conducted to determine the benefits and drawbacks of each process.
2. Materials and Methods 2-1. Lab-scale Experiments
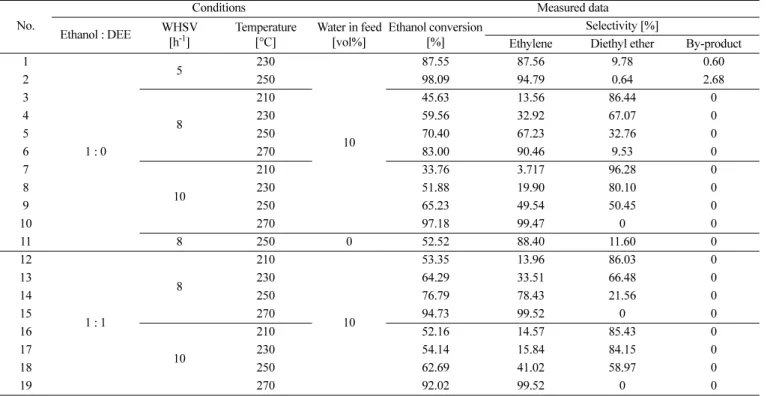
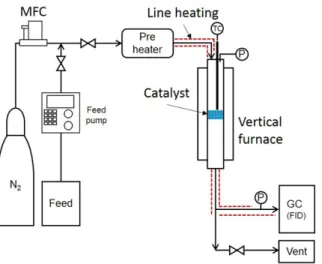
A commercial HZSM-5 catalyst (SMF20n, Shanghai Fuyu) with Si/Al ratio = 20 was used in this study. Before the reaction test, HZSM-5 catalyst was calcined at 500 °C for 5 h. In the lab-scale test, 0.2 g of powder catalyst (1~10µm) was added between quartz wool in a fixed-bed reactor of 0.95 cm (3/8 inch) stainless steel (SUS316L) tube. Pure ethanol (99.9%, Samchun) or mixed ethanol including 10 vol% water as feed, was injected at 0.02 mL/min to 0.04 mL/min for a range of 5 to 10 h-1, respectively, of weight hourly space velocity (WHSV). The reaction pressure was fixed at 1 bar with N2 carrier gas at 5 mL/min. The ethanol dehydration reactions were carried out at various reaction temperatures, from 210 to 270 °C. The reaction conditions and experimental system are shown in Table 1 and Fig. 1, respectively. To evaluate the effects of water in the feed on the conversion and selectivity, two different compositions (with and without water) were considered. The products were analyzed with an on-line gas chromatograph (GC; YoungLin 6100) equipped with a flame ionization detector and HP-PLOT/Q column (30 m × 0.535 mm × 40 μm).
2-2. Bench-scale Experiments
The HZSM-5 catalyst was extruded with clay (Kaolin, Samchun) and silica sol (LUDOX AS40H, Aldrich) to prepare the pellet-type catalysts with diameters of 3 mm for the bench-scale test, because
Table 1. Experimental conditions and measured data in the lab-scale tests
No.
Conditions Measured data
Ethanol : DEE WHSV [h-1]
Temperature [°C]
Water in feed [vol%]
Ethanol conversion [%]
Selectivity [%]
Ethylene Diethyl ether By-product 1
1 : 0
5 230
10
87.55 87.56 9.78 0.60
2 250 98.09 94.79 0.64 2.68
3
8
210 45.63 13.56 86.44 0
4 230 59.56 32.92 67.07 0
5 250 70.40 67.23 32.76 0
6 270 83.00 90.46 9.53 0
7
10
210 33.76 3.717 96.28 0
8 230 51.88 19.90 80.10 0
9 250 65.23 49.54 50.45 0
10 270 97.18 99.47 0 0
11 8 250 0 52.52 88.40 11.60 0
12
1 : 1
8
210
10
53.35 13.96 86.03 0
13 230 64.29 33.51 66.48 0
14 250 76.79 78.43 21.56 0
15 270 94.73 99.52 0 0
16
10
210 52.16 14.57 85.43 0
17 230 54.14 15.84 84.15 0
18 250 62.69 41.02 58.97 0
19 270 92.02 99.52 0 0
those binder materials had no acid site, resulting in no reactivity with ethanol. The amount ratio of the catalyst, clay and silica (dry basis) for the preparation of the pellet-type catalysts was 60 : 10 : 30 wt%, respectively. The ratio was selected to optimize both activity and mechanical strength. The detailed extrusion procedure was carried out using the method described in our previous work [26] and a literature [27]. The final extruded pellet-type catalyst was dried and calcined at 120 °C and 500 °C for more than 5 h, respectively. In a bench-scale fixed-bed reactor of 1.9 cm (3/4 inch) SUS tube, 10 g extruded catalyst was added. Bioethanol including 10 vol% water was injected at 0.42 and 0.84 mL/min for 2 and 4 h-1, respectively, of WHSV. The scheme of the reaction setup was basically same with the lab-scale experiments, except that the lab-scale reactor was replaced with a bench-scale reactor with the pellet-type catalysts. The reaction was conducted under atmospheric condition with N2 carrier gas at 100 mL/min. The bench-scale experiments were carried out at 250 and 270 °C. The products were analyzed using the same GC system as that for the lab-scale experiment.
2-3. Reactor Modeling
Because powder catalysts were used in lab-scale experiments and linear velocity was relatively high to maintain the reaction in the kinetic regime, the existence of external mass transfer and internal pore diffusion limitations were assumed to be negligible. In order to validate the assumption, the dimensionless Mears parameters were calculated under all the experimental conditions in the present study and the values were less than 3.80 × 10⁻⁷ (much lower than the threshold value of 0.15), confirming negligible external mass diffusion [28].
The occurrence of any internal pore diffusion limitation was evaluated using the Weisz-Prater criterion. Dimensionless Weisz-Prater parameters (CWP) were calculated to be much lower than 0.01 (less than 10-7) [28, 29], indicating no internal diffusion limitation. The dispersion coefficient (De/usL), which is defined as the ratio of the transport rate by dispersion to that by convection (the reciprocal of the dimensionless Péclet number) [28], was calculated using the correlation for effective
diffusivity (De) [30] and linear velocity at the inlet and replacing the reactor length (L) with packing depth. The values under all operating conditions showed that the contribution of dispersion was less than 0.01; thus, a plug flow model without dispersion was used to simulate the reactor as follows:
Mass balance: (1)
Boundary conditions: ci=ci,0 at z = 0 (2) For the bench-scale reactor modeling, the plug flow model with effectiveness factor was used to consider internal diffusion limitation by the use of catalyst pellets, while pilot-scale reactors (both adiabatic and multitubular) were modeled using default modules provided in a process simulator (UniSim Design Suite, Honeywell Inc.).
In experimental studies, the pressure drop was observed to be negligible in both lab- and bench-scale reactors, and thus, the momentum balance was not considered. In the pilot-scale reactor, the inlet pressure needs to be higher than the exit pressure and the installation of a pump is required. However, in the present study, we have assumed the portion of the cost for the pump was insignificant compared to the other units.
2-4. Parameter Estimation
Based on the results of lab-scale experiments under the conditions in Table 1, kinetic parameters were estimated by minimizing the objective function (Fobj), which is the sum of the residuals of square errors of the objective elements as follows:
(3)
where NE and wk denote the number of experimental conditions and the weighting factor, respectively. The symbol Xk represents the element of the objective function (k = EtOH conversion, and selectivities of ethylene, DEE and butene). It should be noted that, as shown in Table 1, DEE was included in the feed in order to estimate the contribution of each pathway clearly.
When the pre-exponential factor and activation energy of kj is estimated using the Arrhenius equation, differences in the orders of magnitude between parameters may cause extremely high statistical correlation and ill-conditioning problems; thus, the following form was used in the estimation procedure:
(4)
where gas constant (R) is 8.314 J/(mol·K) and the subscript ref denotes the reference condition whose temperature (Tref) was specified to be 250 °C.
The estimation was performed using the “lsqcurvefit” subroutine in MATLAB (MathWorks, Inc.), where the Levenberg-Marquardt method was applied.
1 , 0
i NR
s B i j
j
u dc R
dz ρ
=
− +
∑
=2 ,calc ,exp
,exp
NE k k
obj k
n k k
n
X X
F w
X
⎡ ⎛ − ⎞ ⎤
⎢ ⎥
=
∑ ∑
⎢⎣ ⎜⎜⎝ ⎟⎟⎠ ⎥⎦,ref
ref
1 1 exp j
j j
k k E
R T T
⎡ ⎛ ⎞⎤
= ⎢− ⎜ − ⎟⎥
⎝ ⎠
⎣ ⎦
Fig. 1. Schematic diagram of the experimental system.
2-5. Techno-economic Analysis
The equipment cost and annual energy cost are calculated using the chemical engineering plant cost index (CEPCI) [31]. The correlation equations used for the purchased and installed costs are provided in Table 2. Heat transfer area (A) was calculated by dividing the value of UA in the process simulator (UniSim Design Suite, Honeywell Inc.) by the overall heat transfer coefficient (U) [32]. The other parameters used in the equations, such as FP, FM, FL, FT, and FS, are available in the literature [31].
The diameter of the distillation trays were calculated using the correlation in the literature as follows:[33]
(5)
where (ρ: density) and C =m(lnσ).
The values of m and b are available in the literature [33], and the liquid surface tension (σ) was determined in such a way that the values in the trays, which were exported from the process simu- lator, were averaged. The calculated value of Dmin was applied to the correlations for CPUR and CINS for distillation (Table 2), and, among reported values for the height of a single tray in industrial scale [34], the value to minimize the sum of CPUR and CINS was selected to be the height of a single tray in the present study, which was then multiplied by the number of trays to determine the height of the entire column. The purchased cost of the distillation was calculated using the equation for the pressure vessel. Meanwhile,
another correlation (Table 2) was applied to calculate the installed cost per the distillation column.
The cost of the cooling water was calculated by adjusting the value of $0.01/ton in 2004 with the CEPCI of 444.2 and 576.1 for 2004 and 2014, respectively [32]. The cost of the refrigerant in the cryogenic distillation was calculated in the same way, and the value was determined as $19.45/MJ ($15/MJ in 2004). Because the heating oil (Dowtherm A) was heated using electricity, the cost of heating was determined to be same as the cost of electricity ($19.45/MJ).
3. Results and Discussion 3-1. Reaction mechanism and rates
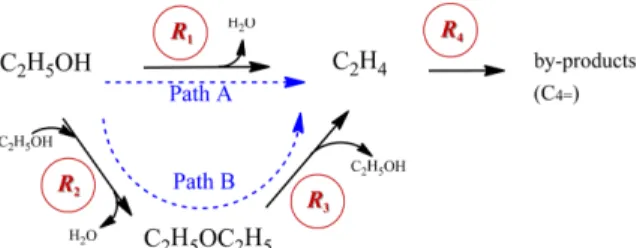
There have been many reports that two competitive reaction pathways exist in the dehydration of ethanol: one in which ethanol decomposes directly to ethylene (Path A in Fig. 2), and another in which the formation of DEE is followed by its decomposition to ethylene (Path B in Fig. 2). Based on these suggested pathways, elementary steps for the adsorption and surface reactions were suggested (Table 3), and reaction rates were derived under the assumption of rapid equilibrium for the adsorption. It is worth noting that although ethane, propane, propylene, butane, and butene have been reported as by-products in the conversion of ethylene [13,20,35,36], only a slight amount of butene was observed and the others were not detected. Therefore, butene was considered as the by-product in this study. In addition, the competitive adsorption of water with other species (ethanol, DEE, and ethylene) was assumed [14,20,37]. It
min max
4qL
D = πW
( )
1/2max vapor liquid vapor
W =C ρ⎡⎣ ρ −ρ ⎤⎦
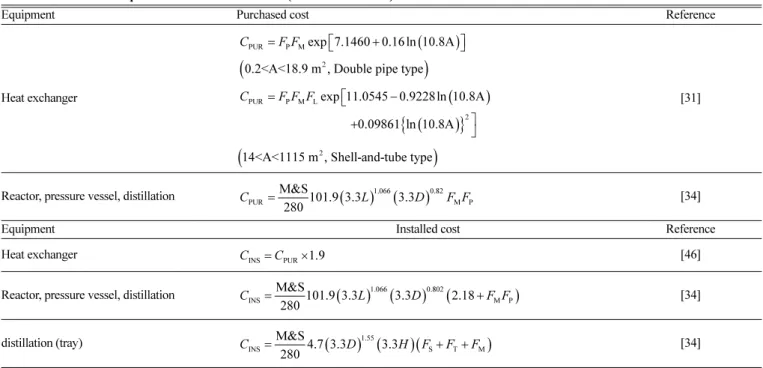
Table 2. Correlations of purchased and installed costs (from the literature)
Equipment Purchased cost Reference
Heat exchanger [31]
Reactor, pressure vessel, distillation [34]
Equipment Installed cost Reference
Heat exchanger [46]
Reactor, pressure vessel, distillation [34]
distillation (tray) [34]
§CPUR: equipment purchased cost [$], CINS: equipment installed cost [$]
FP: pressure parameter, FM: material parameter, FL: tube length parameter, FT: tray type parameter, FS: tray spacing parameter
A: heat transfer area [m2], L: length [m], D: diameter [m], H: tray stack height [m]
M&S: Marshall & Swift index
( )
PUR P Mexp 7.1460 0.16ln 10.8A
C =F F ⎡⎣ + ⎤⎦
(
0.2<A<18.9 m , Double pipe type2)
( )
( )
{ }
PUR P M L
2
exp 11.0545 0.9228ln 10.8A 0.09861 ln 10.8A
C =F F F ⎡⎣ −
+ ⎤⎦
(
14<A<1115 m , Shell-and-tube type2)
( ) (
1.066)
0.82PUR M&S101.9 3.3 3.3 M P
C = 280 L D F F
INS PUR 1.9
C =C ×
( ) (
1.066) (
0.802)
INS M&S101.9 3.3 3.3 2.18 M P
C = 280 L D +F F
( ) (
1.55)( )
INS M&S 4.7 3.3 3.3 S T M
C = 280 D H F F+ +F
should be also noted that, since the reaction pathways in Fig. 2 do not completely describe all the kinetically relevant underlying chemistry, the developed model might be limitedly used when a more complex reaction network with species other than ethylene, DEE and butene included should be considered. In the case of the formation of by- product (butene), a power law model was used for simplicity because no detailed mechanism for by-products was provided:
(6)
(7)
(8)
(9) where Pi, kj, and Kadi represent the partial pressure in bar, kinetic rate constant, and adsorption equilibrium constant, respectively;
and the reaction rates Rj are reported in mmol/(gcat·h).
The values of the estimated parameters are provided in Table 4, and the comparisons between experimental data and results simulated with the estimated parameters are provided in Fig. 3 as a function of operating conditions. It should be noted that, small number of experimental data points may reduce the identifiability of kinetic parameters to be estimated; in other words, too many number of estimated parameters may result in over-fitting problem. Therefore, adsorption equilibrium constants, which were found to less significantly affect the objective elements than forward reaction rate constants during the estimation procedure, were assumed to be constant within limited temperature range [38]. In addition, since the purpose of the present study is to develop a kinetic model for its application to evaluate the effects of reactor type on the economy of the ethanol dehydration process, it was determined to use the model with apparent kinetic parameters. The weighting factors were set at 1 for all the elements for balanced estimation. To prevent the estimated values from local minimum in the regression procedure, several initial estimates were tried in the estimation, and values with the lowest objective function was assumed to be the global optimum.
Some of the experimental data, which was used in the denominator
(
1 EtOH EtOH)
1 2
EtOH EtOH DEE DEE C2 C2 water water
1
ad
ad ad ad ad
k K P
R = K P K P K P K P
+ + + +
( )
( )
2 2 EtOH EtOH
2 2
EtOH EtOH DEE DEE C2 C2 water water
1
ad
ad ad ad ad
k K P
R = K P K P K P K P
+ + + +
(
3 DEE DEE)
3 2
EtOH EtOH DEE DEE C2 C2 water water
1
ad
ad ad ad ad
k K P
R = K P K P K P K P
+ + + +
4 4 C2
R =k P Fig. 2. Reaction pathways for the dehydration of ethanol to ethylene.
Table 3. Elementary steps for the dehydration of ethanol□
Adsorption Equilibrium constant
C2H5OH + s F C2H5OH(s) (C2H5)2O + s F (C2H5)2O(s) C2H4 + s F C2H4(s)
H2O + s F H2O(s) Surface reaction
R1: C2H5OH(s) + s → C2H4(s) + H2O(s) R2: 2C2H5OH(s) → (C2H5)2O(s) + H2O(s) R3: (C2H5)2O(s) + s → C2H5OH(s) + C2H4(s)
□Symbol ‘s’ represents the vacant site, and species with (s) denotes the adsorbed one.
EtOH EtOH EtOH ad
s
K P
θ
= θ
DEE DEE DEE ad
s
K P
θ
= θ
C2 C2 C2 ad
s
K P
θ
= θ
water water
water ad
s
K P
θ
= θ
Table 4. Estimates of kinetic parameters used in this paper
Kinetic parameters Units
Forward reaction rate constants
k1,ref 8.02 × 10²± (1.35)‡ mmol/(gcat·h)
k2,ref 1.02 × 10³± (5.79)‡ mmol/(gcat·h)
k3,ref 8.02 × 10²± (2.53)‡ mmol/(gcat·h)
k4,ref 1.01 × 10⁻¹± (1.8810–3)‡ mmol/(gcat·h·bar)
E1 193,530 ± (1,517)‡ J/mol
E2 47,210 ± (319)‡
E3 167,040 ± (634)‡
E4 35,490 ± (493)‡
Adsorption equilibrium constants†
KadEtOH 1.00100± (5.3010–3)‡ bar-1
KadDEE 7.0110-1± (5.2110–4)‡ bar-1
KadC2 1.0010-2± (3.5910–5)‡ bar-1
Kadwater 1.0010-2± (5.3510–5)‡ bar-1
†
‡95% confidence interval of the estimated parameters
,ref
ref
1 1
exp j
j j
k k E
R T T
⎡ ⎛ ⎞⎤
= ⎢− ⎜ − ⎟⎥
⎢ ⎝ ⎠⎥
⎣ ⎦
for the calculation of individual relative errors, included values close to zero, resulting in high mean of absolute relative residual (MARR) values [39-41], despite satisfactory agreement between experimental data and simulated results as shown in Fig. 3. Therefore, weighted absolute percent error (WAPE), which is known to be appropriate when small denominators might result in a singularity problem, was used to conduct statistical analysis for the estimation results, and the values for the ethanol conversion and the selectivities of ethylene and DEE were 18.8%, 20.6%, and 27.4%, respectively. The definitions of MARR and WAPE are as follows:
where y represents the objective elements (conversion, and selec- tivities of ethylene and DEE in the present study), and subscripts
‘exp’ and ‘cal’ denote experimental data and calculated values, respectively.
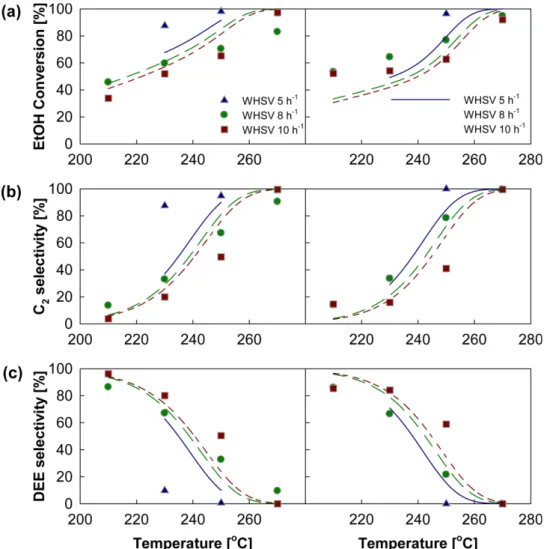
As either temperature increased or space velocity decreased, both ethanol conversion and ethylene selectivity increased, while DEE selectivity decreased. This indicates that, to guarantee a 100% ethylene yield, high temperatures and low space velocities are required. In general, DEE, which is larger than EtOH, is expected to have larger value of adsorption equilibrium constant due to more dispersion interactions with the zeolite framework. However, as shown in Table 4, Kad of DEE was determined to have an order of magnitude similar to the other species, probably due to the uncertainty of the model resulting from the simplicity of the reaction network and negligible temperature dependence of adsorption parameters. It is also worth noting that, the value of E4 is relatively low compared to the others, which might be attributed to model mismatch resulting from unknown mechanism and insufficient number of data (in most cases, the amount of butene was almost zero). However, because the formation rate of butene was significantly lower than the other rates, low value of E4
made little effect on overall kinetic behaviors.
Because pellet- or granular-type catalysts are generally used in large-scale reactors to prevent severe pressure drop, reaction rates are
(
,exp ,cal ,exp)
MARR [%] 100 i i i
i y y y NE
⎡ ⎤
= ×⎢⎣
∑
− ⎥⎦,exp ,cal ,exp
WAPE [%] 100 i i i
i y y i y
⎛ ⎞ ⎛ ⎞
= ×⎜⎝
∑
− ⎟ ⎜⎠ ⎝∑
⎟⎠Fig. 3. Comparison between experimental data (symbols) and simulated results (lines): (a) ethanol conversion and selectivities of (b) ethylene and (c) diethyl ether (DEE). Left-hand and right-hand columns correspond to the conditions of ethanol: DEE = 1:0 and 1:1, respectively.
Weighted absolute percent error for the conversion, and the selectivities of ethylene and DEE, are 18.8%, 20.6%, and 27.4%, respectively.
affected by external mass transfer and internal diffusion limitation. It was assumed in the present study that high linear velocity of the feed might eliminate the external mass transfer resistance film, whereas internal diffusion limitation was considered by applying the effectiveness factor [28,42]. Experiments were conducted using extruded catalysts at temperatures of 250 and 270 °C and space velocities of 2 and 4 h-1 for each temperature (4 conditions). For simplicity and because of the limited amount of experimental data, the effectiveness factor was assumed to be constant, and the value was determined to be approximately 0.3 by fitting the experimental data; Absolute relative errors of ethanol conversion and ethylene selectivity were calculated as a function of effectiveness factor, and the value which minimized both conversion and selectivity in a balanced manner was chosen.
This procedure also showed the sensitivity of simulated values with respect to effectiveness factor. As shown in Fig. 4, the simulated results of the ethanol conversion and ethylene selectivity with the estimated kinetic parameters and effectiveness factor were in good agreement with the experimental data. The MARRs were 12.8% and 9.7% for the conversion and selectivity, respectively, and the corresponding relative standard deviation of individual errors (RSDEs) were 15.5% and 12.8%.
3-2. Dehydration Processes: Multitubular vs. Adiabatic Reactors Using the reaction rates developed in the previous section, dehydration processes with different types of reactors were developed. Two fixed bed reactor configurations represent the different commercial heat transfer schemes between continuous heating (MTR, expensive and
complex equipment) and stage-wise heating (adiabatic reactor trains, cheap and easy operation) in the extreme-case, respectively. The two different strategies induce the different reactor effluents and the different separation trains. Thus the economic evaluation of two configurations, in effect, reveals which strategy of reactor temperature control is superior in the designed entire process. A process simulator, UniSim Design Suite (Honeywell Inc.), was used; the nonrandom-two-liquid- model (NRTL) was considered because of its wide applicability (e.g., multicomponent, azeotropic, liquid-liquid equilibria, dilute systems) compared to other activity models, whereas the Soave- Redlich-Kwong (SRK) equation of state was used for the vapor phase; Peng-Robinson equation of state is known to predict the gas phase behaviors of hydrocarbons, while SRK fits well for the molecules with oxygen atoms such as water, ethanol and diethyl ether. The flowrate of the feed, composed of 90 vol% ethanol and 10 vol%
H2O, was specified to be 10 ton per day (TPD) as a pilot-scale process, and two different types of reactors (multitubular fixed-bed reactor and adiabatic reactor) were considered. One can consider the use of bio-ethanol from a fermentation broth, which includes too much water, directly. However, if water is not removed, the reactor volume is increased due to the increased space velocity. In addition, one of our collaborating companies are already producing bio-ethanol with 10% water included via one-step distillation (cf. three-steps distillations are necessary to remove water completely), and thus, 90 vol% ethanol and 10 vol% H2O, was considered as a feed. Dowtherm A, one of the most widely applied commercial oils, was used as the heating medium in both processes, whereas cooling water was the cooling media.
3-2-1. Multitubular fixed-bed reactor-based process (MTR process) Because of the endothermic characteristics of the dehydration reaction, it is important to design a multitubular reactor with an effective heat supply along the reactor axis. The tube diameter was assumed 0.03 m, whereas the ratio of tube length to diameter (L/D ratio) was specified as 100 [24,43,44]. The reactor inlet temperature was deemed 300 °C, which is about 10% higher than the maximum temperature in the experimental conditions, because high temperature leads to 100% ethylene selectivity. It is worth noting that, because the apparent kinetic model was developed within a temperature range of 210~270 °C and temperature dependence of adsorption equilibrium constant was neglected, slightly higher temperature than 270 °C may reduce the reliability of the results in this section marginally. Total reactor volume was calculated by considering the feed flowrate and the space velocity of 5 h-1, which was the lowest value in the lab-scale experimental conditions (Table 1) and showed 100% ethanol conversion and no DEE production in the experimental data (Fig. 3). However, as the simulation results under the same condition showed the production of a small amount of DEE, which requires the application of additional cryogenic distillation, the number of tubes was increased to 100 to ensure complete conversion of ethanol and that no DEE was produced. Finally, 120 tubes were selected Fig. 4. Comparison between experimental data (symbols) and sim-
ulated results (lines) for a bench-scale reactor: (a) ethanol conversion and (b) ethylene selectivity, under different tem- peratures and space velocities. Mean of absolute relative residuals for the conversion and selectivity are 12.8% and 9.7%, respectively, and the corresponding relative standard deviation of individual errors are 15.5% and 12.8%.
considering the 20% margin (SV = 3.3 h-1), and total catalyst loading corresponded to 125 kg. It should be noted that small amounts (0.03%) of by-products (mostly butene) were produced, which was deemed allowable.
Inlet temperature for the utility (shell side) was specified to be 330 °C, and the flow rate of the heating oil was determined so that the temperature decrease along the reactor axis was 40 °C [45]. Under such conditions, the temperature profile of the tube side showed an abrupt decrease of approximately 40 °C early on and then gradually increased along the reactor axis.
Fig. 5 shows the scheme of an MTR process. The feed is heated using the reactor effluent in a preheater (heat exchanger in counter flow configuration, HEX E101), where the minimum approach temperature (ΔTmin) was specified as 10 °C [31]. The stream was further heated (E102) to the reactor inlet temperature using the heating oil, where
the ΔTmin was specified as 30 °C [31]. The reactor effluent, after passing through E101, was further cooled to 42.2 °C (the temperature of the cooling water was assumed to be 32.2 °C and ΔTmin was 10 °C [31]) in a cooler (E103) and most of the water was removed in the separator (SEP). A slight amount of water included in the vapor outlet from the separator was removed using the adsorbent Zeolite 4A in a dryer (Dryer) [24,25]. The final product stream (Dryer_out) had an ethylene production rate of 233.4 kg/h (61 wt% of ethanol in the feed), which is the maximum theoretical yield.
3-2-2. Adiabatic reactor-based process (AR process)
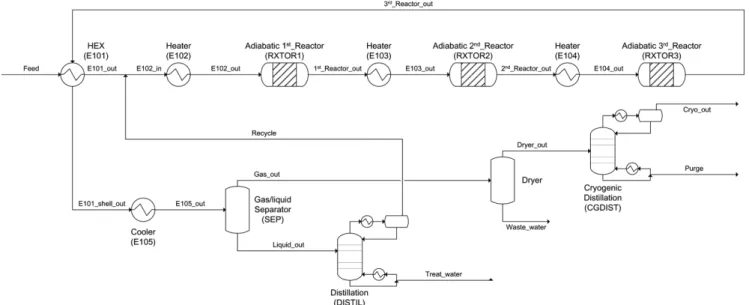
Fig. 6 shows the scheme of the AR process. Despite their simple structure and low manufacturing cost, adiabatic reactors require an inter-heating system to compensate for the temperature decrease due to the strong endothermic reaction. The volume of a single adiabatic
Fig. 5. Schematic diagram of a multitubular reactor-based ethanol dehydration process.
Fig. 6. Schematic diagram of an adiabatic reactor-based ethanol dehydration process with recycle.
reactor was assumed to be identical to the total volume of catalytic tubes in the multitubular reactor, and the L/D ratio was specified to be 1.27 (D = 0.597 m, L = 0.759 m) [25,46]. Because heat sources were not present, ethanol was partially converted (47.5% conversion).
However, because 100% conversion of ethanol requires an exorbitant number of reactors in a series, only three reactors were used (total catalyst loading was 315 kg; 105 kg in each reactor) [4,25,47]. Three heaters were installed prior to the startup of each reactor to make the feed temperature 300.0 °C, which was the same temperature for the multitubular reactor.
After the recycle stream of unreacted reactants was introduced (details about the separation trains will be explained later), the outlet temperatures of the first, second, and third reactors were 221.7, 219.6, and 221.5 °C, respectively, and local conversions were 44.8, 39.2, and 38.8%, respectively (global conversions were 44.8, 66.4 and 79.5%). The selectivities of ethylene and DEE at the outlet of the third reactor were 76.4 and 23.6 wt%, respectively. It should be noted that, although local conversion at the second reactor was lower than at the first one, its temperature decreases; in other words, the amount of heat absorbed was larger. This is attributed to the different roles of elementary reactions in the dehydration. As shown in Fig. 7a, the degree of decrease of EtOH consumption via R2 (exothermic, conversion of ethanol to DEE) was higher than that of EtOH consumption via R1 (endothermic, direct conversion of ethanol to ethylene), and DEE consumption via R3 (endothermic, conversion of DEE to ethylene) slightly increased along the reactor. Therefore, the net heats of reaction were 77.5 and 82.7 MJ/h for the first and second reactors, respectively.
The vapor stream from the gas/liquid separator (SEP) included mainly ethylene and DEE, whereas the liquid stream was composed of ethanol and water. A small amount of water, included in the vapor stream, was further removed by a dryer (Dryer) and the dry gas was separated to pure ethylene (99.9 wt% in Cryo_out) and DEE (99.6 wt% in Purge) using cryogenic distillation (CGDIST). Because the theoretical number of trays for 0.02 mol% DEE in a distillate and 1 mol% ethylene in a bottom was calculated as 6.36, the actual number of trays was determined to be 10 under the assumption of 80%
efficiency as well as 20% margin.
The liquid stream from the SEP entered a distillation column (DISTIL), where a distillate included the mixture of ethanol and water owing to the existence of azeotrope. The molar composition of ethanol in a distillate was specified as 0.7, which was determined by considering 20% margin of azeotropic composition (0.88) at 42.2 °C and 1 bar, whereas ethanol in the bottom was specified to be 1 mol%, resulting in theoretical and actual numbers of trays of 7.31 and 11 (80% efficiency, 20% margin), respectively. The distillate of DISTIL (81.4 wt% ethanol) was recycled to the heater for the first reactor.
Because the mass flow rate of the recycled stream was 69.2 kg/h, which was approximately 16.7% of the Feed stream, the differences in the conversion and selectivity between before and after recycling were insignificant. It is worth noting that, when recycling of unreacted reactant is applied in the process, the overall conversion over the boundary of the process is 100%. However, in the present process, there occurred 8.84 wt% loss of the ethanol in the feed via two process exit streams: 7.87 wt% and 0.97 wt% loss in the Waste_water stream (Dryer) and Treat_water stream (DISTIL), respectively. The degree of loss might be decreased if the gas/liquid separator (SEP) is replaced with a more advanced separation system, at the expense of equipment and energy costs.
3-3. Comparison of equipment and energy costs
As discussed in the previous section, the lack of production of DEE in the multitubular fixed-bed reactor simplified the separation significantly at the expense of reactor manufacturing cost owing to the complex structure, whereas the 79.5% conversion and existence of DEE (14.3 wt%) in the process based on adiabatic reactors (simple and low cost) required recycling and complex separation trains. In addition, the complete conversion of ethanol in the MTR process obviated the distillation column for ethanol and water mixture, whereas the AR process was unable to guarantee 100% conversion because of the loss of ethanol in the separation trains even with the use of a recycling stream. The production rates of ethylene for the MTR and AR processes were 233.4 and 162.5 kg/h, respectively, for the same feed flow rate. In this section, a quantitative comparison of the equipment cost and annual energy cost of the two processes is presented using the chemical engineering plant cost index (CEPCI) [31].
The equipment cost of the multitubular fixed-bed reactor was calculated using the equation for the shell-and-tube-type heat exchanger, with catalytic beds and heating fluid (Dowtherm A) channels for the Fig. 7. (a) Reaction rates and (b) heat generated/released for each
elementary reaction in the adiabatic reactor-based process.
tube and shell sides, respectively. The overall heat transfer coefficient (U) was assumed to be 100 W/(m2·°C), as 20~120 W/(m2·°C) are the values commonly used in industrial catalytic reactors [32]. Meanwhile, the correlation of a pressure vessel (Table 2) was used for the adiabatic reactors as well as the separator (flash drum), with corresponding parameters available in the literature [34]. For the separator, liquid holdup, residence time, and L/D ratio were assumed as 50%, 5 min, and 3, respectively [46].
Unlike Jernberg et al. [24], in whose work Zeolite 3A was used to adsorb water, both water and ethanol were included in the present study; thus Zeolite 4A was assumed to adsorb both substances. The weight of the adsorbent was calculated by dividing the amount of water and ethanol by the maximum amount of adsorbate per unit weight of the adsorbent (q). The correlation for q is available in the literature [48] as follows:
: dual-site Langmuir model (10)
: single-site Langmuir model (11)
where fugacity (f ) is reported in Pa-1, and the values for the parameters (K and qm) are provided in the literature [48]. Because the adsorption capacity is assumed to be reduced by half when two molecules exist in the mixture, half of the values predicted by equations (10) and (11) were used for the mixture. Meanwhile, since only water had to be adsorbed in the MTR process, equation (10) was used as such when calculating the weight of the adsor- bent, which was further multiplied by 1.2 (20% margin).
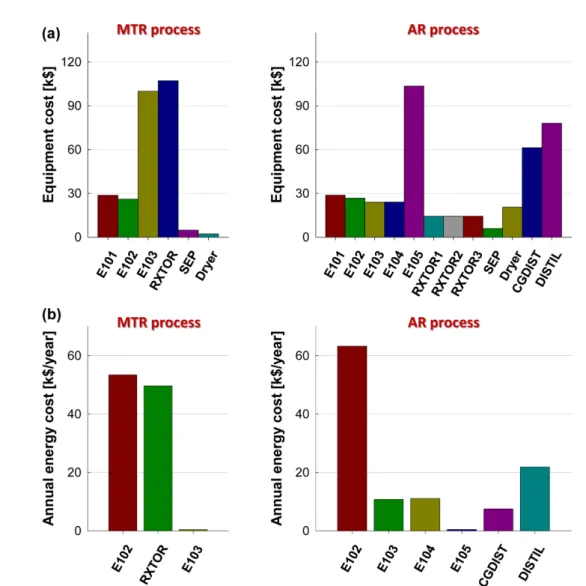
Fig. 8 shows the comparison of equipment cost and annual energy cost for each unit operation in the processes. As shown in the left diagram of Fig. 8a, the multitubular reactor (RXTOR) and the cooler (E103) accounted for more than 75% of the total equipment cost in the case of the MTR process, whereas the costs of the adiabatic reactors were significantly reduced (the cost of all three reactors was approximately 40% of that of the multitubular reactor). The costs of the coolers in both processes (E103 and E105 in the MTR and AR processes, respectively) were similar because the inlet temperatures were nearly identical. Meanwhile, the use of adiabatic reactors increased the cost of the Dryer substantially (about ninefold) and introduced additional cost from the cryogenic
H O2 1mA AA 1mB BB q K f q K f q = K f + K f
+ +
EtOH 1m q q Kf
= Kf +
Fig. 8. (a) Equipment cost (purchased and installed) and (b) annual energy cost for each unit operations, in processes based on the multitu- bular fixed-bed reactor (left) and the adiabatic reactors (right) (1 k$ = 1,000 $).
(CGDIST) and ordinary (DISTIL) distillation columns for pure ethylene and water, respectively.
When heating the reactor inlet stream (E102 in both processes), the E102 in the AR process (the right diagram of Fig. 8b) required more energy than that in the MTR process, to compensate for the lower amount of heat exchanged in the preheater (HEX E101 in both processes) of the AR process than that of the MTR. The temperatures of the reactor effluents for the first AR and the MTR were 221.5 and 290.8 °C, respectively. The second and third AR heaters required little energy, whereas the MTR process required the energy for the multitubular reactor to maintain its temperature profile. However, the AR process required additional energy to separate the mixtures (CGDIST and DISTIL), and thus, the total energy cost becomes similar between two processes.
Fig. 9 shows a comparison of the productivity and equipment and annual energy costs between the two processes. Owing to the high performance of the multitubular fixed-bed reactor (100% conversion and ethylene selectivity), the production rate of the MTR process reached the maximum theoretical yield (1.57 kton/year = 5.60 ton/day, under the assumption of 280 days of operation per year), whereas the AR process showed low productivity (1.09 kton/year = 3.89 ton/day, ca. 70% of the maximum theoretical yield) because of incomplete conversion and loss of reactant from mixture separation. The use of additional separation trains in the AR process increased the equipment cost (1.55 times higher than that of the MTR process, as shown in Fig. 9b), whereas annual energy costs for both processes were similar.
In addition, considering the energy cost per unit production rate (Fig.
9d), the advantage of the MTR process over the AR process was clearly shown. Although DEE has an economic value as a solvent and it can be valorized as such, the MTR process might be still suggested because the amount of DEE was not enough to compensate for high equipment and energy costs of the AR process. It should be noted that techno-economic analysis results might change for commercial- scale processes, as the capacities of the processes in the present study are not as large as those of commercial processes. Since a pilot-scale process will be constructed in near future, the validity of the developed model will be further corroborated, and then, the methodology presented in this work will be applied to make comparisons between two processes based on different types of reactors.
4. Conclusions
Multitubular fixed-bed and adiabatic reactors in pilot-scale were designed based on the kinetic rate equations and effectiveness factor developed by fitting experimental data. The different characteristics of two different types of reactors resulted in different compositions of the reactor effluent, requiring completely different separation trains. A multitubular reactor-based process accomplished complete conversion of ethanol with simple separation trains at the expense of equipment and energy costs in the reactor, whereas the existence of unreacted ethanol and undesired DEE in an adiabatic reactor-based process necessitated additional azeotropic and cryogenic distillation columns, both of which had negative techno-economic effects, increasing equipment and energy costs. Despite relatively small capacity of the Fig. 9. (a) Productivity (production rate of ethylene in kton/year), (b) Equipment cost (purchased and installed), (c) annual energy cost, and
(d) annual energy cost per unit production rate, for the different reactor types. Exact values are located at the top of each bar in the graph.
process, the approach based on detailed reactor design in the present study showed the merit of the multitubular reactor-based process over the adiabatic reactor-based one. This strategy can be further used in the design of an efficient and economic process for the production of ethylene from ethanol.
Nomenclature A : Heat transfer area [m2] C2 : Ethylene
CEPCI : Chemical engineering plant cost index ci : Concentration of species i [mol/m3] CINS : Equipment installed cost [$]
CPUR : Equipment purchased cost [$]
CWP : Dimensionless Weisz-Prater parameter DEE : Diethyl ether
DFT : Density functional theory D : Tube diameter [m]
De : Effective diffusivity [m2/s]
Ej : Activation energy for reaction j [J/mol]
EtOH : Ethanol f : fugacity [Pa-1]
F : Parameter for cost correlation Fobj : Objective function
Kadi : Adsorption equilibrium constant for species i [bar-1] kj : Kinetic rate constant for reaction j [mmol/(gcat·h)]
L : Tube length [m]
MARR : Mean of absolute relative residuals [%]
M&S : Marshall & Swift index
NE : Number of experimental conditions NRTL : Non-random-two-liquid-model Pi : Partial pressure for species i [bar]
qL : Mass flowrate of liquid [lb/h]
R : Gas constant [J/(mol·K)]
Rj : Reaction rate for reaction j [mmol/(gcat·h)]
RSDE : Relative standard deviation of individual error [%]
SRK : Soave-Redlich-Kwong T : Temperature [°C]
ΔTmin : Minimum approach temperature [°C]
TPA : Ton per annum TPD : Ton per day
U : Overall heat transfer coefficient [W/(m2·°C)]
us : Linear velocity of fluid [m/s]
WAPE : Weighted absolute percent error [%]
wk : weight factor for the object function
Wmax : maximum allowable mass velocity using bubble cap trays [lb/(ft2·h)]
Xk : The element of the object function
y : Object elements (conversions and selectivities) z : Reactor axis coordinate [m]
Greek letters
θi : Site fraction for species [i]
ρB : Bulk density [g/m3]
σ : Liquid surface tension [dynes/cm]
Subscripts in : Inlet
i : Species
j : Reactions
k : Element of the objective function L : Tube length
M : Material
out : Outlet
P : Pressure
ref : Reference condition S : Tray spacing T : Tray type
References
1. Sun, J. and Wang, Y., “Recent Advances in Catalytic Conversion of Ethanol to Chemicals,” ACS Catal., 4, 1078-1090(2014).
2. Zhang, M. and Yu, Y., “Dehydration of Ethanol to Ethylene,”
Ind. Eng. Chem. Res., 52, 9505-9514(2013).
3. Galadima, A. and Muraza, O., “Zeolite Catalysts in Upgrading of Bioethanol to Fuels Range Hydrocarbons: A Review,” J. Ind.
Eng. Chem., 31, 1-14(2015).
4. Kochar, N. K., Merims, R. and Padia, A. S., “Ethylene from Eth- anol,” Chem. Eng. Prog., 77, 66-70(1981).
5. Mortensen, P. M., et al., “A Review of Catalytic Upgrading of Bio-oil to Engine Fuels,” Appl. Catal. A: Gen., 407, 1-19(2011).
6. Ren, T., et al., “Petrochemicals From Oil, Natural Gas, Coal and Biomass: Production Costs in 2030-2050,” Resour., Conserv.
Recycl., 53(12), 653-663(2009).
7. Yakovleva, I. S., et al., “Catalytic Dehydration of Bioethanol to Ethylene,” Catal. Ind., 8, 152-167(2016).
8. Christiansen, M. A., Mpourmpakis, G. and Vlachos, D. G., “DFT- driven Multi-site Microkinetic Modeling of Ethanol Conversion to Ethylene and Diethyl Ether on γ-Al2O3(1 1 1),” J. Catal., 323, 121-131(2015).
9. Kagyrmanova, A. P., et al., “Catalytic Dehydration of Bioethanol to Ethylene: Pilot-scale Studies and Process Simulation,” Chem. Eng. J., 176-177, 188-194(2011).
10. Kang, M., Dewilde, J. F. and Bhan, A., “Kinetics and Mecha- nism of Alcohol Dehydration on γ-Al2O3: Effects of Carbon Chain Length and Substitution,” ACS Catal., 5, 602-612(2015).
11. Roy, S., et al., “Mechanistic Study of Alcohol Dehydration on γ- Al2O3,” ACS Catal., 2, 1846-1853(2012).
12. Chiang, H. and Bhan, A., “Catalytic Consequences of Hydroxyl Group Location on the Rate and Mechanism of Parallel Dehy- dration Reactions of Ethanol Over Acidic Zeolites,” J. Catal., 271, 251-261(2010).
13. Gayubo, A. G., et al., “Kinetic Model for the Transformation of Bioethanol Into Olefins over a HZSM-5 Zeolite Treated with Alkali,” Ind. Eng. Chem. Res., 49, 10836-10844(2010).
14. Phillips, C. B. and Datta, R., “Production of Ethylene from Hydrous Ethanol on H-ZSM-5 Under Mild Conditions,” Ind. Eng. Chem.
Res., 36, 4466-4475(1997).
15. Phung, T. K. and Busca, G., “Diethyl Ether Cracking and Ethanol Dehydration: Acid Catalysis and Reaction Paths,” Chem. Eng. J., 272, 92-101(2015).
16. Reyniers, M. F. and Marin, G. B., “Experimental and Theoretical Methods in Kinetic Studies of Heterogeneously Catalyzed Reac- tions,” Annu. Rev. Chem. Biomol. Eng., 5, 563-594(2014).
17. DeWilde, J. F., et al., “Kinetics and Mechanism of Ethanol Dehydra- tion on γ-Al2O3: The Critical Role of Dimer Inhibition,” ACS Catal., 3, 798-807(2013).
18. DeWilde, J. F. and Bhan, A., “Kinetics and Site Requirements of Ether Disproportionation on γ-Al2O3,” Appl. Catal. A: Gen., 502, 361-369(2015).
19. Taarning, E., et al., “Zeolite-catalyzed Biomass Conversion to Fuels and Chemicals,” Energy Environ. Sci., 4(3), 793-804(2011).
20. Gayubo, A. G., et al., “Kinetic Modelling of the Transformation of Aqueous Ethanol into Hydrocarbons on a HZSM-5 Zeolite,”
Ind. Eng. Chem. Res., 40, 3467-3474(2001).
21. Alexopoulos, K., et al., “DFT-based Microkinetic Modeling of Ethanol Dehydration in H-ZSM-5,” J. Catal., 339, 173-185(2016).
22. Haro, P., Ollero, P. and Trippe, F., “Technoeconomic Assess- ment of Potential Processes for Bio-ethylene Production,” Fuel Process. Technol., 114, 35-48(2013).
23. Becerra, J., Figueredo, M. and Cobo, M., “Thermodynamic and Economic Assessment of the Production of Light Olefins from Bioethanol,” J. Environ. Chem. Eng., 5(2), 1554-1564(2017).
24. Jernberg, J., et al., Ethanol Dehydration to Green Ethylene.
2015, Lund: Lund University.
25. Cameron, G., et al., Process Design for the Production of Eth- ylene from Ethanol. 2012, Philadelphia, PA: University of Penn- sylvania.
26. Seo, J.-H., et al., “Influence of Binder on Fe-based Extrudate as Fischer-Tropsch Catalysts,” Korean Chem. Eng. Res., 49(6), 726- 731(2011).
27. Jasra, R. V., et al., “Effect of Clay Binder on Sorption and Catalytic Properties of Zeolite Pellets,” Ind. Eng. Chem. Res., 42(14), 3263-3272(2003).
28. Fogler, H. S., Elements of Chemical Reaction Engineering. 1999, New Jersey: Prentice-Hall.
29. Boudart, M., “Two-step Catalytic Reactions,” AlChE J., 18(3), 465-478(1972).
30. Fuller, E. N., Schettler, P. D. and Giddings, J. C., “New Method for Prediction of Binary Gas-phase Diffusion Coefficients,” Ind.
Eng. Chem., 58(5), 18-27(1966).
31. Seider, W. D., et al., Product and Process Design Principles:
Synthesis, Analysis and Design. 2008, New York, NY: John Wiley
& Sons.
32. Sinnott, R. K., Chemical Engineering Design. Vol. 6. 2005, New York, NY: Elsevier. 1056.
33. Hall, S., Rules of Thumb for Chemical Engineers. 2012, Oxford, UK: Butterworth-Heinemann.
34. Douglas, J. M., Conceptual Design of Chemical Processes. 1988, New York, NY: McGraw-Hill.
35. Aguayo, A. T., et al., “Catalyst Deactivation by Coke in the Transformation of Aqueous Ethanol into Hydrocarbons. Kinetic Modeling and Acidity Deterioration of the Catalyst,” Ind. Eng.
Chem. Res., 41, 4216-4224(2002).
36. Gayubo, A. G., et al., “Kinetic Modelling for the Transformation of Bioethanol Into Olefins on a Hydrothermally Stable Ni-HZSM-5 Catalyst Considering the Deactivation by Coke,” Chem. Eng. J., 167, 262-277(2011).
37. Gayubo, A. G., et al., “Role of Water in the Kinetic Modeling of Methanol Transformation into Hydrocarbons on HZSM-5 Zeo- lite,” Chem. Eng. Commun., 191, 944-967(2004).
38. Campesi, M. A., et al., “Combustion of Volatile Organic Com- pounds on a MnCu Catalyst: A Kinetic Study,” Catal. Today, 176(1), 225-228(2011).
39. Nowicki, L., Ledakowicz, S. and Bukur, D. B., “Hydrocarbon Selectivity Model for the Slurry Phase Fischer-tropsch Synthe- sis on Precipitated Iron Catalysts,” Chem. Eng. Sci., 56(3), 1175- 1180(2001).
40. Todic, B., et al., “Kinetic model of Fischer-Tropsch synthesis in a slurry reactor on Co-Re/Al2O3 catalyst,” Ind. Eng. Chem. Res., 52(2), 669-679(2013).
41. Yang, J., et al., “Detailed kinetics of Fischer-Tropsch synthesis on an industrial Fe-Mn catalyst,” Ind. Eng. Chem. Res., 42(21), 5066-5090(2003).
42. Lim, H. W., et al., “Optimization of Methanol Synthesis Reac- tion on Cu/ZnO/Al2O3/ZrO2 Catalyst Using Genetic Algorithm:
Maximization of the Synergetic Effect by the Optimal CO2 Frac- tion,” Korean J. Chem. Eng., 27(6), 1760-1767(2010).
43. Park, N., et al., “Modeling and Analysis of a Methanol Synthe- sis Process Using a Mixed Reforming Reactor: Perspective on Methanol Production and CO2 Utilization,” Fuel, 129, 163-172 (2014).
44. Wang, F., et al., “Coking Behavior of a Submicron MFI Cata- lyst During Ethanol Dehydration to Ethylene in a Pilot-scale Fixed-bed Reactor,” Appl. Catal. A: Gen., 393, 161-170(2011).
45. Hong Kong Boilers and Pressure Vessels Authority, Code of Practice for Thermal Oil Heaters. 2008, Hong Kong: Hong Kong Labour Department.
46. Couper, J. R., Chemical Process Equipment: Selection and Design.
1990, Amsterdam Boston: Elsevier. 755.
47. Beste, A. and Overbury, S. H., “Pathways for Ethanol Dehydro- genation and Dehydration Catalyzed by Ceria (111) and (100) Surfaces,” J. Phys. Chem. C, 119, 2447-2455(2015).
48. Guo, S., et al., “Simulation of Adsorption, Diffusion, and Per- meability of Water and Ethanol in NaA Zeolite Membranes,” J.
Membrane Sci., 376(1-2), 40-49(2011).