Received:August 22, 2016, Revised:September 20, 2016, Accepted:September 21, 2016
Corresponding to:Young Ho Lee, Division of Rheumatology, Department of Internal Medicine, Korea University Anam Hospital, Korea University College of Medicine, 73 Inchon-ro, Seongbuk-gu, Seoul 02841, Korea. E-mail:[email protected]
pISSN: 2093-940X, eISSN: 2233-4718
Copyright ⓒ 2016 by The Korean College of Rheumatology. All rights reserved.
This is a Free Access article, which permits unrestricted non-commerical use, distribution, and reproduction in any medium, provided the original work is properly cited.
Association between Sugar-Sweetened Beverage Consumption and the Risk of Gout: A Meta-Analysis
Young Ho Lee, Gwan Gyu Song
Division of Rheumatology, Department of Internal Medicine, Korea University Anam Hospital, Korea University College of Medicine, Seoul, Korea
Objective. The aim of this study was to analyze published data for an association between consumption of sugar sweetened beverages (SSBs) and the development of gout. Methods. We performed a meta-analysis to examine the highest and lowest cate- gories of SSB consumption in relation to risk of gout. Results. Three studies including 2,606 gout patients among 134,008 partic- ipants were included. Meta-analysis revealed a significant association between SSB consumption and gout risk (relative risk [RR]=1.986, 95% confidence interval [CI]=1.447∼2.725, p=2.2×10⁻⁵). Stratification by ethnicity showed a significant asso- ciation between SSB consumption and gout risk in ethnic Europeans, but not in Polynesians (RR=2.110, 95% CI=1.470∼
2.725, p=5.1×10⁻⁵; RR=1.624, 95% CI=0.842∼3.135, p=0.148, respectively). SSB consumption and gout risk were asso- ciated in original data and imputed data, for both men and women, regardless of data type and sex. The association between the highest SSB consumption group and gout was stronger than the association between the middle group and gout, indicating a dose-response gradient (RR=1.986, 95% CI=1.447∼2.725, p<2.2×10⁻⁵ vs. RR=1.260, 95% CI=1.043∼1.522, p<0.016).
Conclusion. This meta-analysis of 134,008 participants demonstrates that SSB consumption is associated with an elevated risk of gout development, particularly in the ethnic European population. Available evidence indicates a dose-response gradient of the relationship between SSB consumption and gout risk. (J Rheum Dis 2016;23:304-310)
Key Words. Sugar-sweetened beverages, Gout, Risk
INTRODUCTION
Gout is an inflammatory disorder characterized by hy- peruricemia and urate crystal deposition, resulting in epi- sodic gout flares, gouty arthropathy, tophi, and ur- olithiasis [1]. The primary cause of gout is hyperuricemia due to excess urate production or impaired renal ex- cretion of uric acid. Increased levels of hyperuricemia cor- relate with greater incidence of gouty arthritis and uric acid urolithiasis [2].
Sugar-sweetened beverages (SSBs) are any beverage with added sugar, which includes soft drinks (soda), fruit drinks, iced tea, and energy and vitamin water drinks.
Consumption of SSBs continues to increase worldwide due to the influence of Western lifestyle factors, and is a worldwide health concern [3]. SSBs contain low levels of
purine, but they include large amounts of fructose, the only carbohydrate known to increase uric acid levels [4].
Fructose induces uric acid production by increasing deg- radation of adenosine triphosphate (ATP) to adenosine monophosphate (AMP), which, in turn, induces urate production as a uric acid precursor in the liver [5].
The substantial increase in SSB consumption is asso- ciated with hyperuricemia [6], which is recognized as the most important risk factor for gout. Several studies inves- tigated whether SSB consumption is associated with gout development [7-9]. However, the role of SSBs in the de- velopment of gout has not been quantitatively reviewed.
The aim of the present study was to perform a meta-anal- ysis to summarize the evidence for a relationship between SSB consumption and gout development [10-12].
MATERIALS AND METHODS
Identification of eligible studies and data extraction We performed a literature search for studies investigat- ing the impact of SSB intake on the development of gout using PubMed, Embase, and Cochrane databases to iden- tify articles (up to February 2016). The following key words and subject terms were used: “sugar-sweetened beverages” (sugar-sweetened OR soda OR sugar OR soft drinks OR fructose) AND gout. All references cited by ar- ticles identified using the search terms were also re- viewed to identify additional studies not indexed by the above-mentioned electronic databases. No restrictions were placed on language, ethnicity, or geographical area.
Studies were considered eligible if they met the following criteria: (i) examined the association between SSB con- sumption and gout incidence, (ii) were original epi- demiological studies with a prospective or cross-sectional design, (iii) reported the relative risks (RRs) or odds ra- tios (ORs) with 95% confidence intervals (CIs) for high- est versus lowest category of SSB intake. The following studies were excluded: (i) reports containing overlapping data, and (ii) reviews and case reports. Data on methods and results were extracted from original studies by two independent reviewers. Discrepancies between the re- viewers were resolved by consensus. The meta-analysis was conducted in accordance with preferred reporting items for systematic reviews and meta-analyses (PRISMA) guidelines [13]. The following information was extracted from each study: first author, year of pub- lication, country where the study was performed, eth- nicity of the study population, study design, number of cases and total, age, sex, disease duration, SSB con- sumption categories, follow-up period, RRs or ORs with 95% CIs for highest, middle, and lowest categories of SSB consumption, and variables used in multivariate adjustments. If the OR was reported, we calculated the RR using a statistical formula [14]. The quality of each study was scored based on the Newcastle–Ottawa Scale [15]. Studies were evaluated based on three domains as follows: the selection of study groups (0∼4 points), com- parability of groups (0∼2 points), and ascertainment of exposure (0∼3 points). The highest score is 9, and scores ranging from 6∼9 range were considered to indicate high methodological quality.
Evaluation of statistical associations
We performed a meta-analysis on the highest versus
lowest SSB intake groups. Point estimates of RR and 95%
CI were estimated for each study. Any variations and het- erogeneity within and between studies were assessed us- ing Cochrane’s Q-statistics [15], and the heterogeneity test was used to assess the null hypothesis that all studies evaluated the same effect. When the significant Q-sta- tistic (p<0.10) indicated heterogeneity across studies, the random effects model was used for meta-analysis.
The random effects model assumes that different studies may estimate different underlying effects and considers both intra- and inter-study variations [16]. In the present study, we used the random effects model because hetero- geneity was present in most analyses. The effect of heter- ogeneity was quantified by using the formula:
I2=100%×(Q-df)/Q [17]. I2 provides a measure of the de- gree of inconsistency between studies and determines whether the percentage total variation across studies is due to heterogeneity rather than chance. I2 values range between 0% and 100%, and I2 values of 25%, 50%, and 75% are referred to as low, moderate, and high estimates, respectively [18]. Statistical calculations were performed using a Comprehensive Meta-Analysis computer pro- gram version 2.0 (Biosta, Englewood, NJ, USA).
Evaluation of subgroup analysis and publication bias We performed subgroup analysis according to ethnicity, study design, data type, sex, and category, and a sensi- tivity test was performed to assess the influence of each individual study on the pooled odds ratio by omitting each study individually. Funnel plots are often used to de- tect publication bias, but require studies with different sample sizes that involve subjective judgments.
Therefore, we evaluated publication bias using Egger’s linear regression test [19], which measures funnel plot asymmetry on a natural logarithm scale of ORs.
RESULTS
Studies included in the meta-analysis
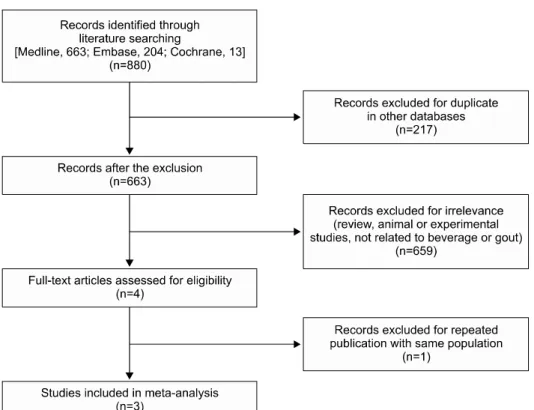
Eight hundred and eighty articles were identified using electronic databases and manual searches, and 4 were se- lected for a full-text review on the basis of the title and ab- stract details [7-9,20]. One study of the four studies was excluded due to a repeated publication with same pop- ulation [20]. Thus, three studies were included [7-9]
(Figure 1). One of the eligible studies contained data on four different groups, and these were treated in- dependently [7]. Thus, 6 comparisons including 3 cohort
Figure 1. Flow chart for the study selection.
and 3 cross-case–control studies were considered in the meta-analysis, which included 2,606 gout patients among 134,008 participants, consisting of 4 Caucasian and 2 Polynesian populations (Table 1). Study quality was 8 for all included studies, indicating a high study quality.
Definitions of the highest, middle, and lowest SSB intake in each study are as follows: ≥5.0 servings/d, 2.0 to 2.99 servings/d, 0 serving/d in Batt et al. study [7], and ≥2 servings/d, 5 to 6 servings/wk, <1 serving/mo, re- spectively in Choi et al. study 2010 [8] and Choi et al.
study 2008 [9]. Table 2 summarizes selected character- istics of the included studies.
1) Association between SSB consumption and gout risk Meta-analysis of 6 studies revealed a significant associa- tion between SSB consumption and gout risk (RR=1.986, 95% CI=1.447∼2.725, p=2.2×10⁻⁵) (Table 2, Figure 2).
Stratification by ethnicity showed a significant associa- tion between SSB consumption and gout risk in Caucasians, but not in Polynesians (RR=2.110, 95%
CI=1.470∼2.725, p=5.1×10⁻⁵; RR=1.624, 95%
CI=0.842∼3.135, p=0.148, respectively) (Table 2, Figure 2). Meta-analysis showed a significant association be- tween SSB consumption and gout risk in cohort studies, but not in cross-sectional studies (Table 2). However, meta-analysis by data type and sex showed a significant
association between SSB consumption and gout risk in original data and imputed data, and in both men and women (Table 2).
2) Dose-response association between SSB consumption and gout risk
To estimate the dose–response relationship, we meas- ured the association between the middle group of SSB consumption and gout incidence as well as the associa- tion between the highest group of SSB consumption and gout incidence. The association between the highest group and gout was stronger than the association be- tween the middle group and gout, indicating a dose-re- sponse gradient (RR=1.986, 95% CI=1.447∼2.725, p=2.2×10⁻⁵ vs. RR=1.260, 95% CI=1.043∼1.522, p=0.016) (Table 2). Thus, increased SSB consumption and gout risk followed a dose–response relationship.
Heterogeneity, sensitivity test, and publication bias Between-study heterogeneities were not found during meta-analyses of SSB consumption and gout risk (Table 2).
Sensitivity analysis showed that no individual study signifi cantly affected the results, indicating robust results of this meta-analysis. Publication bias results in a disproportio- nate number of positive studies, and poses a problem for meta-analyses. Egger’s regression test showed no evidence
Table 1. Characteristics of the individual studies included in the meta-analysis Study [Ref]CountryEthnicitySubjects’ age (yr), range Sex (%), maleStudy periodStudy designCase (n)Total (n)
RR (95% CI) for highest vs. lowest intakesAdjustment for confoundersStudy quality Batt-1, 2014 [7]USACaucasian23∼9477.82006∼2011Cross-sectional4125922.38* (0.64∼8.84), Ptrend=0.020 (≥5 servings/d vs. 0)Age, sex, BMI, alcohol (continuous variable), fruit intake (continuous variable), kidney disease
8 Batt-2, 2014 [7]USAPolynesian23∼8180.32006∼2011Cross-sectional1905021.44* (0.59∼3.53), Ptrend=0.011 (≥5 servings/d vs. 0)Age, sex, BMI, alcohol (continuous variable), fruit intake (continuous variable), kidney disease
8 Batt-3, 2014 [7]USAPolynesian18∼8187.92006∼2011Cross-sectional3235402.17* (0.98∼4.77), Ptrend=0.050 (≥5 servings/d vs. 0)Age, sex, BMI, alcohol (continuous variable), fruit intake (continuous variable), kidney disease
8 Batt-4, 2014 [7]USACaucasian45∼6575.0NDCohort1487,0752.31* (0.65∼8.19), Ptrend=0.026 (≥5 servings/d vs. 0)Age, sex, BMI, alcohol (continuous variable), fruit intake (continuous variable), kidney disease, high blood pressure and relatedness
8 Choi, 2010 [8]USACaucasian† 30∼5501984∼2006Cohort77878,9061.85 (1.08∼3.16), Ptrend=0.002 (≥2 servings/d vs. 1</mo)
Age, total energy intake, BMI, menopause status, use of hormonal therapy, diuretic use, history of hypertension, and intake of alcohol, total meats, seafood, dairy products, total vitamin C, SSB, and the beverages
8 Choi, 2008 [9]CanadaCaucasian‡ 40∼751001986∼1998Cohort75546,3932.39 (1.34∼4.26), Ptrend<0.001 (≥2 servings/d vs. 1</mo)
Age, total energy intake, body mass index, diuretic use, history of hypertension, and history of chronic renal failure; intake of alcohol, total meats, seafood, purine rich vegetables, dairy foods, and total vitamin C; and sweetened soft drinks, diet soft drinks, sweetened cola, and other sweetened soft drinks 8 Ref : Reference, RR: relative risk, CI: confidence interval, SSB: sugar-sweetened beverage, ND: not determined, BMI: body mass index. *Odds ratio, † 95%: Caucasian, ‡ 91%: Caucasian.
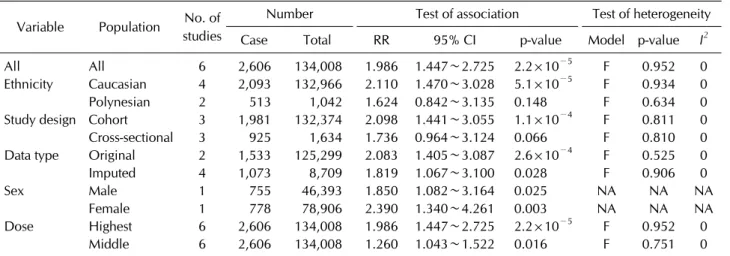
Table 2. Meta-analysis of studies on sugar sweetened beverages consumption and risk of gout Variable Population No. of
studies
Number Test of association Test of heterogeneity
Case Total RR 95% CI p-value Model p-value I2
All All 6 2,606 134,008 1.986 1.447∼2.725 2.2×10⁻⁵ F 0.952 0
Ethnicity Caucasian 4 2,093 132,966 2.110 1.470∼3.028 5.1×10⁻⁵ F 0.934 0
Polynesian 2 513 1,042 1.624 0.842∼3.135 0.148 F 0.634 0
Study design Cohort 3 1,981 132,374 2.098 1.441∼3.055 1.1×10⁻⁴ F 0.811 0
Cross-sectional 3 925 1,634 1.736 0.964∼3.124 0.066 F 0.810 0
Data type Original 2 1,533 125,299 2.083 1.405∼3.087 2.6×10⁻⁴ F 0.525 0
Imputed 4 1,073 8,709 1.819 1.067∼3.100 0.028 F 0.906 0
Sex Male 1 755 46,393 1.850 1.082∼3.164 0.025 NA NA NA
Female 1 778 78,906 2.390 1.340∼4.261 0.003 NA NA NA
Dose Highest 6 2,606 134,008 1.986 1.447∼2.725 2.2×10⁻⁵ F 0.952 0
Middle 6 2,606 134,008 1.260 1.043∼1.522 0.016 F 0.751 0
RR: relative risk, CI: confidence interval, F: fixed effects model, NA: not available.
Figure 2. Meta-analysis of the as- sociation between sugar sweet- ened beverages (SSBs) con- sumption and gout risk for the highest versus lowest groups of SSBs intake in the overall group (A) and each ethnic group (B).
CI: confidence interval.
of publication bias in this meta-analysis of the relation- ship between total SSB intake and incidence of gout (Egger’s regression test p-values=0.845), and the funnel plot suggested symmetry, indicating no evidence of a pub- lication bias (Figure 3).
DISCUSSION
In the present study, we assessed the risk of gout asso- ciated with SSB consumption by combining data from 3
cohort and 3 cross-sectional studies, including a total of 2,606 gout patients among 134,008 participants. This meta-analysis revealed that SSB consumption sig- nificantly affected the incidence of gout. Compared to the lowest SSB intake group, individuals in the highest intake group had a 98.6% greater risk of gout development.
Furthermore, there was a dose-response gradient to the relationship between SSB consumption and gout risk.
Stratification by ethnicity showed a significant associa- tion between SSB consumption and gout risk in
Figure 3. Funnel plot of studies that examined the association between sugar sweetened beverages consumption and gout risk (Egger’s regression test p-value=0.845). SE: standard error.
Caucasians, but not in Polynesians. It is unclear why a sig- nificant difference was observed in Caucasians but not in Polynesians. However, it may be explained by ethnic dif- ference, and/or statistical power due to sample size.
Actually, both populations showed the same direction of the ORs of the association, but the sample size was huge in Caucasians (n=132,966) compared to that in Polynesians (n=1,042). Thus, statistical power rather than ethnic difference may contribute to the difference in the association between Caucasians and Polynesians.
Meta-analysis stratified by study design indicated that SSB intake increased gout incidence in the cohort studies, but not in the cross-sectional studies. The reason why a significant difference was observed in cohort studies but not in cross-sectional studies could be explained by study design, and/or also statistical power due to sample size (cohort studies, n=132,374 vs. cross-sectional studies, n=1,634). Observational cohort studies may be the best available epidemiological evidence, because human ex- perimental studies have not yet been conducted, and well-conducted cohort studies were more likely to mini- mize recall and selection bias, which frequently confound cross-sectional or case-control studies [21]. The present analysis had a much larger statistical power to assess the association between SSB consumption and risk of gout by combining cohort studies with cross-sectional studies.
The plausible mechanism of our finding is that fructose contained in SSBs increases serum uric acid levels, result- ing in increased risk of gout development [6]. SSBs are a major source of fructose; fructose induces uric acid pro- duction by increasing ATP degradation to AMP, which is a precursor of uric acid and serves as a substrate for uric
acid production [5]. Fructose also indirectly increases the level of serum uric acid by increasing insulin resistance and circulating insulin levels [22].
Consumption of SSBs continues to increase worldwide [22]. The rise in SSB intake has raised health concerns, because SSB consumption is associated with an increased risk of hypertension, diabetes, obesity, and metabolic syndrome [21,23-25]. Conventional dietary recom- mendations for gout have focused on restriction of purine intake [25]. However, low purine diets often include a high amount of carbohydrates, such as fructose-rich foods [4]. Thus the conventional low purine diet may re- sult in fructose intake that could potentially worsen the risk of gout attacks. Because evidence shows that fructose substantially increases the risk of gout, reduction of SSB consumption should be a focus of gout management [6].
The present analysis has limitations that require consideration. First, confounders may have influenced this meta-analysis. Heterogeneity and confounding fac- tors might have distorted the results, although no hetero- geneity was found and several confounding factors were adjusted. Second, literature on the effect of SSB con- sumption on gout incidence is limited, and only a few studies were included in our meta-analysis. Third, our re- sults may be affected by misclassification of SSB consumption. SSB intake was mostly assessed using number of cups of SSB consumed daily. However, cup size or SSB components may vary considerably between the different studies. The classification of SSB consumption is difficult to evaluate, which directly weakens the strength of the observed relationship. Fourth, the con- sumption levels of the highest and lowest groups differed among studies. For example, two cohort studies used ≥2 servings/d as the highest group compared with <1 serv- ing/mo as the lowest group, while studies from Batt et al.
[7] compared the highest group of ≥5 servings/d with lowest group of no SSB intake. Fifth, our findings were dominated by Caucasian studies and thus might not be generalizable to other ethnic groups. Sixth, whether the difference in the content of fructose contained in SSB or other additives affected the study results needs to be considered. However, some studies presented the con- tent of fructose contained in SSB or other additives, but others did not give the data. Thus, further meta-analysis could not be performed due to the limited data.
CONCLUSION
This meta-analysis of 134,008 participants demon- strates that SSB consumption is associated with an ele- vated risk of gout development, especially in Caucasians.
Furthermore, there is a dose-response effect of the rela- tionship between SSB consumption and gout risk. Future studies are necessary to elucidate the effect of SSBs on gout development to determine if SSB intake directly con- tributes to the pathogenesis of gout in various ethnic groups.
CONFLICT OF INTEREST
No potential conflict of interest relevant to this article was reported.
REFERENCES
1. Wortmann RL. Gout and hyperuricemia. Curr Opin Rheumatol 2002;14:281-6.
2. Terkeltaub RA. Clinical practice. Gout. N Engl J Med 2003;349:1647-55.
3. Popkin BM. Patterns of beverage use across the lifecycle.
Physiol Behav 2010;100:4-9.
4. Nakagawa T, Tuttle KR, Short RA, Johnson RJ. Hypothesis:
fructose-induced hyperuricemia as a causal mechanism for the epidemic of the metabolic syndrome. Nat Clin Pract Nephrol 2005;1:80-6.
5. Choi HK, Mount DB, Reginato AM. Pathogenesis of gout.
Ann Intern Med 2005;143:499-516.
6. Rho YH, Zhu Y, Choi HK. The epidemiology of uric acid and fructose. Semin Nephrol 2011;31:410-9.
7. Batt C, Phipps-Green AJ, Black MA, Cadzow M, Merriman ME, Topless R, et al. Sugar-sweetened beverage con- sumption: a risk factor for prevalent gout with SLC2A9 gen- otype-specific effects on serum urate and risk of gout. Ann Rheum Dis 2014;73:2101-6.
8. Choi HK, Willett W, Curhan G. Fructose-rich beverages and risk of gout in women. JAMA 2010;304:2270-8.
9. Choi HK, Curhan G. Soft drinks, fructose consumption, and the risk of gout in men: prospective cohort study. BMJ 2008;336:309-12.
10. Lee YH, Harley JB, Nath SK. Meta-analysis of TNF-alpha promoter -308 A/G polymorphism and SLE susceptibility.
Eur J Hum Genet 2006;14:364-71.
11. Lee YH, Rho YH, Choi SJ, Ji JD, Song GG. PADI4 poly- morphisms and rheumatoid arthritis susceptibility: a
meta-analysis. Rheumatol Int 2007;27:827-33.
12. Nath SK, Harley JB, Lee YH. Polymorphisms of complement receptor 1 and interleukin-10 genes and systemic lupus er- ythematosus: a meta-analysis. Hum Genet 2005;118:225-34.
13. Zhang J, Yu KF. What's the relative risk? A method of cor- recting the odds ratio in cohort studies of common outcomes. JAMA 1998;280:1690-1.
14. Wells GA, Shea B, O’connell D, Peterson J, Welch V, Losos M, et al. The Newcastle-Ottawa Scale (NOS) for assessing the quality of nonrandomised studies in meta-analyses [Internet]. Ottawa: Ottawa Hospital Research Institute, 2011 [cited 2016]. Available from: http://www.ohri.- ca/programs/clinical_epidemiology/oxford.asp.
15. Davey P, Grainger D, MacMillan J, Rajan N, Aristides M, Gliksman M. Clinical outcomes with insulin lispro com- pared with human regular insulin: a meta-analysis. Clin Ther 1997;19:656-74.
16. DerSimonian R, Laird N. Meta-analysis in clinical trials.
Control Clin Trials 1986;7:177-88.
17. Jadad AR, Moore RA, Carroll D, Jenkinson C, Reynolds DJ, Gavaghan DJ, et al. Assessing the quality of reports of randomized clinical trials: is blinding necessary? Control Clin Trials 1996;17:1-12.
18. Higgins JP, Thompson SG. Quantifying heterogeneity in a meta-analysis. Stat Med 2002;21:1539-58.
19. Egger M, Davey Smith G, Schneider M, Minder C. Bias in meta-analysis detected by a simple, graphical test. BMJ 1997;315:629-34.
20. Dalbeth N, Phipps-Green A, House ME, Gamble GD, Horne A, Stamp LK, et al. Body mass index modulates the relation- ship of sugar-sweetened beverage intake with serum urate concentrations and gout. Arthritis Res Ther 2015;17:263.
21. Cox CL, Stanhope KL, Schwarz JM, Graham JL, Hatcher B, Griffen SC, et al. Consumption of fructose- but not glu- cose-sweetened beverages for 10 weeks increases circulat- ing concentrations of uric acid, retinol binding protein-4, and gamma-glutamyl transferase activity in overweight/
obese humans. Nutr Metab (Lond) 2012;9:68.
22. Jayalath VH, de Souza RJ, Ha V, Mirrahimi A, Blanco-Mejia S, Di Buono M, et al. Sugar-sweetened beverage con- sumption and incident hypertension: a systematic review and meta-analysis of prospective cohorts. Am J Clin Nutr 2015;102:914-21.
23. Malik VS, Popkin BM, Bray GA, Després JP, Willett WC, Hu FB. Sugar-sweetened beverages and risk of metabolic syn- drome and type 2 diabetes: a meta-analysis. Diabetes Care 2010;33:2477-83.
24. Massougbodji J, Le Bodo Y, Fratu R, De Wals P. Reviews ex- amining sugar-sweetened beverages and body weight: cor- relates of their quality and conclusions. Am J Clin Nutr 2014;99:1096-104.
25. Emmerson BT. The management of gout. N Engl J Med 1996;334:445-51.
![Table 1. Characteristics of the individual studies included in the meta-analysis Study [Ref]CountryEthnicitySubjects’age (yr), rangeSex (%), maleStudy periodStudy designCase(n)Total(n)](https://thumb-ap.123doks.com/thumbv2/123dokinfo/5319507.166994/4.892.147.736.125.1148/characteristics-individual-included-analysis-countryethnicitysubjects-malestudy-periodstudy-designcase.webp)