The Association between the Low Muscle Mass and Osteoporosis in Elderly Korean People
The purpose of this study was to predict osteoporosis risk as decreasing muscle mass and to declare the cut-off value of low muscle mass in an elderly Korean population. This study was based on data from the 2008-2010 Korea National Health and Nutritional Examination Surveys (KNHANES). The subjects included 1,308 men and 1,171 women over 65 yr. Bone mineral density (BMD) and appendicular skeletal muscle (ASM) were measured by dual energy X-ray absorptiometry (DXA), and appendicular skeletal muscle was adjusted by height as a marker of sarcopenia. After confirming the correlation between low muscle mass and BMD, the best cut-off value of muscle mass to estimate osteoporosis was suggested through the receiver operating characteristic (ROC) curve. For both men and women, BMD correlated positively with low muscle mass when ASM/Ht2 was used as a marker for sarcopenia. The ROC curve showed that ASM/Ht2 was the best marker for osteoporosis at a cut-off value of 6.85 kg/m2 for men and 5.96 kg/m2 for women. When these cut-off values were used to determine sarcopenia, the risk of osteoporosis increased 4.14 times in men and 1.88 times in women. In particular, men (OR 2.12) with sarcopenia were more greatly affected than women (OR 1.15), even after adjusting for osteoporosis risk factors. In elderly Korean people, sarcopenia is positively correlated with BMD and there is a strong correlation between sarcopenia and osteoporosis with risk of bone fracture.
Keywords: Osteoporosis; Sarcopenia; Korea; KNHANES; Elderly Population Sunyoung Kim,1,2 Chang Won Won,1
Byung Sung Kim,1 Hyun Rim Choi,1 and Min Young Moon1
1Department of Family Medicine, College of Medicine, Kyung Hee University, Seoul; 2Department of Medicine, Graduate School Ewha Womans University, Seoul, Korea
Received: 23 December 2013 Accepted: 24 April 2014 Address for Correspondence:
Chang Won Won, MD
Department of Family Medicine, Kyung Hee University Hospital, 23 Kyunghee dae-ro, Dongdaemun-gu, Seoul 130-872, Korea Tel: +82.2-958-8697, Fax: +82.2-958-8699
E-mail: [email protected]
Funding: There is no research grant or funding with respect to this manuscript.
http://dx.doi.org/10.3346/jkms.2014.29.7.995 • J Korean Med Sci 2014; 29: 995-1000
INTRODUCTION
According to the 2010 data from the Statistics Korea, the elderly population in Korea increased 24.3% from 2005 to 2010, which was 12.2 times greater than the increase in the total population (2.0%) during the same time period (1, 2). With this significant increase in the elderly population, it is important that increas
ing attention be given to help maintain their physical and social functioning while minimizing chronic disease and disability to enhance their quality of life.
Decreased muscle mass and bone mineral density are signif
icant changes that occur with aging, and these are often associ
ated with an inability to adapt to external stress resulting in falls, trauma, functional disability, increased hospitalization, decreas
ed quality of life, and increased mortality (35). Thus, diagnos
ing osteoporosis and sarcopenia is not only important clinical
ly, but also has significant public and social ramifications. De
termining the relationship between osteoporosis and sarcope
nia may help maintain musculoskeletal function and prevent fractures associated with accidental falls.
The diagnostic criteria have already been established for os
teoporosis (5), but there is still controversy regarding the diag
nostic criteria and markers for sarcopenia. Early studies by Baum
gartner et al. suggested defining sarcopenia based on appen
dicular skeletal muscle divided by height squared (Ht2) (7). Jans
sen et al. used biochemical impedance analysis (BIA) to mea
sure total muscle mass and divided this mass by weight to de
fine sarcopenia (4). In recent studies, sarcopenia is defined as a systemic continuous decrease in skeletal muscle strength and muscle mass so that the diagnosis of sarcopenia must be sup
ported by decreased muscle mass and functional muscle strength (8). Until now, many studies of muscle mass and BMD have been carried out (911), and they showed that low muscle mass is correlated with low BMD. Unfortunately, their study popula
tions were inconsistent and their definitions of sarcopenia dif
ferent. In our study, by presenting a cutoff value of the muscle loss that can predict osteoporosis in Korean elderly individuals, we attempted to identify the relationship between muscle loss and osteoporosis.
MATERIALS AND METHODS Subjects
This study is based on data obtained in the second and third years (20082009) of the Korea National Health and Nutritional Examination Survey (KNHANES) IV and the first year (2010) of
the KNHANES V (2). The KNHANES is a crosssectional study and has been conducted periodically since 1998 to assess the health and nutritional status of the civilian noninstitutional
ized population of Korea and has generated nationwide and representative statistical data by selfadministered question
naires on health status, health behaviors, and nutritional status.
Data was collected via household units and selected based on a stratified, multistage probability sampling design. The selection was made from sampling units based on the geographical area, gender, and age using household registries. The details of the KNHANES IV and V have been previously described (12, 13). A total of 4,772 individuals aged ≥ 65 yr participated. Of the 4,772 participants, we excluded individuals who did not have DXA results (n = 1,452) and those with a history of stroke, coronary artery disease, thyroid disease, lung disease, liver and renal dis
ease, and any cancers and those taking medications likely to af
fect bone or soft tissue metabolism, such as thyroid hormone, bisphosphonates, SERM, or weight controlling drugs (n = 841).
The exclusion criteria were aimed to ensure selection of healthy participants and to minimize the confounding effects on mus
cle mass. The present study included 2,479 elderly participants (1,308 men and 1,171 women).
Measurement of bone density and appendicular skeletal muscle mass
All participants underwent the DXA (DISCOVERYW fanbeam densitometer; Hologic Inc., MA, USA) for assessment of BMD and body composition. Standardized daily quality control of these DXA in instruments was performed using spine phantom provided by the manufacturer before the study commenced.
The BMD (g/cm2 or Tscore) of the whole body, femoral neck, and lumbar spine (L14) were analyzed. The diagnosis of osteo
porosis was made using the WHO Tscore criteria (Tscore < 2.5), and the maximum BMD value for Japanese patients was used as a reference due to the lack of established diagnostic criteria for Koreans (14, 15). Appendicular skeletal muscle (ASM) mass was calculated as the sum of muscle mass in arms and legs, as
suming that all nonfat and nonbone tissue is skeletal muscle (16). According to the definition proposed in previous studies, we used muscle mass indexes, the height adjusted ASM (ASM/
Ht2, kg/m2) (5, 7, 17).
Anthropometric and laboratory measurements
Body weight and height were measured to the nearest 0.1 kg and 0.1 cm, respectively. BMI was calculated as weight/height2 (kg/m2). Waist circumference was measured at the midpoint between the lower border of the rib cage and the iliac crest us
ing a nonelastic tapeline. Blood pressure was measured twice at a 5min interval on the right arm using a standard mercury sphygmomanometer (Baumanometer; Baum, Copiague, NY, USA) and recorded as an average of the two readings. Blood
samples were collected during the health examination survey.
These samples, taken from the antecubital veins, were refriger
ated immediately and transported on dry ice to the designated central testing facility, and were analyzed within 24 hr of sam
pling. Serum 25(OH)D levels were measured using a gamma counter (1470 Wizard, PerkinElmer, Turku, Finland) with a ra
dioimmunoassay (RIA) kit (DiaSorin, Stillwater, MN, USA) (2).
Statistical analysis
All data are presented as the mean ± standard error (SE) for the continuous variables or as proportion (SE) for the categorical variables. The characteristics of the participants were compared according to sex using independent sample Student’s ttests for the continuous measures and Rao scatt chisquare tests for the categorical measures. Regression analysis was applied to assess the association between various parts of the BMDs and the two indexes of low muscle mass. The receiver operating character
istic (ROC) curve analysis was performed to determine the best cutoff value of low muscle mass for indicating osteoporosis.
The areas under the ROC curve (AUC) were investigated for os
teoporosis. The ROC curve was a graph of sensitivity plotted against (1specificity) over all possible diagnostic cutoff values.
The optimal cutoff values were obtained from the maximal Youden’s index, calculated as (sensitivity+specificity1) and the best combination of sensitivity and specificity. The odds ratios (ORs) and 95% confidence intervals (CIs) were calculated by logistic analysis to confirm the impact of low muscle mass, which was based on the cutoff value for osteoporosis, after making adjustments for age, fat mass, calcium intake, vitamin D status, smoking, alcohol consumption, and physical activity. Statistical analyses were performed using the survey procedure of SAS software (version 9.2; SAS Institute, Cary, NC, USA) to account for the complex sampling design and to provide nationally rep
resentative prevalence estimates. P < 0.05 was considered sta
tistically significant.
Ethics statement
This study was approved by the institutional review board of KyungHee University Hospital, in Seoul, Korea (approval ID:
KMCIRB 141305). Informed consent was waived by the board.
RESULTS
The study population comprised 1,308 men and 1,171 women with an average age of 71.9 yr for men and 74.2 yr for women.
Height, weight, waist circumference, and muscle index were higher in men, and body fat index was higher in women. Dia
betes was more prevalent in men, and hypertension and meta
bolic syndrome were more prevalent in women (Table 1). Of the index for sarcopenia, ASM/Ht2 was positively correlated with BMD in both men and women, and adjusting for age and
Table 1. General characteristics of Korean elderly population Parameters
Mean ± SD
P value Men
(n = 1,308) Women (n = 1,171)
Age (yr) 71.9 ± 0.2 74.2 ± 0.2 < 0.001
Weight (kg) 62.8 ± 0.3 54.1 ± 0.3 < 0.001
Height (cm) 164.8 ± 0.2 150 ± 0.2 < 0.001
Body mass index (kg/m2) 23.1 ± 0.1 24 ± 0.1 < 0.001 Waist circumference (cm) 84.5 ± 0.3 83.1 ± 0.3 0.004
ASM/Weight 31 ± 0.1 24.7 ± 0.1 < 0.001
ASM/Height2 (kg/m2) 7.1 ± 0 5.9 ± 0.07 < 0.001 Total femur BMD (g/cm2) 0.878 ± 0.004 0.687 ± 0.004 < 0.001 Femoral neck BMD (g/cm2) 0.7 ± 0.004 0.542 ± 0.003 < 0.001 Lumbar spine BMD (g/cm2) 0.928 ± 0.005 0.732 ± 0.005 < 0.001 Whole body total BMD (g/cm2) 1.143 ± 0.005 0.942 ± 0.005 < 0.001 Total femur T-score -0.453 ± 0.032 -1.427 ± 0.034 < 0.001 Spine T-score -0.798 ± 0.044 -2.38 ± 0.042 < 0.001 Femoral neck T-score -1.181 ± 0.033 -2.442 ± 0.031 < 0.001 Past history (%)
Hypertension Diabetes mellitus Metabolic syndrome*
56.5 (1.8) 21.2 (1.2) 41.2 (1.8)
66.6 (1.8) 19.1 (1.6) 63.1 (1.9)
< 0.001 0.265
< 0.001 Drinking (%)
Non to moderate drinker
Heavy drinker† 33.4 (1.5)
66.6 (1.5) 71.7 (1.7) 28.9 (1.7)
< 0.001
Smoking (%) Non or ex-smoker
Current smoker 72.8 (1.5)
27.2 (1.5) 92.6 (1.1) 7.4 (1.1)
< 0.001
Exercise (%) No
Moderate to severe‡
78.0 (1.5) 22.0 (1.5)
84.7 (1.2) 15.2 (1.2)
< 0.001
25(OH)D (ng/mL) 18.4 ± 0.3 22.3 ± 0.4 < 0.001 Calcium intake (mg) 359.6 ± 21.7 482.0 ± 12.3 < 0.001
*Metabolic syndrome: three or more or the following five criteria were defined as hav- ing metabolic syndrome 1) abdominal obesity by waist circumference cut off values of ≥ 90 cm for men and ≥ 80 cm for women), 2) systolic blood pressure ≥ 130 mmHg or diastolic blood pressure ≥ 85 mmHg or on antihypertensive medication, 3) elevated fasting blood glucose ( ≥ 5.6 mM/L), 4) hypertriglyceridemia ( ≥ 1.7 mM/L), and 5) low serum HDL cholesterol ( < 1.3 mM/L in men and < 1.29 mM/L in wom- en). †Heavy drinker was defined who drank more than 30 g/day; ‡Moderate exercise was defined as strenuous physical activity performed for at least 20 min at a time at least three times a week. SD, standard deviation; ASM, appendicular skeletal muscle;
BMD, bone mineral density.
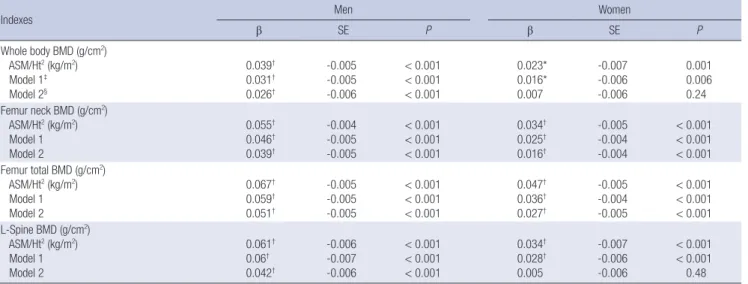
body fat, still resulted in a positive correlation (Table 2).
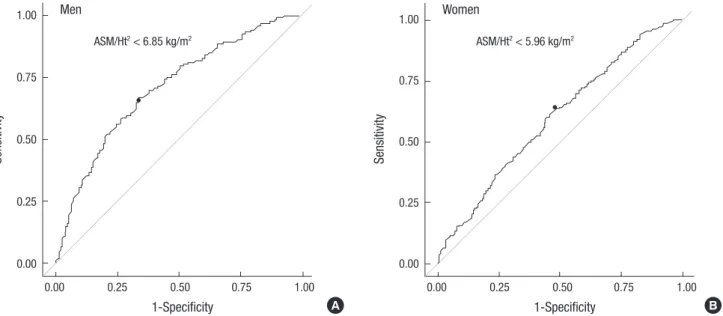
The ROC curve reflecting osteoporosis from ASM/Ht2 is shown in Fig. 1. The AUC of ASM/Ht2 for the prediction of osteoporosis was 0.705 (95% CI, 0.6790.730; P < 0.001) in men, and 0.598 (95% CI, 0.5690.627; P < 0.001) in women. The best cutoff val
ue of ASM/Ht2 for indicating osteoporosis, according to the max
imum of the Youden index, was 6.85 kg/m2 in men and 5.96 kg/
m2 in women. Sensitivity and specificity were 66.9% and 66% in men, and 62% and 53.5% in women, respectively.
Odds ratios (ORs) for the low muscle mass in relation to os
teoporosis are presented in Table 3. Both men and women sub
jects in the lower muscle mass group had increased risk for os
teoporosis (men: OR, 4.14; 95% CI, 2.676.78; P < 0.001, women:
OR, 1.88; 95% CI, 1.412.5; P < 0.001). After adjusting for osteo
porosis risk factors (age, fat mass, calcium intake, vitamin D sta
tus, smoking, alcohol consumption, and physical activity), this association remained statistically significant in men (men: OR, 2.21; 95% CI, 1.333.37; P = 0.0016, women: OR, 1.15; 95% CI, 0.81
1.65; P = 0.44) (Table 3).
DISCUSSION
In our study, using ASM/Ht2 as an index for sarcopenia, muscle mass and BMD showed a positive correlation, verifying that as muscle mass decreases, the BMD of each body part shows a lower value as well. Especially through the ROC curve, ASM/
Ht2 well reflected the risk of osteoporosis and indicated the best cutoff values (men 6.85 kg/m2, women 5.96 kg/m2) for sarco
penia. This result is similar to studies involving postmenopausal women and men concluding that there are correlations among body weight, muscle mass, and osteoporosis (10, 1820). It can be explained that body weight acts as a stress on the skeletal system to promote bone formation mechanically by stimulat
Table 2. Association of sarcopenia index and bone mineral density, stratified by sex, age and fat mass
Indexes Men Women
β SE P β SE P
Whole body BMD (g/cm2) ASM/Ht2 (kg/m2) Model 1‡ Model 2§
0.039† 0.031† 0.026†
-0.005 -0.005 -0.006
< 0.001
< 0.001
< 0.001
0.023*
0.016*
0.007
-0.007 -0.006 -0.006
0.001 0.006 0.24 Femur neck BMD (g/cm2)
ASM/Ht2 (kg/m2) Model 1 Model 2
0.055† 0.046† 0.039†
-0.004 -0.005 -0.005
< 0.001
< 0.001
< 0.001
0.034† 0.025† 0.016†
-0.005 -0.004 -0.004
< 0.001
< 0.001
< 0.001 Femur total BMD (g/cm2)
ASM/Ht2 (kg/m2) Model 1 Model 2
0.067† 0.059† 0.051†
-0.005 -0.005 -0.005
< 0.001
< 0.001
< 0.001
0.047† 0.036† 0.027†
-0.005 -0.004 -0.005
< 0.001
< 0.001
< 0.001 L-Spine BMD (g/cm2)
ASM/Ht2 (kg/m2) Model 1 Model 2
0.061† 0.06† 0.042†
-0.006 -0.007 -0.006
< 0.001
< 0.001
< 0.001
0.034† 0.028† 0.005
-0.007 -0.006 -0.006
< 0.001
< 0.001 0.48
*P < 0.05; †P < 0.001; ‡Model 1: adjusted for age; §Model 2: adjusted for age and fat mass. BMD, bone mineral density; ASM, appendicular skeletal muscle; Ht, height; Wt, weight.
Fig. 1. Receiver operating characteristic (ROC) curve of sarcopenia reflecting osteoporosis in Korean Elderly. The cut-off value of ASM/Ht2 was (A) 6.85 kg/m2 in men (area un- der the curve = 0.705; 95% CI, 0.679-0.730; P < 0.001 sensitivity 66.9%, specificity 66%), (B) 5.96 kg/m2 in women (area under the curve = 0.598; 95% CI, 0.569-0.627;
P < 0.001 sensitivity 62%, specificity 53.5%).
Sensitivity
1-Specificity
0.00 0.25 0.50 0.75 1.00 1.00
0.75
0.50
0.25
0.00
ASM/Ht2 < 6.85 kg/m2 Men
Sensitivity
1-Specificity
0.00 0.25 0.50 0.75 1.00 1.00
0.75
0.50
0.25
0.00
ASM/Ht2 < 5.96 kg/m2 Women
A B
Table 3. Odds ratios (OR) and 95% confidence intervals (CI) for osteoporosis accord- ing to cutoff value of sarcopenia index in Korean Elderly
Sarcopenia index Osteoporosis*
OR (95% CI) P value
Men
ASM/Ht2 (kg/m2) < 6.85 Model 1†
Model 2‡ Model 3§
4.14¶ (2.67-6.78) 3.85¶ (2.34-5.47) 2.63¶ (1.73-4) 2.12ll (1.33-3.37)
< 0.001
< 0.001
< 0.001 0.0016 Women
ASM/Ht2 (kg/m2) < 5.96 Model 1†
Model 2‡ Model 3§
1.88¶ (1.41-2.5) 1.77¶ (1.3-2.39) 1.31 (0.96-1.79) 1.15 (0.81-1.65)
< 0.001
< 0.001 0.08 0.44
*Osteoporosis: T-score ≤ -2.5 at femoral neck, total or lumbar spine; †Model 1: ad- justed for age; ‡Model 2: adjusted for age and fat mass; §Model 3: adjusted for age, fat mass, calcium intake, vitamin D status, smoking, alcohol consumption, physical activity; llP < 0.05; ¶P < 0.001. ASM, appendicular skeletal muscle.
ing osteocytes to increase bone density (21), and muscle mass, like fat mass may have a protective effect on bone density through hormones (22). Also, the association between greater muscle mass and greater bone density is likely to be determined by mul
tiple factors including common nutrition, life style and genes regulating size (2324).
Many studies have focused on sarcopenia since Irwin Rosen
berg first identified the condition in 1989 (25) but a precise defi
nition, measurement method, and index of sarcopenia have yet to be established. Baumgartner et al. measured ASM with DXA and defined sarcopenia as less than 2 standard deviations from the mean of ASM/Ht2 in a young population (7).
In Korea, interest in sarcopenia has increased, and numer
ous studies have been carried out. Kim et al.(26) studied sarco
penia in a Korean population and found a lower prevalence of
sarcopenia (men 6.3%, women 4.1%) compared to Western coun
tries when using ASM/Ht2 as the sarcopenia index (cutoff val
ues for men and women were 7.40 kg/m2 and 5.14 kg/m2, re
spectively). In a KLoSHA study with a sample population of adults older than 65 yr, the prevalence of sarcopenia was 35.3%
in men and 13.4% in women when ASM/Ht2 was used as the sarcopenia index (cutoff values for men and women were 7.09 kg/m2 and 5.27 kg/m2, respectively) (17). But a study of the prev
alence of sarcopenia in Korea using the KNHANES data showed that weightadjusted ASM is better than heightadjusted ASM in defining sarcopenia. When using ASM/Ht2, the prevalence of sarcopenia was 12.4% in men and 0.1% in women (cutoff val
ues for men and women were 6.58 kg/m2 and 4.59 kg/m2, re
spectively) (12). Though these studies performed in Korea seem to suggest different cutoff values, this is because each study en
rolled different study populations including various group of ages.
The present study, similar to other Korean studies, found that ASM/Ht2 was the best sarcopenia index for indicating osteopo
rosis, with cutoff values at 6.85 kg/m2 in men and 5.96 kg/m2 in women. The cutoff value for men ranged between Sarcopenia I (7.50) and II (6.58), and the cutoff value in women was higher than Sarcopenia I (5.38), which was the standard in previous Korean studies (12). The prevalence of sarcopenia in this study was 39.5% in men and 58.1% in women. Previous studies were limited in that the cutoff value for women was too low to deter
mine prevalence, but using ASM/Ht2 as an index seems to have addressed this issue. In addition, when sarcopenia was based on the optimal cutoff value, the sarcopenia group had increased risk of osteoporosis both in men (OR, 4.14; P < 0.001) and wom
en (OR, 1.88; P < 0.001). In particular, men (OR, 2.12; P = 0.0016) with sarcopenia were more greatly affected than women (OR,
1.15; P = 0.44), even after adjusting for age, fat mass, calcium intake, vitamin D status, smoking, alcohol consumption, and physical activity. This was demonstrated in previous studies showing that bone mass in men was more closely related to muscle mass than in women (2731). The gender difference in the relationship between bone and muscle are explained by gender specific effects of sex hormones. In men, changes to bone and muscle are controlled by increasing levels of testosterone and IGF1 resulting in increased muscle mass and strength, whe
reas in women, the higher level of estrogen results in bone mass tending to increase more rapidly in relation to muscle (27, 29).
And in both genders, aging causes loss in bone and muscle;
and the bone and muscle relationship is affected by gender dif
ferences in the rate of bone and muscle loss (32). Especially, agerelated decrease in testosterone and IGF1 levels may lead to decrease in muscle and bone in men, while, absolute level and degree of decline in testosterone are much lower in wom
en, muscle mass can be relatively preserved. In addition, me
chanical strain and estrogen share a common pathway involv
ing activation of estrogen receptorα (ERα), and a decline in ERα with menopause reduces the ability of mechanical load
ing to induce an osteogenic response (3335). This mechano
stat resetting due to estrogen deficiency may explain the de
coupling of muscle mass and bone density in women, with men tending to show higher correlations between muscle mass and real bone density. Therefore, this study suggests that for prevent
ing osteoporosis, sarcopenia could be more emphasized in men.
A crosssectional study, we were not able to verify causal re
lationships. However, participants had minimal radiation expo
sure during the study as they underwent the DXA study for as
sessment of both muscle mass and BMD simultaneously. And this showed a positive correlation between muscle mass and BMD in the Korean population. In addition, this study exam
ined the relationship between sarcopenia and osteoporosis separately in each sex. In previous studies the prevalence rate of sarcopenia in women was too low because the cutoff value used for this group was 4.595.27. But in this study, the cutoff value for women was 5.96 so that it was possible to predict that the prevalence rate would be higher than previously calculated with the ASM/Ht2 index.
As mentioned above, osteoporosis and sarcopenia have com
mon causal factors such as low levels of vitamin D, testosterone, estrogen, and insulin, as well as, reduced calorie intake and mal
nutrition (911). The present study identified that sarcopenia can increase the risk of osteoporosis and may lead to increased risk of bone fracture.
In conclusion, muscle mass is positively correlated with bone density in both men and women using the ASM/Ht2 index. The risk of osteoporosis increases when sarcopenia is diagnosed with a cutoff value of 6.85 kg/m2 in men and 5.96 kg/m2 in wo
men. Concurrently diagnosing osteoporosis with sarcopenia
may help prevent accidental falls and bone fractures.
ACKNOWLEDGMENT
The authors wish to acknowledge the statistical support of KD Han.
DISCLOSURE
The authors have no conflicts of interest to disclose.
ORCID
Sunyoung Kim http://orcid.org/0000-0003-4115-4455 Chang Won Won http://orcid.org/0000-0002-6429-4461 Byung Sung Kim http://orcid.org/0000-0002-4984-6918 Hyun Rim Choi http://orcid.org/0000-0003-4356-2831 Min Young Moon http://orcid.org/0000-0002-7207-8155
REFERENCES
1. Statistics Korea. Korean Statistical Information Service. Available at http:
//kosis.kr/statisticsList/statisticsList_01List.jsp?vwcd=MT_ZTITLE&par- entId=A [accessed on 20 February 2014].
2. Korea Centers for Disease Control and Prevention. The fourth and fifth Korea National Health and Nutrition Examination Survey (KNHANES IV-2,3 and V-1), 2008-2010. Available at http://knhanes.cdc.go.kr [ac- cessed on 20 February 2014].
3. Kannus P, Parkkari J, Niemi S, Palvanen M. Fall-induced deaths among elderly people. Am J Public Health 2005; 95: 422-4.
4. Smulders E, Weerdesteyn V, Groen BE, Duysens J, Eijsbouts A, Laan R, van Lankveld W. Efficacy of a short multidisciplinary falls prevention program for elderly persons with osteoporosis and a fall history: a ran- domized controlled trial. Arch Phys Med Rehabil 2010; 91: 1705-11.
5. Janssen I, Heymsfield SB, Ross R. Low relative skeletal muscle mass (sar- copenia) in older persons is associated with functional impairment and physical disability. J Am Geriatr Soc 2002; 50: 889-96.
6. NIH Consensus Development Panel on Osteoporosis Prevention, Di
agnosis, and Therapy. Osteoporosis prevention, diagnosis, and therapy.
JAMA 2001; 285: 785-95.
7. Baumgartner RN, Koehler KM, Gallagher D, Romero L, Heymsfield SB, Ross RR, Garry PJ, Lindeman RD. Epidemiology of sarcopenia among the elderly in New Mexico. Am J Epidemiol 1998; 147: 755-63.
8. CruzJentoft AJ, Baeyens JP, Bauer JM, Boirie Y, Cederholm T, Landi F, Martin FC, Michel JP, Rolland Y, Schneider SM, et al. Sarcopenia: Euro- pean consensus on definition and diagnosis: report of the European Work- ing Group on Sarcopenia in Older People. Age Ageing 2010; 39: 412-23.
9. Coin A, Sergi G, Marin S, Vianello A, Perissinotto E, Sarti S, Rinaldi G, Mosele M, Inelmen EM, Enzi G, et al. Predictors of low bone mineral density in elderly males with chronic obstructive pulmonary disease: the role of body mass index. Aging Male 2010; 13: 142-7.
10. Blain H, Jaussent A, Thomas E, Micallef JP, Dupuy AM, Bernard PL, Mar
ianoGoulart D, Cristol JP, Sultan C, Rossi M, et al. Appendicular skele-
tal muscle mass is the strongest independent factor associated with fem- oral neck bone mineral density in adult and older men. Exp Gerontol 2010; 45: 679-84.
11. Frisoli A Jr, Chaves PH, Ingham SJ, Fried LP. Severe osteopenia and os- teoporosis, sarcopenia, and frailty status in community-dwelling older women: results from the Women’s Health and Aging Study (WHAS) II.
Bone 2011; 48: 952-7.
12. Kim YS, Lee Y, Chung YS, Lee DJ, Joo NS, Hong D, Song Ge, Kim HJ, Choi YJ, Kim KM. Prevalence of sarcopenia and sarcopenic obesity in the Ko- rean population based on the Fourth Korean National Health and Nu- tritional Examination Surveys. J Gerontol A Biol Sci Med Sci 2012; 67:
1107-13.
13. Lim JS, Kim KM, Rhee Y, Lim SK. Gender-dependent skeletal effects of vitamin D deficiency in a younger generation. J Clin Endocrinol Metab 2012; 97: 1995-2004.
14. Orimo H, Hayashi Y, Fukunaga M, Sone T, Fujiwara S, Shiraki M, Kushida K, Miyamoto S, Soen S, Nishimura J, et al. Diagnostic criteria for prima- ry osteoporosis: year 2000 revision. J Bone Miner Metab 2001; 19: 331-7.
15. Kanis JA. Assessment of fracture risk and its application to screening for postmenopausal osteoporosis: synopsis of a WHO report: WHO Study Group. Osteoporos Int 1994; 4: 368-81.
16. Heymsfield SB, Smith R, Aulet M, Bensen B, Lichtman S, Wang J, Pier
son RN Jr. Appendicular skeletal muscle mass: measurement by dual- photon absorptiometry. Am J Clin Nutr 1990; 52: 214-8.
17. Kim JH, Hwang BY, Hong ES, Ohn JH, Kim CH, Kim HW, Ahn HY, Yoon JW, Kang SM, Park YJ, et al. Investigation of sarcopenia and its associa- tion with cardiometabolic risk factors in elderly subjects. J Korean Geri- atr Soc 2010; 14: 121-30.
18. Genaro PS, Pereira GA, Pinheiro MM, Szejnfeld VL, Martini LA. Influ- ence of body composition on bone mass in postmenopausal osteoporotic women. Arch Gerontol Geriatr 2010; 51: 295-8.
19. Van Langendonck L, Claessens AL, Lefevre J, Thomis M, Philippaerts R, Delvaux K, Lysens R, Vanden Eynde B, Beunen G. Association between bone mineral density (DXA), body structure, and body composition in middle-aged men. Am J Hum Biol 2002; 14: 735-42.
20. Pluijm SM, Visser M, Smit JH, PoppSnijders C, Roos JC, Lips P. Deter- minants of bone mineral density in older men and women: body com- position as mediator. J Bone Miner Res 2001; 16: 2142-51.
21. Rochefort GY, Pallu S, Benhamou CL. Osteocyte: the unrecognized side of bone tissue. Osteoporos Int 2010; 21: 1457-69.
22. Matsumine H, Hirato K, Yanaihara T, Tamada T, Yoshida M. Aromati- zation by skeletal muscle. J Clin Endocrinol Metab 1986; 63: 717-20.
23. Coin A, Perissinotto E, Enzi G, Zamboni M, Inelmen EM, Frigo AC, Man
zato E, Busetto L, Buja A, Sergi G. Predictors of low bone mineral density in the elderly: the role of dietary intake, nutritional status and sarcope- nia. Eur J Clin Nutr 2008; 62: 802-9.
24. Seeman E, Hopper JL, Young NR, Formica C, Goss P, Tsalamandris C.
Do genetic factors explain associations between muscle strength, lean mass, and bone density? a twin study. Am J Physiol 1996; 270: E320-7.
25. Rosenberg IH. Epidemiologic and methodologic problems in determin- ing nutritional status of older persons. Am J Clin Nutr 1989; 50: 1231-3.
26. Kim TN, Yang SJ, Yoo HJ, Lim KI, Kang HJ, Song W, Seo JA, Kim SG, Kim NH, Baik SH, et al. Prevalence of sarcopenia and sarcopenic obesity in Korean adults: the Korean sarcopenic obesity study. Int J Obes (Lond) 2009; 33: 885-92.
27. Zofková I. Hormonal aspects of the muscle-bone unit. Physiol Res 2008;
57: S159-69.
28. Hasselstrøm H, Karlsson KM, Hansen SE, Grønfeldt V, Froberg K, An
dersen LB. Sex differences in bone size and bone mineral density exist before puberty: the Copenhagen School Child Intervention Study (CoS- CIS). Calcif Tissue Int 2006; 79: 7-14.
29. Macdonald H, Kontulainen S, Petit M, Janssen P, McKay H. Bone strength and its determinants in pre- and early pubertal boys and girls. Bone 2006;
39: 598-608.
30. Rauch F, Bailey DA, BaxterJones A, Mirwald R, Faulkner R. The ‘mus- cle-bone unit’ during the pubertal growth spurt. Bone 2004; 34: 771-5.
31. Frost HM. The Utah paradigm of skeletal physiology: an overview of its insights for bone, cartilage and collagenous tissue organs. J Bone Miner Metab 2000; 18: 305-16.
32. Lang TF. The bone-muscle relationship in men and women. J Osteoporos 2011; 2011: 702735.
33. Lee KC, Lanyon LE. Mechanical loading influences bone mass through estrogen receptor alpha. Exerc Sport Sci Rev 2004; 32: 64-8.
34. Fricke O, Schoenau E. The ‘Functional Muscle-Bone Unit’: probing the relevance of mechanical signals for bone development in children and adolescents. Growth Horm IGF Res 2007; 17: 1-9.
35. Taaffe DR, Cauley JA, Danielson M, Nevitt MC, Lang TF, Bauer DC, Har
ris TB. Race and sex effects on the association between muscle strength, soft tissue, and bone mineral density in healthy elders: the Health, Aging, and Body Composition Study. J Bone Miner Res 2001; 16: 1343-52.